Abstract
Oxidative stress has been strongly implicated in the progression of Parkinson’s disease (PD). Depletion of cytoplasmic glutathione levels is one of the indications of oxidative stress, which occur in the substantia nigra of PD patients at an early stage of the disease process. It has been shown that glutathione depletion causes the inhibition of mitochondrial complex I, thus affecting mitochondrial function leading to oxidative stress via production of reactive oxygen species. Studies were carried out to investigate the role of D-512, a potent multifunctional neuroprotective D2/D3 receptor agonist, in protecting dopaminergic PC12 cells treated with buthionine sulfoximine (BSO), an inhibitor of key enzyme in glutathione synthesis and 6-hydroxydopamine (6-OHDA), a widely used neurotoxin. D-512 was able to restore level of glutathione against BSO/6-OHDA-mediated glutathione depletion. D-512 also showed significant neuroprotection in PC12 cells against toxicity induced by combined treatment of BSO and 6-OHDA. Furthermore, D-512 was able to restore both phospho-extracellular signal-regulated kinase and phospho-Jun N-terminal kinase levels upon treatment with 6-OHDA providing an evidence on the possible mechanism of action for neuroprotection by modulating mitogen-activated protein kinases. We have further demonstrated the neuroprotective effects of D-512 against oxidative insult produced by BSO and 6-OHDA in PC12 cells.
Keywords: Parkinson’s disease, D2/D3 agonist, Oxidative stress, Glutathione, PC12 cells, BSO, 6-OHDA
Introduction
Parkinson’s disease (PD) is a complex neurodegenerative disorder which is prevalent in the elderly population, leading to progressive loss of dopaminergic neurons in the substantia nigra (SN) of the mid brain. PD is characterized by the motor deficits and the cardinal symptoms of PD include the resting tremor, rigidity, bradykinesia, and impairment of postural reflexes (Bergman and Deuschl 2002). Among various pathological hall marks of PD, oxidative stress is one of the major factors which is thought to play a key role in the disease progression. One of the reasons of production of oxidative stress is due to dysregulation of dopamine (DA) metabolism resulting in increased production of reactive oxygen species (ROS) and/or accumulation of free radicals leading to the mitochondrial dysfunction (Hwang 2013; Jenner 2003; Zhou et al. 2008). Such series of events leads to the nigral dopaminergic neuronal cell death. It was also observed in the SN of the PD patients and animal models that ROS/free radicals cause changes in the various macromolecules, polyunsaturated fatty acids in the lipid membrane, proteins, and DNA (Alam et al. 1997a, b; Selley 1998). PD patient’s substantia nigra pars compacta (SNPc) have been shown to have significant elevation of lipid peroxides, oxidation of DNA, and protein carbonyls, which are indirect markers of oxidative burden (Zecca et al. 2004). Increased levels of oxidative stress might also cause loss of anti-oxidant capacity of cells. In fact, levels of total as well as reduced glutathione (a thiol tripeptide) have been shown to be significantly depleted in the SNPc of patients with PD (Sofic et al. 1992). Glutathione alteration has been shown to precede loss of dopaminergic neurons as well as accumulation of ‘‘Lewy bodies’’ in PD patients (Jenner and Olanow 1996). Alteration in glutathione levels has been shown to be directly related to severity of PD (Jenner and Olanow 1996). Post-mortem analysis evidence from PD patient’s brain shows significant increment in the oxidation of biomolecules of the SN region indicating the active involvement of ROS in the progression of PD (Jenner et al. 1992).
Production of endogenous toxins or exposure to stress-inducing environmental factors/toxins is thought to generate the ROS/free radicals leading to the initiation of oxidative stress in the dopamine neurons (Jenner et al. 1992). It was shown that accumulation of iron strongly promotes excessive generation of free radicals, adding oxidative burden and further promoting the vicious cycle of oxidative stress (Gille and Reichmann 2011; Jomova et al. 2010; Zecca et al. 2004). Apart from dopaminergic neurons, ROS-activated pathways also cause oxidative stress in non-neuronal cells such as astrocytes and microglia. This indicates the severity of oxidative changes in the SN of PD patient’s brain (de Pablos et al. 2014; Klein and Ackerman 2003). It is also conceivable that dopaminergic neuronal degeneration produces changes in the DA levels as a compensatory mechanism which might initiate disbalance of level of DA and increase in the oxidative stress. Although oxidative stress has intimate relationship with other patho-physiological factors of PD (Jenner 2003), however, oxidative stress may not be the only major factor responsible for the initiation of PD. Glutathione, catalase, super oxide dismutase, thioredoxin reductase, heme oxygenase, cysteine, ascorbate, tocopherol are the key anti-oxidant systems present in the cells. Anti-oxidant defense mechanism is low in the CNS when compared to peripheral organs (Reiter 1995). Increased production of ROS, including superoxide anion and nitric oxide can overburden the anti-oxidant systems of cells. This overload can cause dysfunction of anti-oxidant systems in cells resulting in the decreased clearance of oxidative species adding to the oxidative environment. One of the earliest biochemical changes that occur due to oxidative stress is decreased glutathione level in the cells. The levels of glutathione, particularly reduced glutathione (GSH) were found to be significantly low in the SN of PD patients (Perry et al. 1982; Sofic et al. 1992). It was also reported that extent of glutathione depletion correlates with the severity of PD (Jenner and Olanow 1996). The thiol tripeptide, glutathione is an important non-enzymatic anti-oxidant present in the cells. Glutathione also acts as a transport and storage form of cysteine. Glutathione metabolism is regulated by various enzymes. In the glutathione synthesis, the first step involves the formation of γ-glutamylcysteine from glutamate and cysteine catalyzed by γ-glutamylcysteine ligase γ-GCL) which is the rate-limiting enzyme. In the second step, glycine is added to the γ-glutamylcysteine in presence of glutathione synthase. Glutathione reductase (GR) reduces oxidized glutathione to maintain the GSH levels. However, GSH levels are altered under oxidative stress conditions. Glutathione S-transferases (GSTs) conjugate peroxides and carbonyl-containing compounds with GSH and excrete them out to protect cells from lipid peroxidation. It was also reported that except γ-glutamyl transpeptidase (γ-GTP) which showed twofold increase, other enzymes of glutathione system were not altered (Sian et al. 1994b). Conjugation of glutathione and its amino acid (cysteine) with oxidized products of DA, L-DOPA, DOPAC (dopamine metabolite), and other catecholamines has been also suggested to result in decrease of reduced glutathione levels (Linert and Jameson 2000; Shen and Dryhurst 1996; Spencer et al. 1998). Decreased levels of glutathione in the SN region of brain may reduce the clearance of hydrogen peroxide formed by DA auto-oxidation. Reduction of hydrogen peroxide clearance from cells may promote iron-induced formation of hydroxyl radical (Martin and Teismann 2009). 6-hydroxydopamine (6-OHDA) is one of the widely used neurotoxins for neuronal degeneration by simulating oxidative stress in vitro as well as in vivo experiments. Like dopamine, 6-OHDA is also a substrate for the oxidation by monoamine oxidase B (MAO-B). 6-OHDA crosses cell membrane through dopamine transporters/receptors and inhibits mitochondrial respiration. It has been shown to induce toxicity by auto-oxidation and hydrogen peroxide generation (Blum et al. 2000). L-Buthionine sulfoximine (BSO) induces oxidative stress by depleting GSH when treated with cells or administered to animals. The mechanism involves its specific action with irreversible inhibition of γ-glutamyl-cysteine synthetase (γ-GCS), the rate-limiting enzyme of GSH synthesis (Griffith 1982).
In continuation to our previous work on D-512 (Fig. 1), one of our lead compounds and a highly potent multifunctional D2/D3 receptors agonist for the symptomatic and neuroprotective treatment of PD, we have further investigated the anti-oxidant protective effects of D-512 in BSO- and 6-OHDA-induced oxidative stress model of PC12 cells (a rat pheochromocytoma line). Previously, we have demonstrated the neuroprotective properties of D-512 in MN9D and PC12 cells. Dose-dependent treatment of D-512 has shown significant neuroprotection in dopaminergic MN9D cells against 6-OHDA- and MPP+-induced toxicity and in PC12 cells against 6-OHDA-induced toxicity (Santra et al. 2013; Shah et al. 2014). In addition, in our recent report, we have shown D-512 rescues dopaminergic neurons from the toxicity of 1-methyl-4-phenyl-1,2,3,6-tetrahydropyridine (MPTP) in mice (Shah et al. 2014). In the present study, we have investigated the ability of D-512 to restore the redox equilibrium of the PC12 cells under oxidative stress conditions and to replenish or restore the anti-oxidant systems, glutathione in particular. We have also carried out a mechanistic study to get an insight into neuroprotection conferred by D-512 from toxicity of 6-OHDA in PC12 cells. In addition, we have evaluated the effect of D-512 in rescuing PC12 cell death under severe oxidative insult induced by combined treatment of BSO and 6-OHDA. Here, we present a mechanistic study for neuroprotective action of D-512 in PC12 cells under various oxidative stress conditions.
Fig. 1.
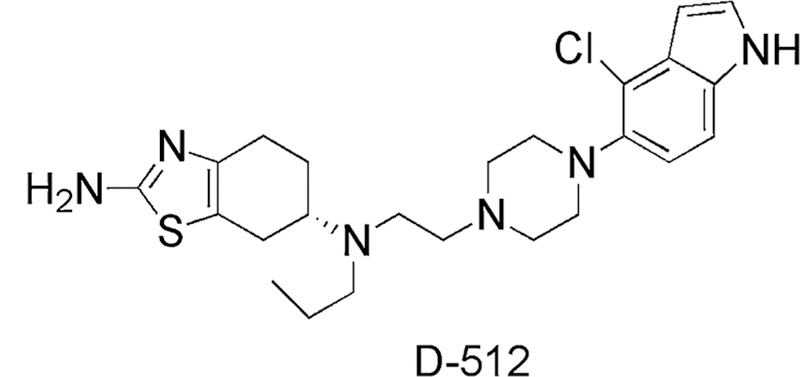
Molecular structure of D-512
Materials and Methods
Materials
Compound D-512[(6S)-N6-(2-(4-(4-chloro-1H-indol-5-yl)piperazin-1-yl)ethyl)-N6-propyl-3a,4,5,6,7,7a-hexahy drobenzo[d]thiazole-2,6-diamine] was synthesized in house (Johnson et al. 2012). PC12 Adh (ATCC CRL1721.1™) cells, a rat adrenal pheochromocytoma cell line, were purchased from ATCC. RPMI 1640, heat-inactivated horse serum, fetal bovine serum, penicillin–streptomycin, and trypsin were purchased from GIBCO. 6-OHDA hydrochloride, dimethyl sulfoxide, reduced L-glutathione, methyl thiazolyl blue tetrazolium bromide (MTT), BSO, sulfosalicylic acid, dithio-bis-nitrobenzoic acid, GR, NADPH, and dulbecco’s phosphate-buffered saline were purchased from Sigma-Aldrich. BCA protein assay reagents, and horse-radish peroxidase-conjugated rabbit secondary antibody and anti-mouse secondary antibody were purchased from the Thermo Fisher Scientific Inc. (Rockford, IL, USA). Phospho-extracellular signal-regulated kinase (p-ERK1/2), total ERK1/2, phospho-Jun N-terminal kinase (p-JNK), and total JNK antibodies were purchased from Cell Signaling Technology Inc. (Danvers, MA, USA). Z-VAD-FMK and γ-GCLC antibody were purchased from Abcam, USA. RIPA lysis buffer, anti-GAPDH antibody was purchased from Santa Cruz Biotechnology Inc. (Santa Cruz, CA, USA). Ten percent mini-protean TGX gels were obtained from Bio-Rad laboratories (Hercules, CA, USA).
Cell Culture and Treatments
Cells were cultured in T-75 flask (Greiner Bio One, Frickenhausen, Germany) and maintained in RPMI 1640 medium supplemented with 10 % heat-inactivated horse serum, 5 % fetal bovine serum, 100 U/mL penicillin, and 100 μg/mL streptomycin at 37 °C in 95 % air/5 % CO2 atmosphere. Stock solutions of D-512 and 6-OHDA were prepared in DMSO and aliquots were stored at −20 and −80 °C, respectively. Stock solution of reduced glutathione standard was prepared in DI water and aliquots were stored at −20 °C. For all experiments assessing the anti-oxidant and neuroprotective effects of D-512, PC12 cells were pretreated with indicated concentrations of D-512 for 24 h and co-treated with D-512, and indicated concentrations of 6-OHDA for another 24 h unless stated otherwise. Controls were treated with media containing 0.01 % DMSO.
Estimation of Total Glutathione (Absorbance Method)
Total glutathione levels were evaluated using quantitative colorimetric assay. PC12 cells were seeded at 2 × 10⁵ cells/well density in 2 mL media in 12-well plates for 24 h. Cells were treated with varying concentrations of BSO or 6-OHDA for 6 or 24 h to determine their optimum concentration for glutathione depletion. Neuroprotection experiments were performed by pretreating cells for 24 h with different concentrations of D-512 followed by their co-treatment with 1.56 μM BSO (optimized concentration for 50 % glutathione depletion from 24 h experiment) for 6 or 24 h. After incubation, cells were scraped with cell scraper, centrifuged, and washed with 1X PBS. Cells were resuspended in 25 μL 5 % sulfosalicylic acid. Resuspended cells were subjected to two freeze–thaw cycles. Cell lysate was incubated on ice for 10 min. Cell debris was pelleted down by centrifugation at 14,000 rpm (16,800×g) for 10 min at 4 °C. 10 μL of supernatant was added to 96-well plate. Total glutathione levels were measured by adding 150 μL dithionitrobenzoic acid (1.5 mg/mL) and GR (~6 U/mL) mixture followed by addition of 50 μL NADPH (0.16 mg/mL) to initiate the reaction which was followed by monitoring at 412 nm using microplate reader (Biotek Synergy, USA). Total glutathione levels for samples were calculated by generating standard curve with known glutathione standards. Total glutathione levels were expressed as percentage of untreated control cells.
Measurement of Oxidized Glutathione and Total Glutathione Levels (Fluorescence Method)
Oxidized glutathione and total glutathione levels were measured using glutathione fluorescence detection kit (Arbor Assays, USA) following manufacturer’s protocol. Briefly, PC12 cells were seeded at 5 × 10⁵ cells/well density in 2 mL media in six-well plates for 24 h. Adhered PC12 cells were treated with different concentrations of D-512 for 24 h followed by their co-treatment with 25 μM 6-OHDA and various concentrations of D-512 for 6 or 24 h. After incubation, cells were scraped with cell scraper, centrifuged, and washed with 1X PBS. Cell pellets were resuspended in 50 lL 5 % sulfosalicylic acid. Resuspended cells were subjected to two freeze–thaw cycles. Cell lysate was incubated on ice for 10 min. Cell debris was pelleted down by centrifugation at 14,000 rpm (16,800×g) for 10 min at 4 °C. Supernatant was diluted 1:5 with assay buffer to make the final concentration of sulfosalicylic acid 1 %. 50 μL of diluted sample was incubated with 25 μL of thiostar reagent for 15 min. Free glutathione levels of samples were obtained by reading fluorescence at 370 nm excitation and 510 nm emission wavelengths using synergy microplate reader (Biotek, Winooski, VT, USA). Afterwards, total glutathione levels of the same samples were determined by incubating samples for 15 min with 25 μL reaction mixture (containing GR and NADPH) and obtaining the fluorescence signal at 370 nm excitation and nm emission wavelength. Both the free and total glutathione levels of samples were calculated by generating standard curve with known glutathione standards. Free and total glutathione levels were expressed as percentage of control cells.
Western Blot Analysis
Modulations of mitogen-activated protein (MAP) kinase levels (ERK and JNK) were measured by Western blot at earlier time points (0.5, 1, 2, and 4 h for ERK and 0.5, 2, and 4 h for JNK). Also, expression of γ-GCLC was evaluated with 6-OHDA treatment at 6 and 24 h time points and with BSO + D512 at 24 h. PC12 cells were plated at 5 × 10⁵ cells/well density in 6-well plate and they were allowed to adhere for 24 h. For MAP kinase experiments, cells were pretreated with 10 μM D-512 for 24 h. Afterwards, the cells were co-treated with 75 μM 6-OHDA for different time periods (0.5, 1, 2, and 4 h). For γ-GCLC experiment against 6-OHDA, cells were treated with 50 μM 6-OHDA for 6 and 24 h time periods. For γ-GCLC experiment with BSO and D-512, cells were pretreated with 20 μM D-512 for 24 h. Afterwards, the cells were co-treated with 1.56 μM BSO for another 24 h. 40 μg of proteins was separated on 10 % tris–glycine gel by sodium dodecyl sulfate polyacrylamide gel electrophoresis (SDS-PAGE). Afterwards, proteins were transferred to polyvinylidene fluoride (PVDF) membrane (Bio-Rad). Membrane was blocked with 5 % Bovine Serum Albumin (BSA) or 5 % (w/v) nonfat dry milk in TBST for 1 h. Blocked membrane was incubated overnight with primary antibody against phospho-Erk1/2, total Erk1/2, phospho-JNK, total JNK, γ-GCLC, and GAPDH (1:1000 dilution) in 5 % BSA or 5 % (w/v) nonfat dry milk in TBST. Afterwards, membrane was incubated with appropriate HRP-conjugated secondary antibody (anti-mouse or anti-rabbit) (1:5000 dilution) in 5 % (w/v) nonfat dry milk in TBST. The image was visualized using ECL-Plus reagent (Perkin– Elmer, Waltham, MA, USA) and ImageQuant LAS 4000 imager (GE Healthcare Biosciences, Pittsburgh, PA, USA). Densitometric analysis was performed using ImageJ software.
Apoptosis Measurement with Pan-Caspase Inhibition
Apoptosis in PC12 cells against 6-OHDA toxicity upon caspase inhibition using a known broad spectrum pharmacological pan-caspase inhibitor, Z-VAD-FMK was estimated using a quantitative colorimetric MTT assay. Briefly, PC12 cells were plated at 17,000 cells/well density in 100 μL media in 96-well plates for 24 h. Initially, cells were pretreated with 100 μM of Z-VAD-FMK (Abcam, USA) from a stock concentration of 100 mM prepared in DMSO for 1 h. Control and 6-OHDA alone treatment groups (i.e., without Z-VAD-FMK pretreatment) received complete media with equal concentrations of DMSO. After 1 h, cells were co-treated with varying concentrations of 6-OHDA (100, 75, 50, and 25 μM) for 24 h. After incubation, MTT assay was performed as described in ‘‘Measurement of cell viability.’’
Measurement of Cell Viability
Neuroprotective effect of D-512 upon combined treatment of BSO and 6-OHDA was estimated using a quantitative colorimetric MTT assay. PC12 cells were plated at 17,000 cells/well density in 100 μL media in 96-well plates for 24 h. Initially, cells were treated with 1.56 μM BSO for 6 or 24 h followed by treatment with varying concentrations of 6-OHDA for another 24 h to determine their direct effect on cell viability and to determine the optimum concentration of 50 μM 6-OHDA in neuroprotection experiments. Neuroprotection experiments were carried out in four different treatment methods. In the first and second treatment methods, cells were pretreated with varying concentrations of D-512 along with 1.56 μM BSO for 6 or 24 h followed by 50 μM 6-OHDA treatment alone or co-treatment with D-512 for 24 h. For third and fourth treatment methods, cells were pretreated with varying concentrations of D-512 for 24 h followed by co-treatment with 1.56 μM BSO for 6 or 24 h and the final treatment with 50 μM 6-OHDA alone or co-treatment with D-512 for h. For the treatment groups of both 6 and 24 h involving either pretreatment with D-512 followed by co-treatment with BSO or co-treatment with BSO alone followed by fresh treatment with 6-OHDA alone for 24 h, the D-512-treated control groups received media only in the final 24 h followed by treatment with D-512. On the other hand, for the remaining two treatment groups, the D-512 control groups received only media containing D-512. After incubation, 5 mg/mL MTT was added to the cells (final concentration of MTT 0.5 mg/mL per well) and the plate was further incubated at 37 °C in 95 % air/5 % CO2 atmosphere for 3–4 h to produce dark blue formazan crystals. Afterwards, the plate was centrifuged at 1500 rpm (450×g) for 10 min and the supernatants were carefully removed. The formazan crystals were dissolved by adding μL of methanol: DMSO (1:1) mixture to each well and shaking at room temperature for 30 min. The absorbance values were measured using micro plate reader (Biotek Epoch, USA) at 570 nm with background correction done at 690 nm. Data from at least three experiments were analyzed using Graphpad software (Version 4, San Diego, USA). Cell viability was defined as a percentage reduction in absorbance compared to untreated controls.
Statistical Analysis
Statistical analyses were performed using GraphPad Prism 4.0 Software (San Diego, CA). All the toxin-treated sets were compared by one-way ANOVA with Tukey’s post-test.
Results
Effect of D-512 on Buthionine sulfoximine (BSO)-Induced Glutathione Depletion in PC12 Cells
BSO is a well-known enzyme inhibitor which induces oxidative stress in a cell by irreversibly inhibiting the enzyme γ-GCS which has a key role in the glutathione synthesis (Martin and Teismann 2009). Initially, we evaluated the effect of varying concentrations of BSO and D-512 alone on the glutathione levels in PC12 cells at different time points (Fig. 2a–d). D-512 treatment alone showed dose-dependent increase of total GSH levels compared to untreated control cells at 6 and 24 h (Fig. 2c, d). For BSO alone experiment, total GSH was depleted dose dependently at both 6 and 24 h (Fig. 2a, b). It was observed that at 6 h, 1.56 μM BSO causes ~20 % total GSH depletion, while the same dose causes ~55 % depletion at 24 h compared to untreated control cells (Fig. 2a, b). To evaluate the effect of D-512 against BSO-induced glutathione depletion, PC12 cells were pretreated with varying concentrations of D-512 for 24 h followed by co-treatment with 1.56 μM BSO for either 6 or 24 h. PC12 cells pretreated with D-512 (20, 10, 5, and 1 μM) followed by co-treatment with 1.56 μM BSO for 6 and 24 h separately. We observed that D-512 at concentration of 20 μM was able to restore total GSH levels 6 h post-treatment of 1.56 μM BSO (Fig. 2e). At 24 h post-treatment, we observed that D-512 at 20, 10, and 5 μM concentrations afforded significant protection against 1.56 μM BSO in PC12 cells (Fig. 2f).
Fig. 2.
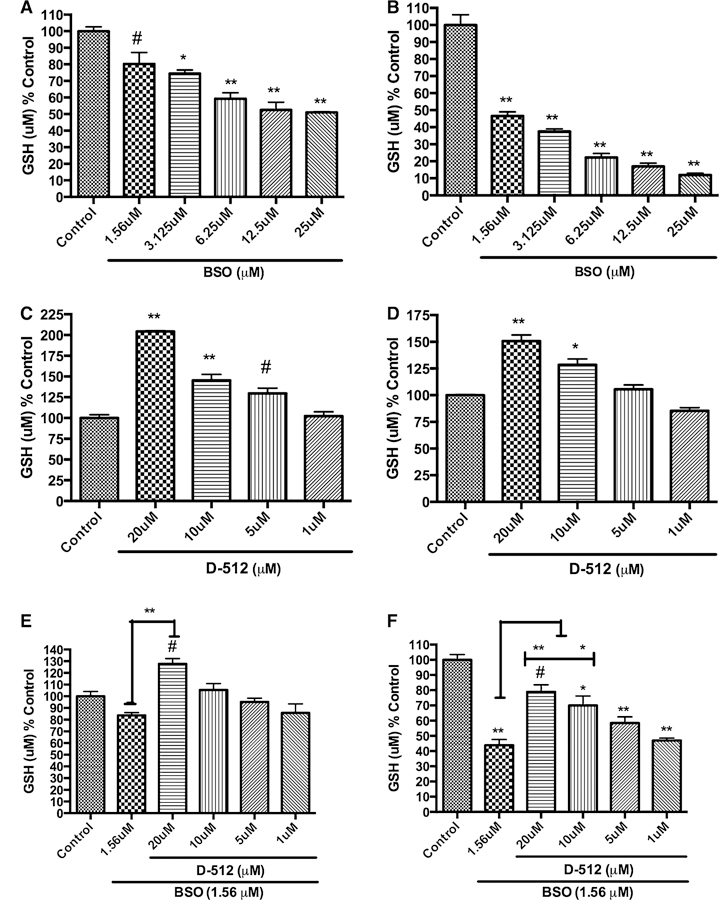
Dose-dependent effect of the BSO alone, D-512 alone, or pretreatment followed by the co-treatment of D-512 with 1.56 μM BSO on the total glutathione levels of PC12 cells for 6 and 24 h. Dose-dependent effect of BSO on total glutathione levels upon treatment for 6 h (a) and 24 h (b). Dose-dependent effect of D-512 on total glutathione levels upon treatment for 30 h (c) and 48 h (d). PC12 cells were pretreated with different concentrations of D-512 for 24 h followed by co-treatment with 1.56 μM BSO for either 6 h (e) or 24 h (f). The values shown are the mean ± SD of at least three independent experiments performed with 3–4 replicates. One-way ANOVA analysis followed by Tukey’s multiple comparison post hoc test was performed (**p < 0.001, *p < 0.01, #p < 0.05 compared to control or BSO control)
Effect of D-512 on 6-OHDA-Induced Changes in Oxidized and Total Glutathione Levels
Initially, we evaluated the effect of 6-OHDA alone in a dose-dependent manner at two different time points (6 and 24 h) on total glutathione levels of PC12 cells (Fig. 3a, b). From the results shown in Fig. 3a, b, we observed an interesting different trend at 6 h when compared to 24 h of 6-OHDA treatment. A gradual concentration-dependent decrease in total GSH level was observed with 6 h treatment regimen, whereas with 24 h treatment a gradual increase of total GSH level was observed with increasing concentration followed by decrease in the GSH level with higher concentration (75 and 100 μM). Thus, at 6 h treatment with 25 μM 6-OHDA caused around ~20 % total GSH depletion, whereas, at 24 h treatment with 25 μM 6-OHDA caused around ~65 % increase in total GSH levels compared to untreated control cells (Fig. 3a, b). To assess the effect of pretreatment of D-512 followed by co-treatment with D-512 and 6-OHDA for 6 h on total glutathione levels, we employed three different concentrations of D-512 (10, 5, and 1 μM). In the 6-h treatment with 6-OHDA and D-512, we observed that D-512 at 10 μM concentration was able to restore the total glutathione levels significantly against 25 μM 6-OHDA-induced decrease in total GSH (Fig. 4). Whereas, 24-h treatment with 6-OHDA and D-512 showed that 10 μM D-512 induced significant increase in total GSH compared to 25 μM 6-OHDA-treated PC12 cells (Fig. 5).
Fig. 3.
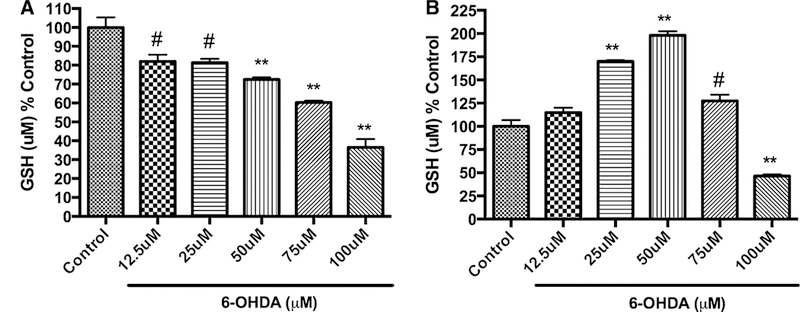
Dose-dependent effect of 6-OHDA on total glutathione levels upon treatment for 6 h (a) and 24 h (b). PC12 cells were treated with different concentrations of 6-OHDA for either 6 h (a) or 24 h (b). The values shown are the mean ± SD of at least three independent experiments performed with three replicates. One-way ANOVA analysis followed by Tukey’s multiple comparison post hoc test was performed (**p <\ 0.001, #p < 0.05 compared to control)
Fig. 4.
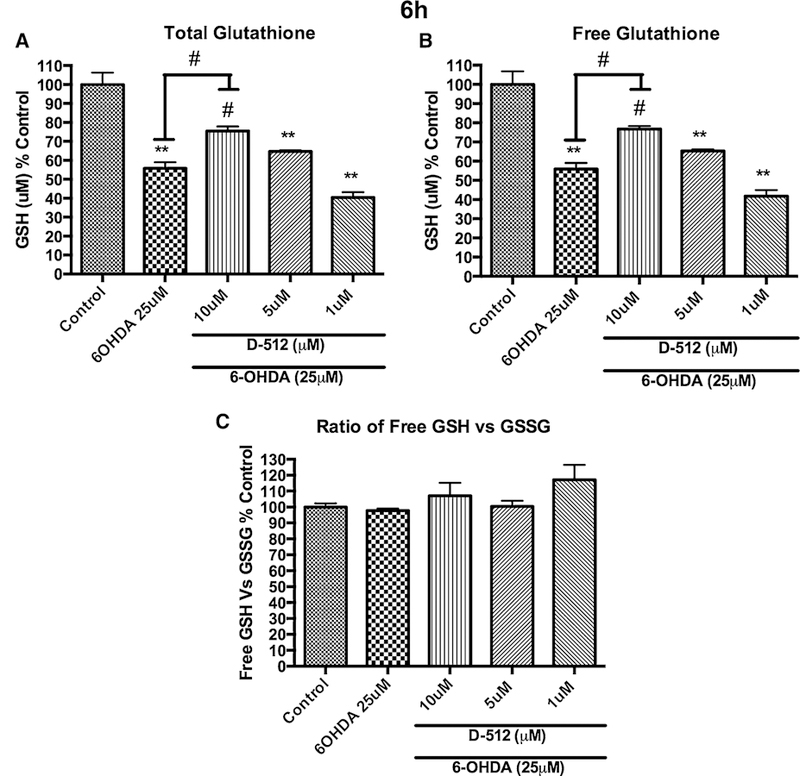
Dose-dependent effect of the pretreatment of D-512 followed by the co-treatment of D-512 with 25 μM 6-OHDA on the total glutathione levels (a), free glutathione levels (b), and the ratio between free glutathione and oxidized glutathione (c). PC12 cells were pretreated with different concentrations of D-512 for 24 h followed by co-treatment with 25 μM 6-OHDA for 6 h. The values shown are the mean ± SD of at least three independent experiments performed with 3–4 replicates. One-way ANOVA analysis followed by Tukey’s multiple comparison post hoc test was performed (**p \ 0.001, #p \ 0.05 compared to control or 6-OHDA)
Fig. 5.
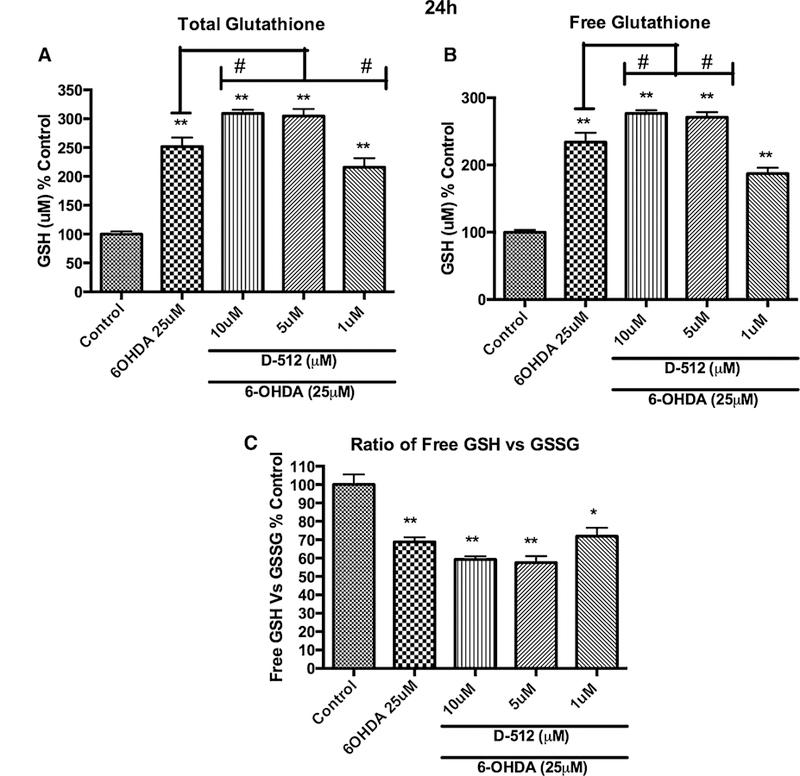
Dose-dependent effect of the pretreatment of D-512 followed by the co-treatment of D-512 with 25 μM 6-OHDA on the total glutathione levels (a), free glutathione levels (b), and the ratio between free glutathione and oxidized glutathione (c). PC12 cells were pretreated with different concentrations of D-512 for 24 h followed by co-treatment with 25 μM 6-OHDA for 24 h. The values shown are the mean ± SD of at least three independent experiments performed with 3–4 replicates. One-way ANOVA analysis followed by Tukey’s multiple comparison post hoc test was performed (**p \ 0.001, *p \ 0.01 compared to control and **p \ 0.001, #p \ 0.05 compared to 6-OHDA)
6-OHDA and BSO + D-512 Modulates γ-Glutamylcysteine Synthetase (γ-GCLC) Expression Levels
With the results from glutathione estimation, we evaluated the effect of 6-OHDA on γ-GCLC, a key enzyme in the glutathione synthesis. Western blot analysis of the lysates of PC12 cells treated with 6-OHDA at 6 and 24 h showed a decreased concentration of γ-GCLC at 6 h (~25 %). However, there was an increase in the γ-GCLC concentration (~30 %) at 24 h (Fig. 6a). Next, we performed WB analysis of the PC12 cells pretreated with D-512 for 24 h followed by co-treatment with BSO for another 24 h or BSO alone for 24 h. We did not observe any significant change in the γ-GCLC levels in the treatment groups of D-512 + BSO or D-512 alone when compared to control cells (Fig. 6b). Interestingly, we have observed an elevation (~30 %) in the γ-GCLC in BSO alone-treated cells (Fig. 6b)
Fig. 6.
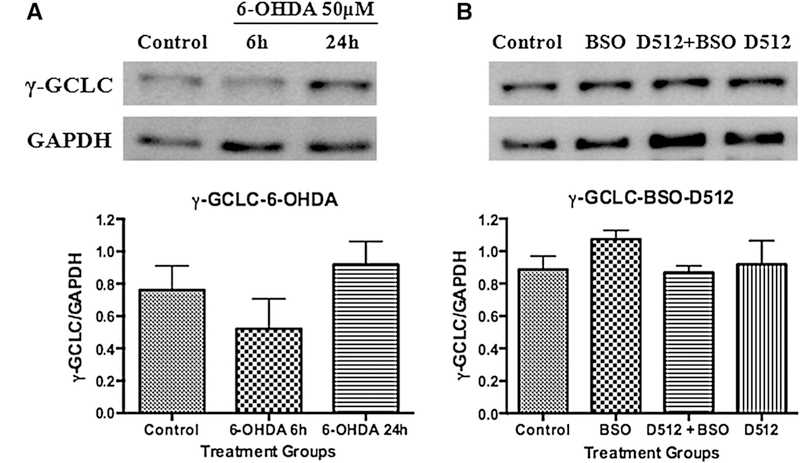
Western blot analysis on the expression of γ-glutamylcysteine synthetase (γ-GCLC) against 6-OHDA (a) and BSO with/withoutD-512 (b). For 6-OHDA experiment, PC12 cells were treated with 50 μM 6-OHDA for 6 and 24 h. For BSO experiment, PC12 cells were pretreated with 20 μM D512 for24 h followed by co-treatment with 1.56 μM BSO for another24 h. GAPDH was used as an internal control protein. Western blotting experiments are performed in triplicate or more and the quantifications are the average of these experiments
D-512 Restores MAP Kinase Levels
Specific cellular responses, including morphogenesis, cell death, and stress responses are mediated by various MAP kinases (Keshet and Seger 2010; Zhang and Liu 2002). In this regard, we have carried out Western blot analysis to evaluate the modulation of two important MAP kinases namely extracellular signal-regulated kinase (ERK) and Jun N-terminal kinase (JNK) upon pretreatment of PC12 cells with D-512 followed by co-treatment with 6-OHDA at different time points. ERK plays an important role in the cell regulation, growth, and differentiation. JNKs are known as stress-activated protein kinases and gets activated under various stress conditions (Davila and Torres-Aleman 2008; McCubrey et al. 2006). Upregulation of phospho-ERK1/2 and phospho-JNK levels were observed in time-dependent fashion (Fig. 7a, b) when PC12 cells were exposed to 75 μM 6-OHDA alone at different time points. Next, PC12 cells were pretreated with 10 μM D-512 for 24 h followed by co-treatment with 75 μM 6-OHDA at different time intervals (0.5, 1, 2, and 4 h for ERK and 0.5, 2, and 4 h for JNK). It was observed that at 2- and 4-h time points, D-512 was able to significantly restore the 6-OHDA-induced elevated phospho-ERK1/2 close to normal control level (Fig. 7a). However, in the case of JNK, no significant difference was observed com-pared to level induced by 6-OHDA alone (Fig. 7b).
Fig. 7.
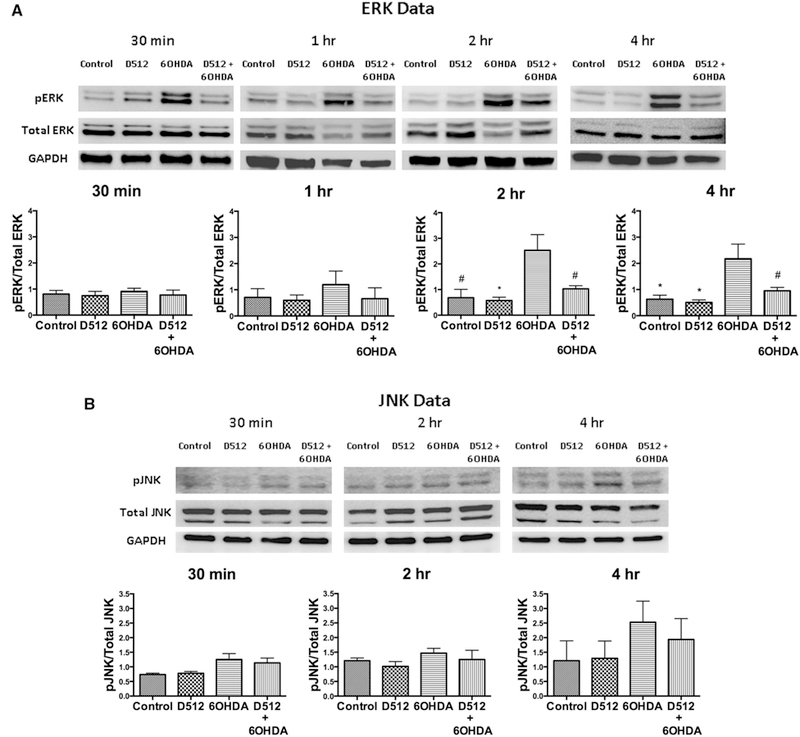
a Western blot analysis on the effect of D-512 in modulating MAP kinase (pERK). PC12 cells were pretreated with 10 μM D512 for 24 h followed by co-treatment with 75 μM 6-OHDA at different time points (0.5, 1, 2, and 4 h). GAPDH was used as an internal control protein. Western blotting experiments are performed in triplicate or more and the quantifications are the average of these experiments. One-way ANOVA analysis followed by Tukey’s multiple comparison post hoc test was performed (*p \ 0.01, #p \ 0.05 compared to control and #p \ 0.05 compared to 6-OHDA group for 2 h treatment; *p \ 0.01 compared to 6-OHDA group and #p \ 0.05 compared to D512 + 6-OHDA group for 4-h treatment). b Western blot analysis on the effect of D-512 in modulating MAP kinase (p-JNK). PC12 cells were pretreated with 10 μM D512 for 24 h followed by co-treatment with 75 μM 6-OHDA at different time points (0.5, 2, and 4 h). GAPDH was used as an internal control protein. Western blotting experiments are performed in triplicate or more and the quantifications are the average of these experiments
6-OHDA Toxicity Proceeds with Caspase Inhibition
Caspases are the central effector components of the cell fate and their activation causes apoptosis-mediated cell death. Inhibition or suppression of caspase activation prevents apoptosis (Choi et al. 1999; Degterev et al. 2003). In this context, we have measured the apoptosis caused in PC12 cells upon treatment with varying concentrations of 6-OHDA in presence/absence of cell-permeant broad range pan-caspase inhibitor, Z-VAD-FMK. Results showed significant inhibition of apoptosis-mediated cell death at 25 and 50μM 6-OHDA (Fig. 8). However, apoptosis inhibition was to be found below at 75 and 100 μM (Fig. 8).
Fig. 8.
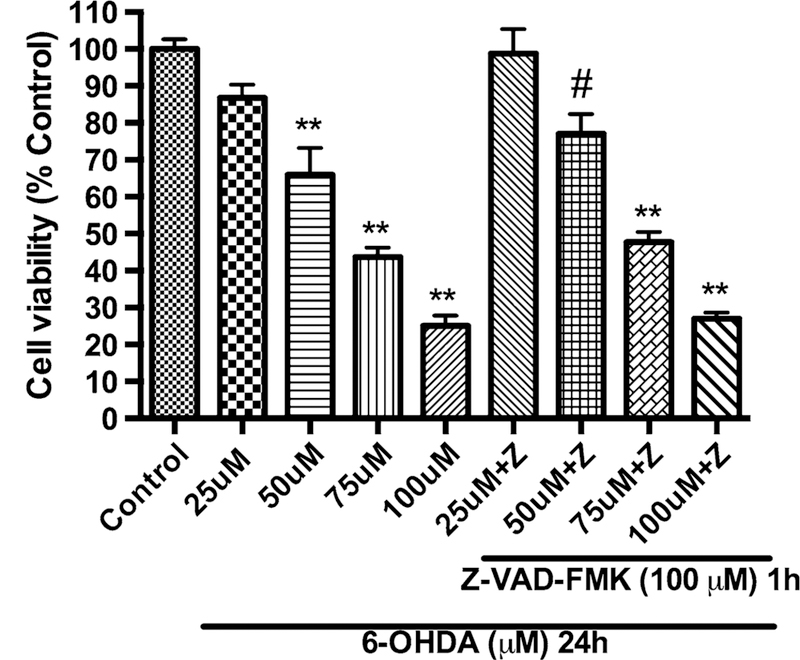
Measurement of apoptosis in PC12 cells against 6-OHDA toxicity upon caspase inhibition using pan-caspase inhibitor, Z-VAD-FMK. PC12 cells were pretreated with 100 μM of Z-VAD-FMK for h followed by co-treatment with varying concentrations of 6-OHDA (100, 75, 50, and 25 μM) for 24 h. The values shown are the mean ± SD of at least three independent experiments performed with 6–8 replicates. One-way ANOVA analysis followed by Tukey’s multiple comparison post hoc test was performed (**p \ 0.001, #p \ 0.05 compared to control group)
D-512 Protects Glutathione-Depleted PC12 Cells Against 6-OHDA-Induced Toxicity
Based on the glutathione experiments with BSO and 6-OHDA, we have designed a model experiment to deplete glutathione levels in PC12 cells by using BSO which was followed by treatment with 6-OHDA. The model which mimicked pathogenesis state of PD in human was based on the fact that PC12 cells with reduction in the cellular glutathione levels should be more vulnerable to the toxicity induced by treatment with 6-OHDA. Initially, we treated PC12 cells with 1.56 μM BSO for either 6 or 24 h followed by different doses of 6-OHDA alone (25, 50, 75, and 100 μM) for another 24 h to produce the toxicity profile. Previously, we have reported that 75 μM 6-OHDA treatment alone can cause *50 % toxicity in PC12 cells (Shah et al. 2014) and similar toxicity is obtained with pretreatment of 1.56 μM BSO for 24 h followed by 50 μM 6-OHDA treatment alone (Fig. 9). This result suggests that cells are more vulnerable to 6-OHDA toxicity under depleted cellular glutathione level conditions. Under these conditions, we wanted to evaluate the effect of D-512 in protecting PC12 cells using 4 different treatment methods. In the first method, cells were co-treated with varying concentrations of D-512 along with 1.56 μM BSO for either 6 or 24 h followed by treatment with 50 μM 6-OHDA alone for 24 h. In the second method, cells were co-treated with varying concentrations of D-512 along with 1.56 μM BSO for 6 or 24 h followed by fresh co-treatment of D-512 with 50 μM 6-OHDA for 24 h. For the third treatment method, cells were pretreated with varying concentrations of D-512 for 24 h followed by co-treatment with 1.56 μM BSO for 6 or 24 h and final treatment with 50 μM 6-OHDA alone for 24 h. For the fourth treatment method, cells were pretreated with varying concentrations of D-512 for 24 h followed by co-treatment with 1.56 μM BSO for 6 or 24 h and final co-treatment with D-512 and 50 μM 6-OHDA for another 24 h. For the first treatment method, we have observed the protection levels less than 5 % for 6 h and 5–10 % for 24 h treatment in the con-centration range of 5–20 μM of D-512 (Figs. 10a, 11a). In the second method where D-512 and BSO were co-treated followed by co-treatment of fresh D-512 with 6-OHDA resulted in a clear increment in the protection levels. We see a significant protection of *15–20 % with D-512 in the range 5–20 μM for 6 h treatment method, while the similar protection levels are also observed in the concentration range of 5–10 μM in the 24-h treatment method (Figs. 10b, 11b). Third and fourth treatment methods of 6-h experiment showed some improvement in the protection levels of D-512 in the concentration range of 5–20 μM, while we have observed elevated levels of protection in the 24 h experiments in the dose range of 5–10 μM of D-512. As shown in the Figs. 10c, 11c, D-512 was able to protect cells to an extent of 20–30 % at a concentration of 5 and 10 μM, while the last treatment method conferred highest protection of approximately 25–35 % in the same concentration range (Figs. 10d, 11d). BSO alone at 1.56 μM did not cause any cell death in all the above experiments (Figs. 9, 10c, d, 11a–d).
Fig. 9.
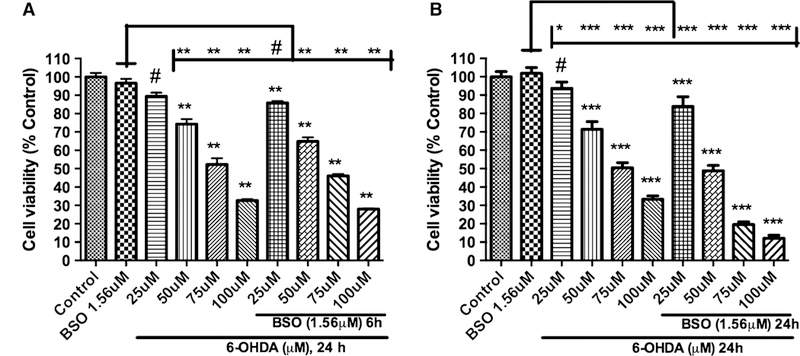
Dose-dependent effect of the combination treatment of 1.56 μM BSO and 6-OHDA on the cell viability of PC12 cells. PC12 cells were pretreated for 6 or 24 h with BSO followed by the treatment of different concentrations of 6-OHDA for 24 h on the cell viability of PC12 cells (a, b). The values shown are the mean ± SD of at least three independent experiments performed with 6–8 replicates. One-way ANOVA analysis followed by Tukey’s multiple comparison post hoc test was performed (***p \ 0.0001, **p \ 0.001, #p \ 0.05 compared to control and ***p \ 0.0001, **p \ 0.001, *p \ 0.01, #p \ 0.05 compared to BSO group)
Fig. 10.
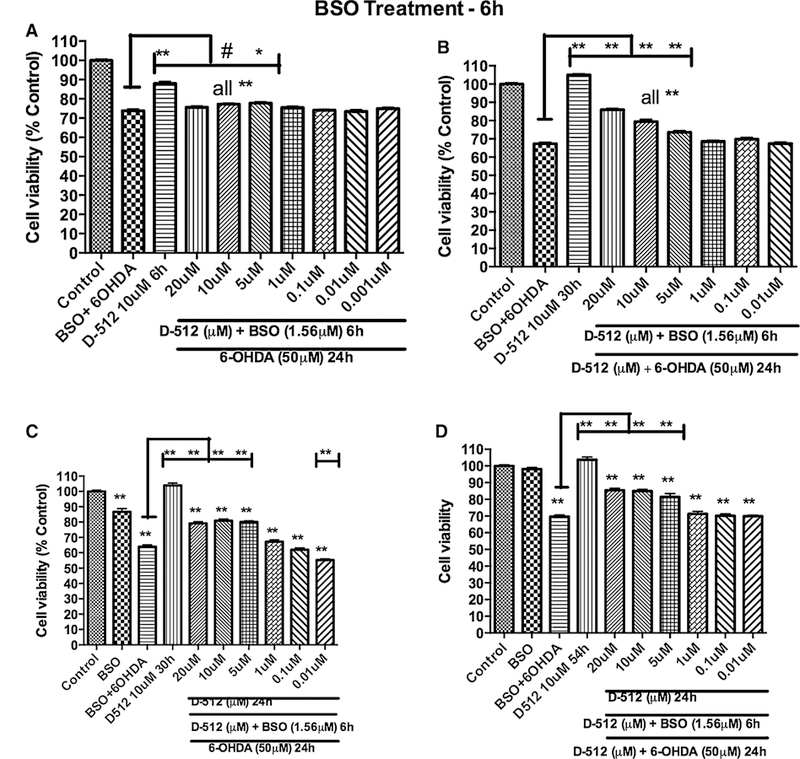
Effect of D-512 on the combination treatment of 1.56 μMBSO for 6 h followed by 50 μM 6-OHDA for 24 h in restoring cell viability of PC12 cells. PC12 cells were co-treated with different concentrations of D-512 along with 1.56 μM BSO for 6 h followed by treatment with 50 μM 6-OHDA alone for 24 h (a) or co-treatment with D-512 and 50 μM 6-OHDA for 24 h (b). PC12 cells were pretreated with different concentrations of D-512 for 24 h followed by co-treatment with 1.56 μM BSO for 6 h and final treatment with50 μM 6-OHDA alone for 24 h (c) or co-treatment with D-512 and50 μM 6-OHDA for 24 h (d). The values shown are the mean ± SD of at least three independent experiments performed with 6–8replicates. One-way ANOVA analysis followed by Tukey’s multiple comparison post hoc test was performed (**p\0.001, compared to control and **p\0.001, #p\0.05 compared to BSO + 6-OHDA group
Fig. 11.
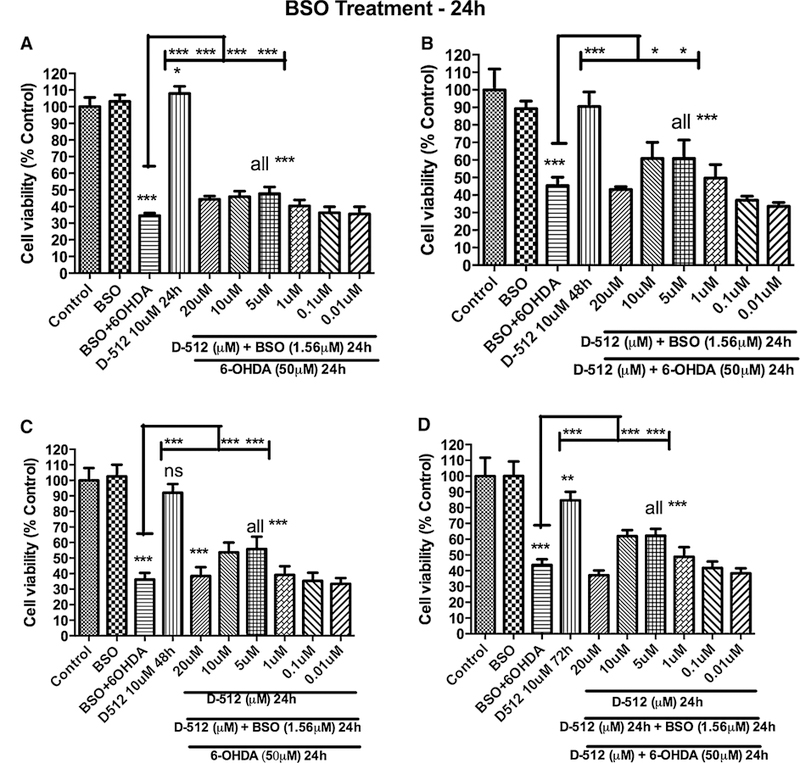
Effect of D-512 on the combination treatment of 1.56 μM BSO for 24 h followed by 50 μM 6-OHDA for 24 h in restoring cell viability of PC12 cells. PC12 cells were co-treated with different concentrations of D-512 along with 1.56 μM BSO for 24 h followed by treatment with 50 μM 6-OHDA alone for 24 h (a) or co-treatment with D-512 and 50 μM 6-OHDA for 24 h (b). PC12 cells were pretreated with different concentrations of D-512 for 24 h followed by co-treatment with 1.56 μM BSO for 24 h and final treatment with 50 μM 6-OHDA alone for 24 h (c) or co-treatment with D-512 and 50 μM 6-OHDA for 24 h (d). The values shown are the mean ± SD of at least three independent experiments performed with 6–8 replicates. One-way ANOVA analysis followed by Tukey’s multiple comparison post hoc test was performed (***p \ 0.0001, **p \ 0.001, *p \ 0.01, compared to control and ***p \ 0.0001, *p \ 0.01 compared to BSO + 6-OHDA group)
Discussion
Oxidative stress plays a central role in the PD pathogenesis. Identifying the origins of oxidative stress and understanding the molecular pathways involved in this process should be helpful to develop therapeutic agents to counteract it. Addressing the issue of oxidative stress-induced neuronal cell damage is important in developing various neuroprotective therapeutic strategies. Oxidative stress causes imbalance in the anti-oxidant systems of the neuronal cells and work toward replenishing the anti-oxidants levels or restoring the mechanism of anti-oxidant systems should be an effective approach in neuroprotection strategy. Glutathione, an abundant anti-oxidant present in the brain is highly susceptible to modulation due to increased oxidative stress. In this regard, PC12 cells under glutathione depletion state along with induction of cytotoxicity produced by 6-OHDA would be an ideal in vitro model to study mechanism of neuroprotection of a test drug. In our continued efforts to develop the symptomatic and disease-modifying/neuroprotective agents with multifunctional properties for the treatment of PD, we have demonstrated the neuroprotective properties of D-512 and D-440 in MN9D cells against 6-OHDA and MPP+ toxicity (Santra et al. 2013) and neuroprotective properties of D-512 in PC12 cells against 6-OHDA toxicity as well as protecting dopaminergic neurons from MPTP toxicity in mice (Shahet al. 2014). Previously, we have shown the potent anti-oxidant effect of D-512 in a cell-free model using 2, 2-diphenyl-1-picrylhydrazyl (DPPH) radical quenching assay. In this assay, D-512 showed a twofold anti-oxidant activity compared to ascorbic acid (Johnson et al. 2012). In order to further evaluate the anti-oxidant-based protective role of D-512, PC12 cells treated with BSO alone or in combination with 6-OHDA were used as oxidative stress-induced cell models mimicking PD pathogenesis process closely. The PC12 cells are derived from a transplantable rat adrenal medulla pheochromocytoma. Like dopaminergic neurons, PC12 cells also express tyrosine hydroxylase, synthesize, and store catecholamines, dopamine, and nucleotide pyrophosphatase (NPP). Therefore, this cell line is widely used as in vitro model for various neurobiological and neurochemical studies of PD (Shafer and Atchison 1991; Westerink and Ewing 2008).
Replenishment of Glutathione with Treatment of D-512
Since glutathione is the major defense mechanism against mitochondrial complex I inhibition under oxidative stress in the DA neurons, we have examined the effect of D-512 in restoring the glutathione metabolism. Initially, BSO treatment alone was done at 6- and 24-h time intervals and results showed a dose-dependent depletion of cytosolic GSH pool in PC12 cells (Fig. 2a, b). Treatment of D-512 alone showed a significant increase in the glutathione at 6 and 24 h (Fig. 2c, d) indicating the possible role of D-512 in triggering/enhancing the glutathione synthesis in PC12 cells. Further, results from pretreatment of D-512 followed by BSO treatment at 6 and 24 h show that D-512 was able to significantly restore the glutathione in PC12 cells (Fig. 2e, f). Thus, pretreatment of D-512 seems to have an effect in preventing loss of glutathione levels upon BSO treatment. Depletion of glutathione occurs slowly as is evident from the graphs and accordingly restoration is effective with the D-512 treatment (Fig. 2e, f). Restoration of total glutathione levels by D-512 in BSO-mediated glutathione-depleted PC12 cells prompted us to estimate the total and free glutathione levels in PC12 cells under oxidative stress conditions produced by the treatment with 6-OHDA. We have shown dose-dependent effect of 6-OHDA on the level of total glutathione at 6 and 24 h (Fig. 3). Contrary to gradual dose-dependent depletion of total GSH at 6 h, a biphasic curve was observed at 24-h treatment time point with 6-OHDA. Currently, the reason for such profile is not completely clear; however, such biphasic alteration was observed by other investigators (Takata et al. 2005). Although there is no clear explanation for this biphasic behavior, it is assumed that the toxic effect of 6-OHDA on PC12 cells is less at 6 h which produces oxidative stress leading to gradual depletion of glutathione. However, PC12 cells at 24 h experience higher oxidative stress effect of 6-OHDA due to longer incubation time which might induce apoptosis in the cells. In order to protect from oxidative stress-induced apoptosis, cells might upregulate endogenous GSH synthesis. This increment is observed up to 50 μM possibly due to the majority of the cells undergoing apoptosis trigger rapid GSH production. While treatment with 6-OHDA at 75 and 100 μM for 24 h most likely produce severe injury to cells leading to more cell death and hence decrease in the glutathione levels (Shimizu et al. 2002; Takata et al. 2005). Next we investigated the effect of pretreatment followed by co-treatment of D-512 with 6-OHDA in restoring the free glutathione. Pretreatment with D-512 followed by co-treatment with 6-OHDA for 6 h had significantly improved the level of free glutathione at 10 μM of D-512, thus conferring protection (Fig. 4a). Interestingly, we observe a contrasting result in the free and total glutathione levels when PC12 cells were treated for 24 h with 6-OHDA. There is a 2.5-fold increase in the free glutathione level with the treatment of 6-OHDA (25 μM) alone. Further increment of the free glutathione levels was observed in D-512 pretreatment at 10 and 5 μM followed by co-treatment with 6-OHDA (Fig. 5a, b). Although such contrasting trend seems complicated, these variations in free glutathione levels at 6 and h can be explained with respect to action of 6-OHDA on PC12 cells. Effect of 6-OHDA at 6-h time point on PC12 cells results from production of ROS generated from 6-OHDA which slowly induces oxidative stress. Under these conditions, the free glutathione will be consumed to a large extent to maintain the redox equilibrium which in turn results in depletion of free glutathione levels. Presence of D-512 in such oxidative stress conditions (due to short exposure time of 6-OHDA) might act quickly to restore the equilibrium possibly by modulating the MAP kinases or some other mechanisms. However, a different mechanism might come into play when PC12 cells are exposed to 6-OHDA for 24 h. Due to longer exposure time of 6-OHDA, PC12 cells will undergo higher oxidative stress, which in turn might trigger the cellular machinery to get activated as a compensatory effect for the synthesis of free glutathione. There are reports on PC12 cells treated with 6-OHDA for short and long treatment periods which showed variable expression levels of glutathione (Takata et al. 2005). In fact, pretreatment with D-512 at 5 and 10 μM followed by treatment with 6-OHDA for 24 h showed significantly elevated levels of free glutathione as compared to 6-OHDA alone. This enhancement in the free glutathione levels can possibly be attributed to the added effect of D-512 which can induce glutathione synthesis (as evident from Fig. 2c, d) and self-repair mechanism of the PC12 cells under severe oxidative stress.
Glutamylcysteine Synthetase (γ-GCLC) Modulation
γ-GCLC is a rate-limiting enzyme in glutathione synthesis. In order to confirm whether 6-OHDA treatment in PC12 cells at 6 and 24 h shows the similar trend of glutathione expression, we planned to evaluate the modulation of this enzyme by Western analysis. PC12 cells treated with 50 μM 6-OHDA for 6 h showed decrease, while at 24 h showed elevated levels of γ-GCLC (Fig. 6a). The results are consistent with our glutathione estimation data (Fig. 3a, b). Further, we have also evaluated the effect of D-512 in modulating γ-GCLC in presence of BSO (Fig. 6b). There was no increase in the levels of γ-GCLC in D-512 + BSO treatment group and D-512 alone treatment; however, BSO alone showed an increment in the expression levels of γ-GCLC, although, the increase of γ-GCLC activity was not significant compared to control. Similar increment from BSO alone treatment was reported earlier (Li et al. 2013). It seems that BSO enhances the gene expression of γ-GCLC under glutathione-depleted conditions. Our results support this notion.
6-OHDA Induces Apoptosis via Caspase Inhibition
6-OHDA is a well-known neurotoxin and causes apoptosis in PC12 cells (Blum et al. 2000; Ochu et al. 1998; Seth et al. 2002). In this regard, we wanted to explore the apoptotic path of 6-OHDA toxicity in PC12 cells. For this purpose, PC12 cells were treated with 6-OHDA at different concentrations in presence/absence of caspase inhibitor, Z-VAD-FMK at 100 μM concentration. We found that apoptosis of PC12 cells was inhibited significantly when the cells were treated with 25 and 50 μM of 6-OHDA in presence of caspase inhibitor compared to 6-OHDA treatment alone (Fig. 8). However, at higher concentrations of 75, 100 μM 6-OHDA showed minimal apoptosis inhibition in presence of Z-VAD-FMK. These results suggest that 6-OHDA induces apoptosis via caspase inhibition at least partially (Fig. 8).
Possible Mechanism of Action of D-512 via Modulation of MAP Kinases
The rationale behind performing analysis of cellular signaling molecules such as ERK and JNK was based on the fact that fate of cell is determined by balances between various signaling molecules. Imbalances in various signaling cascades of cells following exposure to variety of stimuli or toxin can influence cellular decisions such as cell survival, proliferation, differentiation, migration, and cell death (Fulda et al. 2010; Morrison et al. 2002). MAP kinases activation requires phosphorylation of analogous residues in the phosphorylation lip of the proteins. Binding of a wide variety of extracellular signaling molecules triggers highly conserved kinase cascades culminating in activation of a particular MAP kinase. Sustained activation of MAP kinase signaling molecule, extracellular signal-regulated kinases (ERK1/2), has been shown in PC12 following exposure to toxic doses of 6-OHDA. Sustained ERK1/2 activation has been shown to be a key event responsible for cell death in PC12 cells (Park et al. 2013; Zhang et al. 2012). In addition, another type of MAP kinase signaling molecule, γ-JNKs respond to various stress-related stimuli, such as cytokines, inflammatory signals, and increase in oxidative stress. JNK has also been shown to be activated following exposure of PC12 cells to 6-OHDA (Mnich et al. 2010). As these key signaling molecules are the early determinants of cellular fate, probing their modulation by D-512 in presence of toxin 6-OHDA would help to understand the mechanism of D-512 at a molecular level. Therefore, we evaluated the ability of D-512 to alter the changes in ERK1/2 and JNK following exposure of PC-12 cells to 6-OHDA in a time-dependent manner. Results show that pretreatment with D-512 was able to produce significant reduction of activation of ERK (pERK) induced by treatment with 6-OHDA (Fig. 7a). However, in case of JNK, such activation induced by 6-OHDA was also reduced by pretreatment with D-512 but the effect was not significant (Fig. 7b). These results provide evidence, at least partially, of mechanisms by which D-512 is able to protect the cells against 6-OHDA toxicity. Thus, it is possible that D-512 might be acting on MAP kinase signaling pathway by preventing clearly the upregulation of phospho-ERK induced by the toxin. However, such involvement is not clearly established with phospho-JNK activation pathway. Evaluation of phospho-ERK and phospho-JNK at early time points can be attributed to the action of D-512 on early events of signaling pathways which might prevent the downstream signaling cascade leading to cell death at a later time point.
D-512 Protects Glutathione-Depleted PC12 Cells Against Combined 6-OHDA- and BSO-Induced Toxicity
Decreased glutathione levels are one of the early indications of nigral cell death in PD patients (Sian et al. 1994a; Sofic et al. 1992). Glutathione depletion in the brain potentiates the toxicity of 6-OHDA (Garcia et al. 2000; Seaton et al. 1996). In order to investigate the ability of D-512 against such severe oxidative insult, we have utilized PC12 cells to develop an oxidative stress-induced cell model mimicking PD pathogenesis. Previously, we have demonstrated the neuroprotective effects of D-512 in res-cuing PC12 cells against 6-OHDA toxicity (Shah et al. 2014). In our current study, we have examined the neuro-protective activity of D-512 against toxicity induced by combination treatment of BSO and 6-OHDA. Initially, PC12 cells were treated with BSO to modulate glutathione level followed by treatment with 6-OHDA to potentiate the effect of ROS-induced toxicity (Fig. 9). Results show that D-512 confers moderate to significant protection at 20, 10, and 5 μM concentrations with different treatment protocols at 6 and 24 h (Figs. 10, 11). D-512 shows highest neuro-protection at 5 and 10 μM when pretreated for 24 h and co-treated with BSO followed by fresh co-treatment with 6-OHDA for 24 h (Fig. 11d). We see a dose-dependent protection with co-treatment of BSO and D-512 for 6 h and fresh co-treatment of D-512 with 6-OHDA for 24 h (Fig. 10b). PC12 cells pretreated with D-512 for 24 h fol-lowed by co-treatment with BSO for 6 h followed by final treatment with 6-OHDA alone or fresh co-treatment with D-512 show significant protection (Fig. 10c, d). We do not see any neuroprotection with co-treatment of D-512 with BSO for 6-h time interval alone (Fig. 10a). This might be due to the fact that D-512 treatment time in this method is for a short period i.e., 6 h. We did not see toxicity arising from D-512 treatment alone in 6-h time interval (Fig. 10a–d) but we observed toxicity for the same at 24-h time intervals (Fig. 11c, d), except for the first set of treatment method (Fig. 11a). All the 24-h treatment methods have D-512 alone treatment for 48 h (Fig. 11b, c) and 72 h (Fig. 11d), except for first treatment method, in which PC12 cells are treated with D-512 for 24 h only. Hence, the toxicity arising from D-512 alone treatment might be due to the prolonged treatment time, as the same D-512 treatment alone is not toxic for PC12 cells at 6-h time intervals due to short treatment intervals (Fig. 10a–d). Overall, our results indicate significant effect of treatment of D-512 in reversing cell survival in presence of BSO and 6-OHDA (Figs. 9 vs. 10, 11). This result correlates well with the effect of D-512 in restoring the level of glutathione in PC12 cells treated with either BSO or 6-OHDA alone.
Conclusions
We have shown the potent anti-oxidant property of our lead dopamine agonist, D-512 in PC12 cells against 6-OHDA-induced oxidative damage and BSO-induced glutathione depletion. In both cases, D-512 was able to restore the glutathione levels and protect the cells from oxidative damage. We have also demonstrated the potent neuroprotective property of D-512 in attenuating the oxidative stress-induced toxicity resulting in loss of cell survival caused by combined treatment of 6-OHDA and BSO in PC12 cells. Modulation of MAP kinases levels, phospho-ERK in particular, by D-512 may partially explain the mechanism of protection with which D-512 is able to rescue the cells from oxidative insult. Taken together, we have demonstrated the anti-oxidant-based neuroprotective role of D-512 in PC12 cells against oxidative damage. With the restoration of glutathione in PC12 cells against BSO and 6-OHDA treatments and neuroprotective effect by rescuing cell death in PC12 cells under severe oxidative insult makes D-512 an effective/potential multifunctional symptomatic and disease-modifying drug candidate for the treatment of PD. In future, further studies might be needed with more closely neuron-mimicking cells such as differ-entiated PC12 cells to comprehensively evaluate the potential of a neuroprotective drug like D-512 in the treatment of PD as well as to further elucidate com-plex pathways involved in the mechanisms of their neuroprotection.
Acknowledgments
This work is supported by National Institute of Neurological Disorders and Stroke/National Institute of Health (NS047198, AKD).
Footnotes
Compliance with Ethical Standards
Conflict of interest The authors declare no competing financial interests.
References
- Alam ZI, Daniel SE, Lees AJ, Marsden DC, Jenner P, Halliwell B (1997a) A generalised increase in protein carbonyls in the brain in Parkinson’s but not incidental Lewy body disease. J Neu-rochem 69:1326–1329 [DOI] [PubMed] [Google Scholar]
- Alam ZI et al. (1997b) Oxidative DNA damage in the parkinsonian brain: an apparent selective increase in 8-hydroxyguanine levels in substantia nigra. J Neurochem 69:1196–1203 [DOI] [PubMed] [Google Scholar]
- Bergman H, Deuschl G (2002) Pathophysiology of Parkinson’s disease: from clinical neurology to basic neuroscience and back. Mov Disord 17(Suppl 3):S28–S40 official journal of the Movement Disorder Society [DOI] [PubMed] [Google Scholar]
- Blum D, Torch S, Nissou MF, Benabid AL, Verna JM (2000) Extracellular toxicity of 6-hydroxydopamine on PC12 cells. Neurosci Lett 283:193–196 [DOI] [PubMed] [Google Scholar]
- Choi WS, Yoon SY, Oh TH, Choi EJ, O’Malley KL, Oh YJ (1999) Two distinct mechanisms are involved in 6-hydroxydopamine-and MPP+-induced dopaminergic neuronal cell death: role of caspases, ROS, and JNK. J Neurosci Res 57:86–94 [DOI] [PubMed] [Google Scholar]
- Davila D, Torres-Aleman I (2008) Neuronal death by oxidative stress involves activation of FOXO3 through a two-arm pathway that activates stress kinases and attenuates insulin-like growth factor I signaling. Mol Biol Cell 19:2014–2025. doi: 10.1091/mbc.E07-08-0811 [DOI] [PMC free article] [PubMed] [Google Scholar]
- de Pablos RM, Herrera AJ, Espinosa-Oliva AM, Sarmiento M, Munoz MF, Machado A, Venero JL (2014) Chronic stress enhances microglia activation and exacerbates death of nigral dopamin-ergic neurons under conditions of inflammation. J Neuroinflam-mation 11:34. doi: 10.1186/1742-2094-11-34 [DOI] [PMC free article] [PubMed] [Google Scholar]
- Degterev A, Boyce M, Yuan J (2003) A decade of caspases. Oncogene 22:8543–8567. doi: 10.1038/sj.onc.1207107 [DOI] [PubMed] [Google Scholar]
- Fulda S, Gorman AM, Hori O, Samali A (2010) Cellular stress responses: cell survival and cell death. Int J Cell Biol 2010:214074. doi: 10.1155/2010/214074 [DOI] [PMC free article] [PubMed] [Google Scholar]
- Garcia JC, Remires D, Leiva A, Gonzalez R (2000) Depletion of brain glutathione potentiates the effect of 6-hydroxydopamine in a rat model of Parkinson’s disease. J Mol Neurosci 14:147–153. doi: 10.1385/JMN:14:3:147 [DOI] [PubMed] [Google Scholar]
- Gille G, Reichmann H (2011) Iron-dependent functions of mitochon-dria–relation to neurodegeneration. J Neural Transm 118: 349–359. doi: 10.1007/s00702-010-0503-7 [DOI] [PubMed] [Google Scholar]
- Griffith OW (1982) Mechanism of action, metabolism, and toxicity of buthionine sulfoximine and its higher homologs, potent inhibi-tors of glutathione synthesis. J Biol Chem 257:13704–13712 [PubMed] [Google Scholar]
- Hwang O (2013) Role of oxidative stress in Parkinson’s disease. Exp Neurobiol 22:11–17. doi: 10.5607/en.2013.22.1.11 [DOI] [PMC free article] [PubMed] [Google Scholar]
- Jenner P (2003) Oxidative stress in Parkinson’s disease. Ann Neurol 53(Suppl 3):S26–S36 [DOI] [PubMed] [Google Scholar]
- Jenner P, Dexter DT, Sian J, Schapira AH, Marsden CD, The Royal Kings and Queens Parkinson’s Disease Research Group (1992) Oxidative stress as a cause of nigral cell death in Parkinson’s disease and incidental Lewy body disease. Ann Neurol 32(Suppl):S82–S87 [DOI] [PubMed] [Google Scholar]
- Jenner P, Olanow CW (1996) Oxidative stress and the pathogenesis of Parkinson’s disease. Neurology 47:S161–S170 [DOI] [PubMed] [Google Scholar]
- Johnson M, Antonio T, Reith ME, Dutta AK (2012) Structure-activity relationship study of N(6)-(2-(4-(1H-Indol-5-yl)piperazin-1-yl)ethyl)-N(6)-propyl-4,5,6,7-tetrahydroben zo[d]thiazole-2,6-diamine analogues: development of highly selective D3 dopamine receptor agonists along with a highly potent D2/D3 agonist and their pharmacological characterization. J Med Chem 55:5826–5840. doi: 10.1021/jm300268s [DOI] [PMC free article] [PubMed] [Google Scholar]
- Jomova K, Vondrakova D, Lawson M, Valko M (2010) Metals, oxidative stress and neurodegenerative disorders. Mol Cell Biochem 345:91–104. doi: 10.1007/s11010-010-0563-x [DOI] [PubMed] [Google Scholar]
- Keshet Y, Seger R (2010) The MAP kinase signaling cascades: a system of hundreds of components regulates a diverse array of physiological functions. Methods Mol Biol 661:3–38. doi: 10.1007/978-1-60761-795-2_1 [DOI] [PubMed] [Google Scholar]
- Klein JA, Ackerman SL (2003) Oxidative stress, cell cycle, and neurodegeneration. J Clin Investig 111:785–793. doi: 10.1172/JCI18182 [DOI] [PMC free article] [PubMed] [Google Scholar]
- Li H, Wu S, Chen J, Wang B, Shi N (2013) Effect of glutathione depletion on Nrf2/ARE activation by deltamethrin in PC12 Cells. Arhiv za higijenu rada i toksikologiju 64:87–97. doi: 10.2478/10004-1254-64-2013-2251 [DOI] [PubMed] [Google Scholar]
- Linert W, Jameson GN (2000) Redox reactions of neurotransmitters possibly involved in the progression of Parkinson’s disease. J Inorg Biochem 79:319–326 [DOI] [PubMed] [Google Scholar]
- Martin HL, Teismann P (2009) Glutathione–a review on its role and significance in Parkinson’s disease. FASEB J 23:3263–3272. doi: 10.1096/fj.08-125443 official publication of the Federation of American Societies for Experimental Biology [DOI] [PubMed] [Google Scholar]
- McCubrey JA, Lahair MM, Franklin RA (2006) Reactive oxygen species-induced activation of the MAP kinase signaling path-ways. Antioxid Redox Signal 8:1775–1789. doi: 10.1089/ars.2006.8.1775 [DOI] [PubMed] [Google Scholar]
- Mnich K, Finn DP, Dowd E, Gorman AM (2010) Inhibition by anandamide of 6-hydroxydopamine-induced cell death in PC12 cells. Int J Cell Biol 2010:818497. doi: 10.1155/2010/818497 [DOI] [PMC free article] [PubMed] [Google Scholar]
- Morrison RS, Kinoshita Y, Johnson MD, Ghatan S, Ho JT, Garden G (2002) Neuronal survival and cell death signaling pathways. Adv Exp Med Biol 513:41–86 [DOI] [PubMed] [Google Scholar]
- Ochu EE, Rothwell NJ, Waters CM (1998) Caspases mediate 6-hydroxydopamine-induced apoptosis but not necrosis in PC12 cells. J Neurochem 70:2637–2640 [DOI] [PubMed] [Google Scholar]
- Park HJ, Park KH, Shin KS, Lee MK (2013) The roles of cyclic AMP-ERK-Bad signaling pathways on 6-hydroxydopamine-induced cell survival and death in PC12 cells. Toxicol In Vitro 27:2233–2241. doi: 10.1016/j.tiv.2013.09.014 an international journal published in association with BIBRA [DOI] [PubMed] [Google Scholar]
- Perry TL, Godin DV, Hansen S (1982) Parkinson’s disease: a disorder due to nigral glutathione deficiency? Neurosci Lett 33:305–310 [DOI] [PubMed] [Google Scholar]
- Reiter RJ (1995) Oxidative processes and antioxidative defense mechanisms in the aging brain. FASEB J 9:526–533 official publication of the Federation of American Societies for Experimental Biology [PubMed] [Google Scholar]
- Santra S, Xu L, Shah M, Johnson M, Dutta A (2013) D-512 and D-440 as novel multifunctional dopamine agonists: characterization of neuroprotection properties and evaluation of in vivo efficacy in a Parkinson’s disease animal model. ACS Chem Neurosci doi: 10.1021/cn400106n [DOI] [PMC free article] [PubMed] [Google Scholar]
- Seaton TA, Jenner P, Marsden CD (1996) Thioctic acid does not restore glutathione levels or protect against the potentiation of 6-hydroxydopamine toxicity induced by glutathione depletion in rat brain. J Neural Transm 103:315–329 [DOI] [PubMed] [Google Scholar]
- Selley ML (1998) (E)-4-hydroxy-2-nonenal may be involved in the pathogenesis of Parkinson’s disease. Free Radic Biol Med 25:169–174 [DOI] [PubMed] [Google Scholar]
- Seth K, Agrawal AK, Aziz MH, Ahmad A, Shukla Y, Mathur N, Seth PK (2002) Induced expression of early response genes/oxidative injury in rat pheochromocytoma (PC12) cell line by 6-hydrox-ydopamine: implication for Parkinson’s disease. Neurosci Lett 330:89–93 [DOI] [PubMed] [Google Scholar]
- Shafer TJ, Atchison WD (1991) Transmitter, ion channel and receptor properties of pheochromocytoma (PC12) cells: a model for neurotoxicological studies. Neurotoxicology 12:473–492 [PubMed] [Google Scholar]
- Shah M et al. (2014) The high-affinity D2/D3 agonist D512 protects PC12 cells from 6-OHDA-induced apoptotic cell death and rescues dopaminergic neurons in the MPTP mouse model of Parkinson’s disease. J Neurochem 131:74–85. doi: 10.1111/jnc.12767 [DOI] [PMC free article] [PubMed] [Google Scholar]
- Shen XM, Dryhurst G (1996) Further insights into the influence of L-cysteine on the oxidation chemistry of dopamine: reaction pathways of potential relevance to Parkinson’s disease. Chem Res Toxicol 9:751–763. doi: 10.1021/tx960008f [DOI] [PubMed] [Google Scholar]
- Shimizu E, Hashimoto K, Komatsu N, Iyo M (2002) Roles of endogenous glutathione levels on 6-hydroxydopamine-induced apoptotic neuronal cell death in human neuroblastoma SK-N-SH cells. Neuropharmacology 43:434–443 [DOI] [PubMed] [Google Scholar]
- Sian J et al. (1994a) Alterations in glutathione levels in Parkinson’s disease and other neurodegenerative disorders affecting basal ganglia. Ann Neurol 36:348–355. doi: 10.1002/ana.410360305 [DOI] [PubMed] [Google Scholar]
- Sian J, Dexter DT, Lees AJ, Daniel S, Jenner P, Marsden CD (1994b) Glutathione-related enzymes in brain in Parkinson’s disease. Ann Neurol 36:356–361. doi: 10.1002/ana.410360306 [DOI] [PubMed] [Google Scholar]
- Sofic E, Lange KW, Jellinger K, Riederer P (1992) Reduced and oxidized glutathione in the substantia nigra of patients with Parkinson’s disease. Neurosci Lett 142:128–130 [DOI] [PubMed] [Google Scholar]
- Spencer JP, Jenner P, Daniel SE, Lees AJ, Marsden DC, Halliwell B (1998) Conjugates of catecholamines with cysteine and GSH in Parkinson’s disease: possible mechanisms of formation involv-ing reactive oxygen species. J Neurochem 71:2112–2122 [DOI] [PubMed] [Google Scholar]
- Takata MK et al. (2005) Neuroprotective effect of D-psicose on 6-hydroxydopamine-induced apoptosis in rat pheochromocy-toma (PC12) cells. J Biosci Bioeng 100:511–516. doi: 10.1263/jbb.100.511 [DOI] [PubMed] [Google Scholar]
- Westerink RH, Ewing AG (2008) The PC12 cell as model for neurosecretion. Acta Physiol 192:273–285. doi: 10.1111/j.1748-1716.2007.01805.x [DOI] [PMC free article] [PubMed] [Google Scholar]
- Zecca L, Youdim MB, Riederer P, Connor JR, Crichton RR (2004) Iron, brain ageing and neurodegenerative disorders. Nat Rev Neurosci 5:863–873. doi: 10.1038/nrn1537 [DOI] [PubMed] [Google Scholar]
- Zhang LJ et al. (2012) Human albumin prevents 6-hydroxydopamine-induced loss of tyrosine hydroxylase in in vitro and in vivo. PLoS One 7:e41226. doi: 10.1371/journal.pone.0041226 [DOI] [PMC free article] [PubMed] [Google Scholar]
- Zhang W, Liu HT (2002) MAPK signal pathways in the regulation of cell proliferation in mammalian cells. Cell Res 12:9–18. doi: 10.1038/sj.cr.7290105 [DOI] [PubMed] [Google Scholar]
- Zhou C, Huang Y, Przedborski S (2008) Oxidative stress in Parkinson’s disease: a mechanism of pathogenic and therapeutic significance. Ann N Y Acad Sci 1147:93–104. doi: 10.1196/annals.1427.023 [DOI] [PMC free article] [PubMed] [Google Scholar]


