

Abstract
IMPORTANCE
The distance patients can travel outside the home influences how much of the world they can sample and to what extent they can live independently. Recent technological advances have allowed travel outside the home to be directly measured in patients’ real-world routines.
OBJECTIVE
To determine whether decreased visual acuity (VA) from age-related macular degeneration (AMD) and visual field (VF) loss from glaucoma are associated with restricted travel patterns in older adults.
DESIGN
Cross-sectional study.
SETTING
Patients were recruited from an eye clinic, while travel patterns were recorded during their real-world routines using a cellular tracking device.
PARTICIPANTS
Sixty-one control subjects with normal vision, 84 subjects with glaucoma with bilateral VF loss, and 65 subjects with AMD with bilateral or severe unilateral loss of VA had their location tracked every 15 minutes between 7 am and 11 pm for 7 days using a tracking device.
MAIN OUTCOMES AND MEASURES
Average daily excursion size (defined as maximum distance away from home) and average daily excursion span (defined as maximum span of travel) were defined for each individual. The effects of vision loss on travel patterns were evaluated after controlling for individual and geographic factors.
RESULTS
In multivariable models comparing subjects with AMD and control subjects, average excursion size and span decreased by approximately one-quarter mile for each line of better-eye VA loss (P≤ .03 for both). Similar but not statistically significant associations were observed between average daily excursion size and span for severity of better-eye VF loss in subjects with glaucoma and control subjects. Being married or living with someone and younger age were associated with more distant travel, while less-distant travel was noted for older individuals, African Americans, and those living in more densely populated regions.
CONCLUSIONS AND RELEVANCE
Age-related macular degeneration-related loss of VA, but not glaucoma-related loss of VF, is associated with restriction of travel to more nearby locations. This constriction of life space may impact quality of life and restrict access to services.
Visual impairment causes significant morbidity in the United States, both as a result of inability to perform important daily tasks and through indirect effects on individuals’ physical and mental health.1 Approximately 1 in 28 US adults older than 40 years of age is visually impaired,2 a number expected to grow as the US population ages. Among those older than the age of 50 years, the prevalence of visual impairment increases exponentially.3 The number of Americans who are blind or who have visual impairment is expected to double to 5 million by 2020,4 making rehabilitation of the visually impaired a public health priority.2 Two major causes of visual impairment include age-related macular degeneration (AMD) and glaucoma, each of which is present in up to 10% of older individuals.5,6 Age-related macular degeneration is the leading cause of irreversible visual impairment in the United States, and it is projected that it will afflict almost 3 million by 2020.4 Glaucoma is another leading cause of visual impairment in the United States, producing gradual and progressive visual field (VF) loss.
Visual impairment has been shown to affect several aspects of mobility, producing worse balance, more falls, greater fear of falling, decreased physical activity, slower/more hazardous movement through the environment, and more frequent driving cessation.7–16 An unstudied aspect of mobility impairment is whether people restrict their travel to places near their home, leading to a more isolated life and a greater inability to access necessary services.
Restriction of travel to nearby locations has previously been assessed through life-space questionnaires and assessments,17-19 but life-space questionnaires are often subjective in terms of the information they provide. The advent of tracking technology allows for objective determination of life space by providing direct measures of where individuals travel when leaving the home. Here, we objectively characterized travel away from home using 2 distance-based metrics in subjects with normal vision, VF loss from glaucoma, and decreased visual acuity (VA) from AMD to determine whether these individuals restricted their travel to more nearby locations.
Methods
This research was approved by the Johns Hopkins Medical Institutions’ institutional review board. Written informed consent was obtained for all participants.
Study Participants
A total of 210 participants were recruited from a convenience sample of individuals under care at the Johns Hopkins Wilmer Eye Institute in Baltimore, Maryland. Three study groups were recruited: glaucoma suspects with normal vision (control subjects; n = 61), glaucoma with bilateral VF loss (n = 84), and AMD with bilateral or severe unilateral VA loss (n = 65). Detailed descriptions of inclusion criteria for each group are described elsewhere.10,20,21 Briefly, glaucoma suspect control subjects were required to have a medical record diagnosis of glaucoma suspect and minimal VF loss (better-eye mean deviation [MD] better than −3 dB). Subjects with glaucoma were required to have a medical record diagnosis of glaucoma and abnormal right and left eye VFs with MDs worse than −3 dB. Subjects with AMD were required to have evidence of neovascular or nonneovascular AMD with VA of 20/32 or worse in both eyes or 20/200 or worse in one eye with any acuity in the second eye.
Eligible participants were between the ages of 60 and 80 years and had no history of ocular laser treatment in the previous week, nonocular surgery or hospitalization in the past 2 weeks, or eye surgery in the past 2 months. Study participants were predominantly from the Maryland; Washington, DC; and Virginia area (85%), and the rest from the Northeast Coast (10%), with 1 participant each in Kentucky, Florida, and Texas.
Tracking Device
Travel habits were assessed during 7 days of normal activity using a cellular tracking device (pTrac Pro, Brickhouse Securities) that measured individuals’ location every 15 minutes between 7 am and 11 pm. Subjects were instructed to clip the tracking device to their waistband during these hours, and the device was set to record the unit’s location according to latitude and longitude at each point. Each provided location was defined as being home or away from home as previously described, and with excursions outside the home defined as sequential space-time locations away from the home region (P.Y.R., E. Maul, MD, E. Chan, MS, L.F., D.S.F.; unpublished data; January 2013). Details regarding the function and validity of the tracking device and how location data were used to calculate home locations and excursions away from home were described in detail elsewhere.22
Outcome Measures and Supporting Variables
Two distance-based metrics were used as primary outcomes to describe daily travel patterns for each study participant: average maximum distance away from home and average maximum excursion span. To calculate average maximum distance away from home, hereafter referred to as average excursion size, the maximum distance from the home point was calculated for each given excursion away from home. When multiple excursions were taken during the course of a day, these excursion-specific maximum distances were averaged to yield a daily measure. To calculate average excursion span, the maximum distance between all recorded locations away from home during a given excursion was calculated and then averaged over all excursions for a given day to yield a daily measure. Average excursion span measured how clustered travels away from home were, independent of how far away from home one traveled, with smaller values indicating more compact traveling. Figure 1 provides a schematic view describing excursion size and excursion span metrics for 3 example excursions. As is evident, one may travel a lot but stay relatively close to home or one may travel far from home but keep their traveling (once away) restricted or more compact. Considering both excursion size and excursion span allowed analysis to inform both scenarios.
Figure 1. Schematic of Distance-Based Metrics.
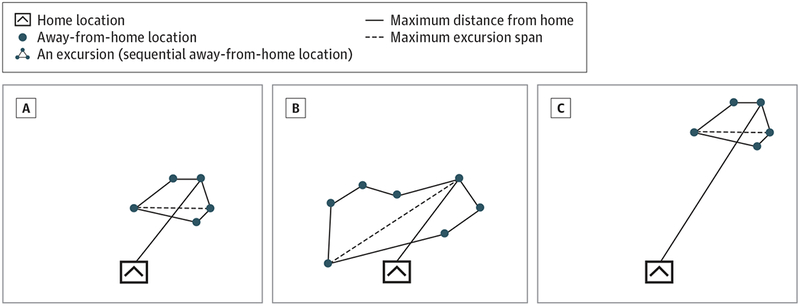
Schematic demonstrating the 2 distance-based metrics used for describing travel patterns: excursion size (maximum distance away from home) and excursion span. Three different excursion examples are shown: compact travel close to home (A), larger travel span close to home (B), and compact travel far from home (C). Comparing excursions A vs B, both excursions have the same excursion size; however, once away from home, excursion A is more compact (smaller excursion span) than excursion B. In A vs C, excursion C is further away from home; however, once away from home, both have the same excursion span. In B vs C, excursion C is further away from home than excursion B but also more compact so both excursions may have close to the same overall travel distance.
Analyses focused on the relationship between travel parameters and continuous measures of vision, namely better-eye VA (for subjects with AMD and control participants) and better-eye VF MD (for subjects with glaucoma and control participants). Better-eye values were chosen based on previous work suggesting that they are more relevant to disability than worse-eye values.23,24 Binocular VA and VFs were not measured, although previous work suggests that better-eye acuity captures disability to a similar degree25 and that better-eye VFs infrequently differ from integrated VFs designed to simulate binocular VF loss.26 Visual acuity was measured using a backlit Early Treatment of Diabetic Retinopathy Study chart, with values converted into logMAR acuities as previously described.27 Visual field testing was completed in the prior 12 months on a Humphrey Field Analyzer II (Carl Zeiss Meditec) using the 24-2 Swedish Interactive Testing Algorithm, as described elsewhere.21 Other variables included in multivariable analysis were participants’ age, sex, race/ethnicity, employment status, marital status, education, day of week (weekday vs weekend), and population density for participants’ home location based on 2010 US Census track population.
Statistical Analysis
Descriptive statistics were provided for all variables. Although the analysis focused on better-eye logMAR VA and better-eye VF MD as measures of disease severity, descriptive statistics were stratified by disease classification (ie, control, glaucoma, and AMD) to ascertain potential differences across these disease classifications and to assess potential biases in the other variables of interest.
Each study participant had up to 7 days of tracking data, yielding individual time series of at most 7 daily average maximum distances traveled away from home and 7 daily average excursion span outcome measures. Longitudinal regression models were used to analyze each day’s average excursion size and average excursion span as an outcome after adjusting for potential confounders. Regression inference was based on generalized estimating equations to account for within-person (repeated) time measures.28 Regression models were built by first considering all variables in a univariate approach to assess contributions of effects individually then inclusion of other supporting variables with better-eye VA or better eye VF MD variables in the model. Inclusion of variables in final models was based on statistical significance at the 0.05 level and significance in univariate analyses. Interaction effects were considered for the included regression main effects. Models built to assess the effect of VA only included the participants in the control and AMD groups, while models to assess the effect of better-eye VF loss only included the control and glaucoma groups.
Participants with multiple home locations (n = 9:2 control subjects, 5 participants with glaucoma, and 2 subjects with AMD) and those with missing or otherwise invalid tracking information (n = 6: 4 participants with glaucoma and 2 with AMD) were excluded from the analysis. Days and times when the tracking device was inoperable (most frequently as a result of battery failure) were also removed, as well as participant days that included no travel. Additionally, participants who never left their home (n = 2:1 participant with glaucoma and 1 with AMD) and days with anomalously large travel excursions away from home (4 days) were excluded. All 4 of these excluded large travel days had a daily travel more than 7 times their next-largest respective daily travel, in terms of our average excursion size and average excursion span metrics, and 3 even larger and suspected air travel on those days given their space-time locations.
These latter 2 restrictions were imposed to exclude atypical travels so as not to affect our analysis designed to explore everyday travels. The remaining data set available for analysis comprised 193 participants for a total of 1048 participant tracking days (each person had on average 5.4 valid tracking days). Data preparation and analysis were performed in ArcGIS29 and the R Statistical Computing Environment.30
Results
Subjects with AMD had worse VA when compared with control participants, and subjects with glaucoma had greater VF loss than control subjects (Table 1). Subjects with AMD, but not those with glaucoma, were older than control participants (mean age, 74.4 vs 69.6 years; P < .001), were less frequently African American (1.8% vs 20.3%, P < .001), and were less likely to be employed (21.8% vs 39.0%, P = .02). Neither subjects with glaucoma nor AMD differed from control participants with regard to sex, marital status, driving status, education, population density of their home location, or the percentage of study days occurring on weekends. Driving status was defined as a self-report of any driving in the 3 months prior to study participation.
Table 1.
Descriptive Characteristics for the Study Population Stratified by the Control, Glaucoma, and AMD Classifications
| Variable | Control (n = 59) | Glaucoma (n = 74) | AMD (n = 60) |
|---|---|---|---|
| Acuity, mean (SD), logMAR | 0.07 (0.12) | 0.25 (0.33) | 0.44 (0.32) |
| Acuity, Snellen | 20/23 | 20/36 | 20/55 |
| Better-eye VF MD, mean (SD) | 0.10 (1.34) | −10.63 (7.43) | NA |
| Age, mean (SD), y | 69.6 (5.2) | 70.5 (5.3) | 74.4 (5.0) |
| Male, % | 40.7 | 44.6 | 41.8 |
| African American, % | 20.3 | 33.8 | 1.8 |
| Married, %a | 71.2 | 68.9 | 70.0 |
| Employed (yes vs no), % | 39.0 | 44.6 | 21.8 |
| Driving status (yes vs no), %b | 89.9 | 77.2 | 75.7 |
| Education, mean (SD), y | 15.3 (2.8) | 14.9 (2.7) | 14.9 (2.1) |
| Population/sq mile, mean (SD)c | 4.3 (5.2) | 5.0 (6.4) | 3.4 (5.3) |
| Weekday (yes vs no), %d | 68.1 | 66.3 | 61.8 |
Abbreviations: AMD, age-related macular degeneration; MD, mean deviation; NA, not available; VF, visual field.
Married also included those living together vs not married.
Any self-reported driving in the prior 3 months.
Population per square mile in units of 1000 people.
Weekday variable summarized over all 1048 person tracking days.
The overall average excursion size (calculated as the grand mean for all excursions) was 6.3 miles for all subjects, 6.9 miles for control subjects, 6.3 miles for subjects with glaucoma (P = .63 compared with control subjects), and 5.6 miles for subjects with AMD (P = .09 compared with control subjects). The overall average excursion span (measuring the span of travel within an excursion) was 5.9 miles for all subjects; 6.4 miles for control subjects, 6.0 miles for subjects with glaucoma (P = .82 compared with control subjects), and 5.3 miles for subjects with AMD (P = .13 compared with control subjects). Subjects with severe glaucoma (VF MD of −12 or worse, n = 35) and severe AMD (logMAR of 0.3 or worse, n = 74) also did not differ from control participants with respect to average excursion size or average excursion span (P > .10 in multivariable analyses). Therefore, regression analysis focused on the continuous measures of vision, better-eye VA (logMAR for subjects with AMD and control participants) and better-eye VF MD (for subjects with glaucoma and control subjects), rather than disease classification. Plots for the outcome average excursion size as a function of VA and VF MD for these respective subgroups are shown in Figure 2. The results in Figure 2 represent the average excursion size averaged over each person’s week of travel. These plots provided visual insight into trends as a function of vision, although they did not fully capture the longitudinal aspect of the data as the following regression analysis did. Patterns for the outcome average excursion span (not shown) were similar.
Figure 2. Scatterplots of Daily Average Excursion Size.
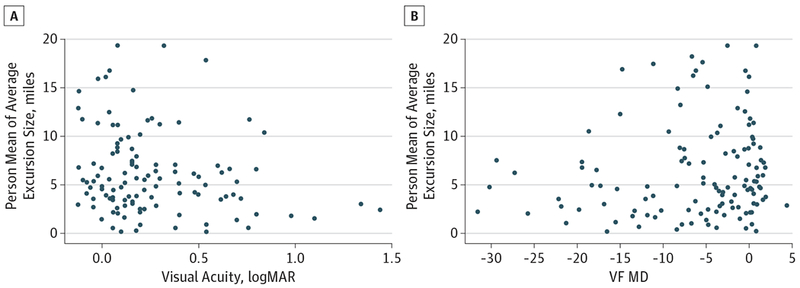
Scatterplots of daily average excursion size averaged for each person’s week of travel as a function of disease severity. A, Plot of visual acuity (logMAR) vs person mean average daily excursion size for the participants with age-related macular degeneration and control subjects. B, Plot of better-eye visual field (VF) mean deviation (MD) vs person mean average daily excursion size for those with glaucoma and control subjects.
In univariate longitudinal regression models including participants with AMD and control subjects, predictors of a lower average excursion size (as a measure of distance traveled away from home) included worse VA, older age, African American race, being unmarried, prior self-reported driving, and having a home in an area with greater population density (P ≤ .05) (Table 2). In multivariable models controlling for age, race/ethnicity, marital status, and home population density, each 1-line (0.1 logMAR) decrement in better-eye VA was associated with a 0.26-mile decrease (95% CI, −0.49 to −0.02) in average excursion size (P = .03). Similar results were found for average excursion span, with each 1-line (0.1 logMAR) decrement in better-eye VA associated with a 0.26-mile decrease (95% CI, −0.60 to −0.13) in average excursion span (P = .02). Sex, employment status, and education level were not significantly associated with average excursion size or average excursion span.
Table 2.
Repeated Measures Regression Model Results for the Outcomes Average Excursion Size and Average Excursion Spana
| Average Excursion Size, Miles | Average Excursion Span, Miles | |||
|---|---|---|---|---|
| Univariate | Multivariate | Univariate | Multivariate | |
| Variable | Coefficient | Coefficient (95% CI) | Coefficient | Coefficient (95% CI) |
| Acuityb | −0.33c | −0.26 (−0.49 to −0.02)c | −0.34c | −0.26 (−0.56 to −0.13)c |
| Age, yd | −0.85c | −0.85 (−1.50 to −0.25)c | −0.95c | −0.95 (−0.90 to −1.55)c |
| Male | 0.01 | −0.16 | ||
| African American | −1.57c | −1.96 (−3.71 to −0.20)c | −1.46 | −1.97 (−3.71 to −0.24)c |
| Married (yes vs no) | 2.27c | 1.97 (0.73 to 3.21)c | 2.01c | 1.72 (0.50 to 2.94)c |
| Employed (yes vs no), y | 0.62 | 0.62 | ||
| Driving status (yes vs no) | 2.71c | 2.64c | ||
| Education | 0.24 | 0.23 | ||
| Population/sq milee | −0.25c | −0.21 (−0.34 to −0.09)c | −0.22c | −0.19 (−0.31 to −0.07)c |
| Weekday (yes vs no) | −1.31 | −1.32 | ||
Analysis results are based on the 1048 person tracking days.
Results for acuity are for a 0.1 incremental change in logMAR.
Coefficients represent significance at the 0.05 level. These results focus on the effect of acuity and therefore only consider the control subjects and those with age-related macular degeneration.
Results for age are for a 5-year incremental change in years of age.
Population per square mile in units of 1000 people.
Significant differences in age and race/ethnicity between subjects with AMD and control participants (Table 1) were controlled for in the previously mentioned regression analysis. However, since subjects with AMD included a very low percentage of African Americans, follow-up regressions excluding African Americans from the analysis were performed and yielded results consistent to those reported here. No significant interactions were found for the included regression main effects. Season was also considered as a variable but did not reveal any significant associations in any models with either outcome. Sensitivity analysis was performed excluding the few subjects with AMD with the highest measured VA to see whether their inclusion was biasing the results. Although results changed quantitatively, estimated effects of acuity in the multivariate model decreased from −0.26 (P = .03) to the still-significant value of −0.28 (P = .02), the qualitative interpretation of approximately a one-quarter-mile decrease in average excursion size for each 1-line (0.1 logMAR) decrement in better-eye VA remained unchanged.
In univariate models including the participants with glaucoma and control subjects, severity of VF loss was marginally associated with a lower average excursion size (P = .05) and nonsignificant for average excursion span (P = .14). Severity of VF loss was not significantly associated with average excursion size or average excursion span in multivariable models (P > .17 for both). Although not statistically significant, these effects were in the direction consistent with more restricted travel with greater visual impairment.
Discussion
Worse VA as a result of AMD was associated with restriction of travel to nearby destinations, with each 1-line (0.1 logMAR) decrement in better-eye VA associated with an approximately one-quarter-mile decrease in average excursion size and span for away-from-home travels. No associations were observed between average excursion size and span with severity of better-eye VF loss resulting from glaucoma. Our findings suggest that vision impairment from AMD might result in, or reflect, social isolation and difficulty accessing health care services outside the home. Significant differences in travel patterns were not observed when considering subject groupings of glaucoma or AMD vs control, although changes in travel pattern trended toward restriction, and greater restriction was observed with continuous measures of vision in subjects with AMD. These findings suggest travel restriction may worsen with disease severity but may not be substantially affected at early stages of disease.
Vision impairment has been associated with several types of mobility deficits including poor balance, falls, fear of falling, driving modification, and difficulty with walking speed and hazard detection.9,11–14,31–34 Likely downstream effects of mobility problems owing to vision impairment included less travel outside the home, restriction of physical activity, difficulty with some activities of daily living, and a greater frequency of institutionalization7,10,35 (also P.Y.R., E. Maul, MD, E. Chan, MS, L.F., D.S.F.; unpublished data; January 2013). Here, we demonstrated another downstream effect of mobility impairment specific to VA loss from AMD: restriction of travel to more nearby locations. This restriction of travel, along with other mobility difficulties, may in turn lead to social isolation that could affect mood or lead to depression in some individuals with AMD. However, it is possible that mobility restrictions, such as the ones observed here, are the result of social isolation, and not its cause. For example, VA loss can lead to difficulty recognizing friends and family,11 leading to avoidance of social events and travel outside of necessary daily activities.
Our results suggest that difficulty with mobility with certain types of vision impairment may be environment specific, in that environments further away from the house are more frequently avoided. A tendency to stay closer to home may reflect a desire to restrict oneself to familiar surroundings, a disinclination to drive outside the local area, or restriction of activities to chores/shopping with avoidance of social activities that may take the person further from home. Further research, in which the reasons for travel excursions are identified, is required to distinguish these possibilities.
An additional implication of restricted travel is impaired access to health care and other relevant services, and our results suggest that individuals with decreased vision from AMD may have particular difficulty accessing these services. Not all patients are likely to have a retinal specialist nearby their home, which can be burdensome when frequent doctor visits (eg, for monthly injections of antivascular endothelial growth factor medications) are required. Likewise, most low-vision services are clinic based and may be difficult to access when outside the typical travel distance of the patient. Future research is necessary to optimize service delivery to patients with vision impairment from AMD including options such as home-based low-vision rehabilitation.
Limitations of our study included the fact that linear distance may not be the best metric for assessing breadth of travel. Additionally, breadth of travel may decrease as a result of all necessary services being nearby the home, and not because of visual limitations. We attempted to adjust for this limitation by including population density in regression models, although business density (which is not easily calculated) might not relate to population density in all cases. An additional limitation was that the most immobile individuals were likely not sampled, as participants enrolled were willing and physically able to seek care, and some traveled large distances to visit the Wilmer Eye Institute. Our results would then be more conservative than the reality, and the true differences in excursions may be greater than measured. Information was also not available on other comorbidities or daily weather; both factors may affect travel patterns.
A significant strength of the current study was the use of directly measured travel as opposed to self-report. Using cellular tracking to measure travel provided an objective measure of travel and living space that is rare in the current literature. Many studies use self-reported measures of health and mobility, such as self-reported community participation,3 a driving habits questionnaire,36 vision function questionnaires,36 health-related quality of life surveys,16 and activities of daily living questionnaires.37 Analyzing travel objectively is likely to provide the most accurate data in determining issues relating to real-world travel patterns.
In summary, AMD-related decreases in VA were significantly associated with restriction of the distances traveled from home and the span of excursions. Similar effects were also observed with VF loss from glaucoma, although associations did not meet criteria for statistical significance. Reduced mobility resulting from vision loss may lead to difficulties in performing daily activities,3,38 but also to loss of travel outside the home,18 decreased physical activity,19 social isolation,22 and depression.23–26 Restriction of travel to nearby locations may be a specific problem contributing to these difficulties, particularly in diseases producing decreased VA. Validated strategies to motivate and safely enable travel may be an important aspect of low-vision rehabilitation in individuals with poor vision from AMD.
Acknowledgments
Funding/Support: This work was supported by the Dennis W. Jahnigen Memorial Award, National Institutes of Health grant EY018595, the Research to Prevent Blindness Robert and Helen Schaub Special Scholar Award, and the Intramural Research Program of the National Institutes of Health National Institute on Aging.
Role of the Sponsors: The sponsors had no role in the design and conduct of the study; collection, management, analysis, and interpretation of the data; and preparation, review, approval of the manuscript; and decision to submit the manuscript for publication.
Footnotes
Conflict of Interest Disclosures: None reported.
REFERENCES
- 1.Knudtson MD, Klein BE, Klein R, Cruickshanks KJ, Lee KE. Age-related eye disease, quality of life, and functional activity. Arch Ophthalmol. 2005;123(6):807–814. [DOI] [PubMed] [Google Scholar]
- 2.Pelletier ALTJ, Thomas J, Shaw FR. Vision loss in older persons. Am Fam Physician. 2009;79(11):963–970. [PubMed] [Google Scholar]
- 3.Alma MA, van der Mei SF, Melis-Dankers BJ, van Tilburg TG, Groothoff JW, Suurmeijer TP. Participation of the elderly after vision loss. Disabil Rehabil. 2011;33(1):63–72. [DOI] [PubMed] [Google Scholar]
- 4.National Institutes of Health National Eye Institute. National Eye Health Education Program five-year agenda: 2012-2017. http://www.nei.nih.gov/nehep/docs/NEHEP_Five-Year_Agenda_2012-2017.pdf.
- 5.Friedman DSJH Jampel HD, Muñoz B, West SK. The prevalence of open-angle glaucoma among blacks and whites 73 years and older: the Salisbury Eye Evaluation Glaucoma Study. Arch Ophthalmol. 2006;124(11):1625–1630. [DOI] [PubMed] [Google Scholar]
- 6.Bressler SBMB, Muñoz B, Solomon SD,West SK; Salisbury Eye Evaluation (SEE) Study Team. Racial differences in the prevalence of age-related macular degeneration: the Salisbury Eye Evaluation (SEE) Project. Arch Ophthalmol. 2008;126(2):241–245. [DOI] [PubMed] [Google Scholar]
- 7.Willis JR, Jefferys JL, Vitale S, Ramulu PY. Visual impairment, uncorrected refractive error, and accelerometer-defined physical activity in the United States. Arch Ophthalmol. 2012;130(3):329–335. [DOI] [PubMed] [Google Scholar]
- 8.Glaucoma Ramulu P. and disability: which tasks are affected, and at what stage of disease? Curr Opin Ophthalmol. 2009;20(2):92–98. [DOI] [PMC free article] [PubMed] [Google Scholar]
- 9.Ramulu PYWS, West SK, Munoz B, Jampel HD, Friedman DS. Driving cessation and driving limitation in glaucoma: the Salisbury Eye Evaluation Project. Ophthalmology. 2009;116(10):1846–1853. [DOI] [PMC free article] [PubMed] [Google Scholar]
- 10.Hochberg CME, Maul E, Chan ES, et al. Association of vision loss in glaucoma and age-related macular degeneration with IADL disability. Invest Ophthalmol Vis Sci. 2012;53(6):3201–3206. [DOI] [PMC free article] [PubMed] [Google Scholar]
- 11.West SKRG Rubin GS, Broman AT, Muñoz B, Bandeen-Roche K, Turano K. How does visual impairment affect performance on tasks of everyday life? the SEE Project: Salisbury Eye Evaluation. Arch Ophthalmol. 2002;120(6):774–780. [DOI] [PubMed] [Google Scholar]
- 12.Wood JMLP, Lacherez P, Black AA, Cole MH, Boon MY, Kerr GK. Risk of falls, injurious falls, and other injuries resulting from visual impairment among older adults with age-related macular degeneration. Invest Ophthalmol Vis Sci. 2011;52(8):5088–5092. [DOI] [PubMed] [Google Scholar]
- 13.Black AA,Wood JM, Lovie-Kitchin JE, Newman BM. Visual impairment and postural sway among older adults with glaucoma. Optom Vis Sci. 2008;85(6):489–497. [DOI] [PubMed] [Google Scholar]
- 14.Ramulu PY, van Landingham SW, Massof RW, Chan ES, Ferrucci L, Friedman DS. Fear of falling and visual field loss from glaucoma. Ophthalmology. 2012;119(7):1352–1358. [DOI] [PMC free article] [PubMed] [Google Scholar]
- 15.Lord SR Sr, Smith ST, Menant JC. Vision and falls in older people: risk factors and intervention strategies. Clin Geriatr Med. 2010;26(4):569–581. [DOI] [PubMed] [Google Scholar]
- 16.Chia E-M, Wang JJ, Rochtchina E, Smith W, Cumming RR, Mitchell P. Impact of bilateral visual impairment on health-related quality of life: the Blue Mountains Eye Study. Invest Ophthalmol Vis Sci. 2004;45(1):71–76. [DOI] [PubMed] [Google Scholar]
- 17.Stalvey BT, Owsley C, Sloane ME, Ball K. The Life Space Questionnaire: a measure of the extent of mobility of older adults. J Appl Gerontol. 1999;18(4):460–478. doi: 10.1177/073346489901800404. [DOI] [Google Scholar]
- 18.Baker PSBE Bodner EV, Allman RM. Measuring life-space mobility in community-dwelling older adults. J Am Geriatr Soc. 2003;51(11):1610–1614. [DOI] [PubMed] [Google Scholar]
- 19.Peel C, Sawyer Baker P, Roth DL, Brown CJ, Brodner EV, Allman RM. Assessing mobility in older adults: the UAB Study of Aging Life-Space Assessment. Phys Ther. 2005;85(10):1008–1119. [PubMed] [Google Scholar]
- 20.Ramulu PY, Maul E, Hochberg C, Chan ES, Ferrucci L, Friedman DS. Real-world assessment of physical activity in glaucoma using an accelerometer. Ophthalmology. 2012;119(6):1159–1166. [DOI] [PMC free article] [PubMed] [Google Scholar]
- 21.Hochberg EM, Maul E, Chan ES, et al. Association of vision loss in glaucoma and age-related macular degenerationwith IADL disability. Invest Ophthalmol Vis Sci. 2012;53(6):3201–3206. [DOI] [PMC free article] [PubMed] [Google Scholar]
- 22.Ramulu PYCE Chan ES, Loyd TL, Ferrucci L, Friedman DS. Comparison of home and away-from-home physical activity using accelerometers and cellular network-based tracking devices. J Phys Act Health. 2012;9(6):809–817. [DOI] [PMC free article] [PubMed] [Google Scholar]
- 23.Richman J, Lorenzana LL, Lankaranian D, et al. Importance of visual acuity and contrast sensitivity in patients with glaucoma. Arch Ophthalmol. 2010;128(12):1576–1582. [DOI] [PubMed] [Google Scholar]
- 24.Scilley K, Jackson GR, Cideciyan AV, Maguire MG, Jacobson SG, Owsley C. Early age-related maculopathy and self-reported visual difficulty in daily life. Ophthalmology. 2002;109(7):1235–1242. [DOI] [PubMed] [Google Scholar]
- 25.Rubin GS, Muñoz B, Bandeen-Roche K, West SK. Monocular versus binocular visual acuity as measures of vision impairment and predictors of visual disability. Invest Ophthalmol Vis Sci. 2000;41(11):3327–3334. [PubMed] [Google Scholar]
- 26.Asaoka R, Crabb DP, Yamashita T, Russell RA, Wang YX, Garway-Heath DF. Patients have two eyes! binocular versus better eye visual field indices. Invest Ophthalmol Vis Sci. 2011;52(9):7007–7011. [DOI] [PubMed] [Google Scholar]
- 27.Bailey ILBM Bullimore MA, Raasch TW Taylor HR. Clinical grading and the effects of scaling. Invest Ophthalmol Vis Sci. 1991;32(2):422–432. [PubMed] [Google Scholar]
- 28.Diggle P, Heagerty P, Liang K-Y, Zeger S, eds. Analysis of Longitudinal Data. 2nd ed New York, NY: Oxford University Press USA; 2002. [Google Scholar]
- 29.Environmental Systems Research Institute. ArcGIS Desktop: Release 10. Redlands, CA: Environmental Systems Research Institute; 2011. [Google Scholar]
- 30.R Development Core Team. R: A Language and Environment for Statistical Computing. Vienna, Austria: R Foundation for Statistical Computing; 2012. [Google Scholar]
- 31.Black AAWJ, Wood JM, Lovie-Kitchin JE. Inferior field loss increases rate of falls in older adults with glaucoma. Optom Vis Sci. 2011;88(11):1275–1282. [DOI] [PubMed] [Google Scholar]
- 32.Freeman EEMB, Muñoz B, Turano KA,West SK. Measures of visual function and their association with driving modification in older adults. Invest Ophthalmol Vis Sci. 2006;47(2):514–520. [DOI] [PubMed] [Google Scholar]
- 33.Friedman DSFE, Freeman E, Munoz B, Jampel HD, West SK. Glaucoma and mobility performance: the Salisbury Eye Evaluation Project. Ophthalmology. 2007;114(12):2232–2237. [DOI] [PubMed] [Google Scholar]
- 34.Wood JMLP Lacherez PF, Black AA Cole MH, Boon MY Kerr GK. Postural stability and gait among older adults with age-related maculopathy. Invest Ophthalmol Vis Sci. 2009;50(1):482–487. [DOI] [PubMed] [Google Scholar]
- 35.Freeman EEGS Gange SJ, Muñoz B,West SK. Driving status and risk of entry into long-term care in older adults. Am J Public Health. 2006;96(7):1254–1259. [DOI] [PMC free article] [PubMed] [Google Scholar]
- 36.DeCarlo DK, Scilley K,Wells J, Owsley C. Driving habits and health-related quality of life in patients with age-related maculopathy. Optom Vis Sci. 2003;80(3):207–213. [DOI] [PubMed] [Google Scholar]
- 37.Freeman EE, Muñoz B, West SK, Jampel HD, Friedman DS. Glaucoma and quality of life: the Salisbury Eye Evaluation. Ophthalmology. 2008;115(2):233–238. [DOI] [PubMed] [Google Scholar]
- 38.Golledge RG. Geography and the disabled: a survey with special reference to vision impaired and blind populations. Royal Geogr Soc. 1993;18(1):63–85. doi: 10.2307/623069. [DOI] [Google Scholar]