

Abstract
Background
The striped field mouse, Apodemus agrarius, is the most common mammal in Korea. Although microsatellite loci for the species have been identified from populations in southwestern China, amplification of those markers for Korean populations have been unsuccessful. The complicated taxonomy of Korean striped field mouse including populations on Jeju Island (A. a chejuensis) necessitates identification of additional molecular markers.
Findings
We applied 454 pyrosequencing systems to develop a suite of microsatellite markers. Muscle tissue was harvested and sequenced from 30 Jeju striped field mouse specimens which yielded 12,165 reads with a mean length per read of 287 bp. From these reads, we identified 17 microsatellite loci for A. a. chejuensis and tested these new markers against samples of both A. a chejuensis and A. a coreae, the mainland taxon. All 17 loci were amplified successfully for both taxa. Of the total 17 loci, one locus failed to amplify for a population on Heuksan Island. The cross-species transferability was also tested with the allied taxon, A. peninsulae and confirmed successful for 12 loci.
Conclusions
These newly developed markers will benefit studies of genetic structure, evolution, and resolving taxonomic problems of striped field mice and allied taxa in Korea.
Keywords: Apodemus agrarius chejuensis, Microsatellites, South Korea, Jeju Island, Pyrosequencing
Introduction
With 24 subspecies, the striped field mouse, Apodemus agrarius (Pallas, 1771) is widely distributed throughout Eurasia [1]. Striped field mice are the most abundant mammal in Korea with an important place in the ecosystems as a primary prey item for predators and a vector of seed dispersal [2]. In Korea, four subspecies (A. a mantchuricus, A. a. chejuensis, A. a. pallenscens, and A. a. coreae) have been reported, but only A. a. chejuensis on Jeju Island has a definitive geographic barrier from the other subspecies [3]. Based on differences in morphology [4–7], physiology [8], and mitochondrial DNA [9–11], the taxonomic status of A. a. chejuensis has changed frequently in rank between species and subspecies. The striped field mouse is the first known vector of Hanta virus, which killed roughly 3000 United Nations soldiers per year during the Korean War, which has attracted great attention by epidemiologists [12]. Because hemorrhagic fever never occurred in Jeju Island, the island subspecies was used as a control for the isolation of Hanta virus [12].
Simple Sequence Repeats (SSRs, microsatellites) are one of the most common and efficient nuclear DNA markers for population genetics and phylogenetic studies of recently diverged taxa because they are multiallelic, highly polymorphic, abundant and show a codominant mode of inheritance [13, 14]. However, development of microsatellite markers has been costly, ineffective, and time consuming [15]. The application of next generation sequencing technology has greatly improved these challenges over the past few years [14].
To address ongoing taxonomic debates, the status of A. a. chejuensis and its relationship to mainland species should be examined using both haplotypic (mitochondrial DNA markers) and genotypic molecular markers (nuclear DNA markers). Wu et al. [16] developed 14 loci of microsatellite from populations in southwestern China; however, only five of 14 loci were successfully amplified in Korean striped field mouse samples [3]. Thus, nearly two thirds of the microsatellite markers available for the species failed to amplify in the targeted Korean populations [3]. Given the low transferability of the existing markers, we hypothesized that a limited proportion of markers developed for A. a chejuensis will be applicable for the mainland taxon, A. a coreae assuming their taxonomic status is different. Therefore, we developed 17 microsatellite loci from A. a. chejuensis for future investigation of genetic properties of the striped field mouse and then tested cross transferability for the markers against A. a coreae samples from the mainland.
Sample preparation and genotyping
We used muscle tissues of A. a. chejuensis collected on Jeju Island to develop microsatellites loci. We collected 15 individuals each at Yongdu-dong (YD), Jeju-si (N33°31′08.72″ E126°29′47.77″) and 15 individuals at Beophwan-dong (BH), Seogwipo-si, Korea (N33°24′42.97″ E126°51′52.74″). We captured mice in Sherman traps following guidelines of the American Society of Mammalogists [17]. Specimens were deposited in the mammal collection at the National Institute of Biological Resources, Korea (NIBRMM0000105863).
Genomic DNA was extracted using DNeasy Blood & Tissue Kit (Qiagen, Valencia, CA, USA). The isolated DNA was visualized on 1% agarose gel and quantified in NanoDrop 2000 (Thermo Fisher Scientific, Waltham, MA, USA). We used a total amount of over 2 μg with concentration of 50 ng/μL or higher for 454 pyrosequencing library preparation. Library preparation, amplification, and sequencing were conducted at Macrogen Inc. (Seoul, Korea). Briefly, after DNA quality control steps, isolated genomic DNAs were fragmented using restriction enzymes and tagged them with two multiplex identifiers. After amplification of DNA fragments, the prepared libraries were pooled and sequenced in 454 GS FLX platform (Roche).
Primer design and testing makers
Candidate loci for microsatellites were selected using QDD3 software [18]. A total of 335 primer pairs were obtained for candidate loci using PRIMER3 [19]. Each locus was then evaluated with PCR amplification performed with a total volume of 25 μl containing 1.0 μl of genomic DNA, 2.5 μl of 10× buffer (Takara), 0.7 μl of dNTP (2.5 mM each), 1.5 μl of MgCl2, 0.5 μl of primers each, and 0.3 U of Taq polymerase (Takara r-Taq, Takara). PCR conditions were follows: initial denaturation at 95 °C for 5 min followed by 35 cycles of denaturation at 94 °C for 60 s, annealing at 45–60 °C for 60 s, elongation at 72 °C for 90 s, and a final extension at 72 °C for 10 min. PCR products were selected and sequenced to confirm whether they contained microsatellite sequences.
A M13-tail (FAM: 5’-TTTCCCAGTCACGACGTTG-3′, VIC: 5’-GGAAACAGCTATGACCA-3′, PET: 5’-GCGGATAACAATTTCACACAGG-3′, NED: 5’-TAAAACGACGGCCAGTGC-3′) was added to the 5′ end of each forward primers while a pig tail (GTTTCTT) was added to the 5′ end of each reverse primers. For multiplex PCR, we performed PCR amplifications in a total reaction volume of 16 μl containing 5 μl of 2× QIAGEN Multiplex PCR master mix (QIAGEN), 0.08 μl of M13-tailed forward primer, 0.8 μl of pig tailed reverse primer, 0.3 μl of templated DNA and 0.16 μl of each of fluorescence primer (FAM/VIC/PET/NED). Multiplex PCR cycling conditions were as follows: initial denaturation at 95 °C for 15 min followed by denaturation at 95 °C for 30 s, annealing (14 cycles at 63 °C, 7 cycles at 58 °C, 20 cycles at 55 °C) for 90 s and 72 °C for 30 s, with a final elongation at 72 °C for 20 min.).
Genotyping and population analysis
We genotyped 30 Jeju striped field mice (A. a chejuensis) from two populations (YD and BH) with the newly designed microsatellites. The amplified fragments were separated in ABI 3730xl DNA analyzer (Applied Biosystem, Inc., Forster City, CA, USA) and GeneMapper software v3.7 (Applied Biosystems) was used for manual scoring.
To test for cross-species transferability, we amplified one congener (Agrarius peninsulae) and one subspecies (A. a. coreae) using the 17 developed markers with the same PCR conditions. Additionally, we added an A. agrarius sample collected from Heuksan Island in the cross-species transferability run because Jo et al. [3] suggested that the A. agrarius population in Heuksan Island might be a newly diverged subspecies from the mainland populations (A. a. coreae) in Korea.
The following genetic diversity parameters were calculated using ARLEQUIN 3.5 [20]: the number of alleles at each locus (A), observed heterozygosity (HO), expected heterozygosity (HE) and population divergence (FST) between the two populations (BH and YD). Polymorphic information contents (PIC) were also estimated in CENES software (http://www.ufv.br/dbg/genes/genes.htm; Cruz 2007). We tested whether significant deviation from Hardy-Weinberg equilibrium (HWE) within each population across all amplified loci in ARLEQUIN 3.5. Linkage disequilibrium (LD) between pairs of loci within each population was tested using GENEPOP 4.2.1 [21, 22]. All statistical significances of multiple comparisons were adjusted with sequential Bonferroni corrections [23]. We performed Analysis of Molecular Variance (AMOVA) to hierarchically partition the total genetic variance within and between the two populations in GENALEX v. 6.5 [24]. We also carried out principal coordinate analysis (PCoA) based on pairwise FST for all 30 individuals to examine clustering pattern among the individual genotypes in GENALEX v. 6.5 [24].
Results & discussion
Four hundred and fifty-four pyrosequencing produced 12,165 reads with a mean length of 287 bp. We selected 335 candidate microsatellite loci from the produced reads and confirmed that 17 loci were polymorphic (Table 1).
Table 1.
Characterization of 17 microsatellites of Apodemus agrarius chejuensis
| Locus | Repeat motif | Repeat number range | Primer sequence (5′-3′) | Dye | Size range (bp) |
|---|---|---|---|---|---|
| AC2 L | TGTA | 5–10 | F: TTTCCCAGTCACGACGTTGGAACCTCAAAGAAGTGGGCTT | 6FAM | 213–233 |
| R: GTTTCTTGGGATCATCAGCAGATAGCAG | |||||
| ACH7 | AACC | 5–9 | F: GCCCTGTACTTACCAACTCCC | 6FAM | 139–155 |
| R: GGTAGGTCAATGAGTTGGGTTC | |||||
| ACW7 | CA | 17–27 | F: TTTCCCAGTCACGACGTTGCAAGCTTGGGATCGCAGT | 6FAM | 211–231 |
| R: GTTTCTTGGCCCTTCCTGCATACTTTG | |||||
| AC9S | CA | 18–25 | F: TAAAACGACGGCCAGTGCTTTGTCCTTGCAAACTACCC | 6FAM | 260–274 |
| R: GTTTCTTACCAAGATTGTAAGATGGCTGAA | |||||
| ACAQ | TG | 15–31 | F: TTTCCCAGTCACGACGTTGGCTTGGGATCATGTCCACTT | 6FAM | 162–194 |
| R: GTTTCTTGACTGTTTAACTTGACTCTAGATTGTG | |||||
| ACWV | CCA | 6–11 | F: TTTCCCAGTCACGACGTTGGCTTGGGATCAGTTGCTAGG | 6FAM | 316–331 |
| R: GTTTCTTTGTGAACACTGATGTTTATGTTCC | |||||
| ACAV | AG | 5–9 | F: TTTCCCAGTCACGACGTTGGGATCAAAGCCAGTCCTGAG | 6FAM | 192–200 |
| R: GTTTCTTTTCTATCTTTAGGTACTCTGTTTCCC | |||||
| ACU8 | AACC | 6–18 | F: TTGGGATCAATCAGTCAGTCAG | HEX | 291–339 |
| R: TGCATGAATTACTAAACAGAGTATCAA | |||||
| AC9 M | CA | 4–5 | F: GGAAACAGCTATGACCACCACGTTACACACACCATGC | VIC | 165–167 |
| R: GTTTCTTGTGGTACAGGTAAAGCGTGGG | |||||
| AC124 | TG | 6–8 | F: GGAAACAGCTATGACCATTCCCGTCTGAGTGAAGACATG | VIC | 278–282 |
| R: GTTTCTTGCACACTCTGCTTTTTCTTGGG | |||||
| ACEC | ATGA | 5–10 | F: GGAAACAGCTATGACCATGAGTGCAATGGCAGAAGTC | VIC | 148–168 |
| R: GTTTCTTGGCCTCACGAGCATACAGA | |||||
| ACQT | AG | 7–12 | F: GGAAACAGCTATGACCATCTTTGTTTGACACCCACCA | VIC | 160–170 |
| R: GTTTCTTGGTTCCTCACTCCCATTCAA | |||||
| ACHZ | TTTTG | 7–16 | F: GCGGATAACAATTTCACACAGGTCCCTTGAAGAGTGCTCACC | PET | 312–357 |
| R: GTTTCTTCCTGAGGAGACCCATCCTTA | |||||
| AC53 | AAAC | 7–15 | F: GCGGATAACAATTTCACACAGGTTCAGAGGGTATACTGGGGAGG | PET | 313–345 |
| R: GTTTCTTCAGTGTGGGCACTGTGAAAT | |||||
| ACLI | TG | 5–6 | F: TAAAACGACGGCCAGTGCGGCCACGCTAACAATCTCAT | NED | 231–233 |
| R: GTTTCTTTGTTATGAATGCCCTGACCA | |||||
| AC5S | AC | 20–49 | F: TAAAACGACGGCCAGTGCTGGGATCAGTTAATTCAAGGC | NED | 153–211 |
| R: GTTTCTTTCTGTAAGGCCAGAGGGCTA | |||||
| ACPJ | AC | 10–36 | F: TAAAACGACGGCCAGTGCTATCATCCCATAGCAGGCAGA | NED | 132–184 |
| R: GTTTCTTAGCTTCTGTGATGGGATGGT |
F denote forward sequences and R denote revers sequences
The number of alleles per locus in the two populations of A. a. chejuensis varied from 2 to 11 in YD and 2–13 in BH. Ranges of HE and HO in YD were 0.067–0.905 and 0.067–0.867, respectively. In BH, HE and HO were 0.067–0.913 and 0.067–0.917, respectively (Table 2). The value of polymorphic information content ranged from 0.067 to 0.856 with a mean of 0.537 in YD. It ranged from 0.062 to 0.872 with a mean of 0.672 in BH. Three loci in YD and four loci in BH were significantly deviated from HWE after Bonferroni correction (p < 0.0001). No linkage disequilibrium was detected at any pair of loci.
Table 2.
Genetic diversity indices of two populations of Apodemus agrarius chejuensis in Jeju Island, South Korea
| Yongdu-dong (YD) | Beophwan-dong (BH) | |||||||||||||
|---|---|---|---|---|---|---|---|---|---|---|---|---|---|---|
| Locus | n | A | H E | H O | F IS | PIC | HWE | n | A | H E | H O | F IS | PIC | HWE |
| AC2 L | 15 | 5 | 0.605 | 0.200 | 0.677 | 0.543 | * | 15 | 4 | 0.674 | 0.467 | 0.315 | 0.587 | ns |
| ACH7 | 15 | 3 | 0.248 | 0.267 | −0.077 | 0.227 | ns | 15 | 5 | 0.694 | 0.667 | 0.041 | 0.629 | ns |
| ACW7 | 15 | 10 | 0.905 | 0.692 | 0.242 | 0.856 | ns | 15 | 8 | 0.884 | 0.333 | 0.633 | 0.830 | * |
| AC9S | 15 | 7 | 0.779 | 0.800 | −0.028 | 0.729 | ns | 15 | 7 | 0.867 | 0.667 | 0.237 | 0.814 | ns |
| ACAQ | 15 | 11 | 0.853 | 0.867 | −0.017 | 0.807 | ns | 15 | 9 | 0.865 | 0.643 | 0.264 | 0.820 | ns |
| ACWV | 15 | 4 | 0.570 | 0.333 | 0.431 | 0.497 | ns | 15 | 1 | – | – | – | – | – |
| ACAV | 15 | 2 | 0.480 | 0.333 | 0.314 | 0.357 | ns | 15 | 3 | 0.549 | 0.333 | 0.402 | 0.421 | ns |
| ACU8 | 15 | 4 | 0.628 | 0.267 | 0.590 | 0.557 | ns | 15 | 7 | 0.805 | 0.800 | 0.012 | 0.753 | ns |
| AC9 M | 15 | 2 | 0.067 | 0.067 | 0.000 | 0.062 | ns | 15 | 2 | 0.186 | 0.067 | 0.650 | 0.164 | ns |
| AC124 | 15 | 3 | 0.191 | 0.067 | 0.659 | 0.175 | ns | 15 | 2 | 0.067 | 0.067 | 0.000 | 0.062 | ns |
| ACEC | 15 | 5 | 0.717 | 0.467 | 0.357 | 0.643 | ns | 15 | 5 | 0.713 | 0.133 | 0.818 | 0.636 | * |
| ACQT | 15 | 4 | 0.476 | 0.2143 | 0.559 | 0.427 | ns | 15 | 3 | 0.570 | 0.133 | 0.772 | 0.485 | * |
| ACHZ | 15 | 5 | 0.740 | 0.867 | −0.178 | 0.664 | ns | 15 | 9 | 0.826 | 0.917 | −0.115 | 0.764 | ns |
| AC53 | 15 | 5 | 0.802 | 0.786 | 0.021 | 0.737 | ns | 15 | 8 | 0.870 | 0.917 | −0.048 | 0.821 | ns |
| ACLI | 15 | 2 | 0.198 | 0.214 | −0.083 | 0.173 | ns | 15 | 1 | – | – | – | – | – |
| AC5S | 15 | 8 | 0.885 | 0.467 | 0.473 | 0.824 | * | 15 | 8 | 0.802 | 0.533 | 0.343 | 0.752 | ns |
| ACPJ | 15 | 10 | 0.887 | 0.467 | 0.483 | 0.843 | * | 15 | 13 | 0.913 | 0.600 | 0.351 | 0.872 | * |
n number of individuals, A number of allele, HE expected heterozygosity, HO observed heterozygosity, FIS inbreeding coefficient, PIC polymorphic information contents, HWE Hardy-Weinberg equilibrium, ns not significant and – uncomputed
*Significant after Bonferroni correction (p < 0.0029)
FST (0.05) estimated between the two Jeju striped field mouse populations was not significantly different from zero (P > 0.99). The AMOVA results revealed that in the two populations most of genetic variation (88%) was harbored within each population, whereas among population genetic variation was proportionally minor (12%; Fig. 1). Coupled with the small FST value, the AMOVA results suggest that YD and BH are not greatly diverged in part due to high gene flow between the two populations. However, the PCoA analysis showed spatial structure among the two populations. Overall, the genotypes from each population are affiliated with the population from which the genotypes were drawn (Fig. 2). The clustering pattern indicates that the 17 markers developed from our study have sufficient power to separate out the two local populations.
Fig. 1.
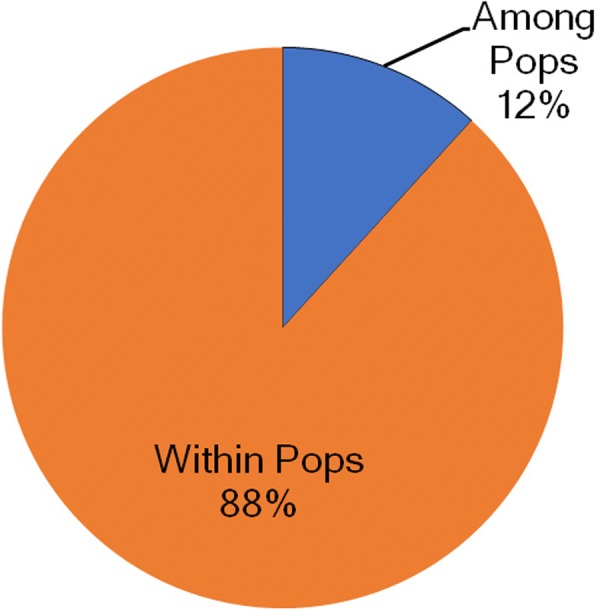
A pie chart summarizing AMOVA results. Genetic variance was hierarchically partitioned into two levels: 1) among populations (12% of total genetic variance) and 2) within each population (88% of total genetic variance)
Fig. 2.

PCoA plot for 30 individual genotypes of A. agrarius chejuensis from two populations. The first two variance components PC1 and PC2 were plotted. BHs are samples from Beophwan-dong and YDs are from Yongdu-dong
Cross-species amplification examined for a subspecies, A. a. coreae, and its congeneric species, A. peninsulae, in South Korea showed high cross-species transferability. All 17 loci were successfully amplified for A. a. coreae and 12 of 17 loci were successfully amplified for A. peninsulae (Table 3). Except for the AC53 locus, all microsatellite loci were successfully amplified for individuals collected on Heuksan Island. The cross-species amplification could be an indicator of genetic distance among species. The Jeju island subspecies, A. a chejuensis has often been regarded a distinct species in Korea [3]. In contrast, the classification of the population on Heuksan Island has been A. a. coreae (the same as the mainland populations) in most of the literature despite its high genetic divergence from mainland populations as revealed in a microsatellite analysis [3]. Our cross-species amplification tests suggested that the subspecies A. a chejuensis might be more closely related to the mainland populations of A. a. coreae than the populations on Heuksan Island. Intensive population level studies with these developed markers might elucidate the true phylogenetic relationships among these three taxa.
Table 3.
Results of cross-species amplifications
| Loci | Species | |
|---|---|---|
| Apodemus agrarius coreae | Apodemus peninsulae | |
| AC2 L | + | + |
| ACH7 | + | + |
| ACW7 | + | + |
| AC9S | + | + |
| ACAQ | + | + |
| ACWV | + | – |
| ACAV | + | – |
| ACU8 | + | + |
| AC9 M | + | + |
| AC124 | + | + |
| ACEC | + | – |
| ACQT | + | – |
| ACHZ | + | + |
| AC53 | + | + |
| ACLI | + | – |
| AC5S | + | + |
| ACPJ | + | + |
Seven individual of each species were tested
Note: + successful PCR amplification; − PCR failed
Although this species is the main vector of Hanta virus and the most common mammal in the Korean Peninsula, few studies have addressed populations of the striped field mouse in Korea. One of the limitations in the study of A. agrarius is the deficiency of genetic markers [4]. The microsatellite loci developed in this study have proven to be useful for investigating genetic structure, introgression, hybrid, and taxonomic status of A. agrarius in not only the Korean Peninsula but the entire distribution for the species. The genetic markers might also be used to establish a management strategy for A. a. chejuensis, the most common endemic rodent on Jeju Island.
Acknowledgments
This study was supported by a grant (NIBR201403201) from the National Institute of Biological Resources (NIBR), funded by the Ministry of Environment (MOE), Republic of Korea. Also, NIBR supported field collections of this study as a part of Wildlife Survey (NIBR20182401). We also thank Drs J. Baccus, P. Schlichting, M. Forstner, anonymous reviewers with the editors Y. Shi and S. Baumgartner for valuable suggestions and comments.
Funding
Genetic works were supported by a grant (NIBR201403201) and field collection was supported by Wildlife Survey (NIBR20182401).
Availability of data and materials
Dataset is provided by an additional file. All specimens are stored in National Institute of Biological Resources, Korea. It’s available after obtaining permission from the agency.
Abbreviations
- A
The number of allele at each locus
- BH
Beophwan-dong
- HE
Expected heterozygosity
- HO
Observed heterozygosity
- HWE
Hardy-Weinberg equilibrium
- LD
Linkage disequilibrium
- PIC
Polymorphic information contents
- SSR
Simple Sequence Repeat
- YD
Yongdu-dong
Authors’ contributions
HNK and JJ conceived the idea of this study. HNK collected samples. HNK and HUK performed lab works. YSJ and JJ wrote the manuscript. All authors read and approved the final manuscript.
Ethics approval
Sample collections were followed by guidelines of American Society of Mammalogists. This study was approved by Research Management Committee of National Institute of Biological Resources, Ministry of Environment, Korea.
Consent for publication
Not applicable.
Competing interests
The authors declare that they have no competing interests.
Publisher’s Note
Springer Nature remains neutral with regard to jurisdictional claims in published maps and institutional affiliations.
Contributor Information
Han-Na Kim, Email: nonno328@naver.com.
Han-Ul Kim, Email: khu0830@gmail.com.
Yeong-Seok Jo, Phone: 82-32-590-7496, Email: biostan@hotmail.com.
Jongwoo Jung, Phone: 82-2-3277-2616, Email: jongwoo@ewha.ac.kr.
References
- 1.Musser GG, Carleton MD. Superfamily Muroidae. In: Winson DE, Reeder DM, editors. Mammal species world a Taxon Geogr Ref. 3. Baltimore: Johns Hopkins University Press; 2005. pp. 894–1532. [Google Scholar]
- 2.Won PH. Illustrated encyclopedia of fauna and flora of Korea volume 7, mammals. Seoul: Ministry of Education; 1967. [Google Scholar]
- 3.Jo Y, Kim H, Baccus JT, Jung J. Genetic differentiation of the Korean striped field mouse, Apodemus agrarius (Muridae, Rodentia), based on microsatellite polymorphism. Mammalia. 2017;81:297–307. doi: 10.1515/mammalia-2015-0152. [DOI] [Google Scholar]
- 4.Koh HS. Geographic variation of morphometric characters among three subspecies of striped field mice, Apodemus agrarius Pallas (Muridae, Rodentia), from Korea. Korean J Zool. 1986;29:272–282. [Google Scholar]
- 5.Koh HS. Systematic studies of Korean rodents: III. Morphometric and chromosomal analyses of striped field mice, Apodemus agrarius chejuensis Jones and Johnson, from Jeju-Do. Korean J Syst Zool. 1987;3:24–40. [Google Scholar]
- 6.Koh HS. Systematic studies of Korean rodents. V. Morphometric and chromosomal analyses on island populations of striped field mice (Apodemus agrarius coreae) in southwestern coasts of the Korean peninsula. Korean J Syst Zool. 1989;5:1–12. [Google Scholar]
- 7.Koh HS. Morphometric analyses with eight subspecies of striped field mice, Apodemus agrarius Pallas (Rodentia, Mammalia), in Asia: the taxonomic status of subspecies chejuensis at Cheju island in Korea. Korean J Syst Zool. 1991;7:179–188. [Google Scholar]
- 8.Oh HS, Mori T. Taxonomic re-examination of the striped field mouse, Apodemus agrarius coreae and A. a. chejuensis: evidence from crossbreeding experiments. J Fac Agric Kyushu Univ. 1998;43:143–151. [Google Scholar]
- 9.Koh HS, Yoo BS. Variation of mitochondrial DNA in two subspecies of striped field mice, Apodemus agrarius coreae and Apodemus agrarius chejuensis, from Korea. Korean J Zool. 1992;35:332–338. [Google Scholar]
- 10.Koh HS, Lee WJ, Kocher TD. The genetic relationships of two subspecies of striped field mice, Apodemus agrarius coreae and Apodemus agrarius chejuensis. Heredity (Edinb) 2000;85:30–36. doi: 10.1046/j.1365-2540.2000.00723.x. [DOI] [PubMed] [Google Scholar]
- 11.Oh D-J, Kim T-W, Chang M-H, Han S-H, Oh H-S, Kim S-J. Migration route estimation of the Jeju striped field mouse Apodemus agrarius chejuensis (Rodentia, Muridae) Mitochondrial DNA. 2013;24:137–144. doi: 10.3109/19401736.2012.726619. [DOI] [PubMed] [Google Scholar]
- 12.Johnson KM. Hantaviruses: history and overview. Curr Top Microbiol Immunol. 2001;256:1–14. doi: 10.1007/978-3-642-56753-7_1. [DOI] [PubMed] [Google Scholar]
- 13.Ellegren H. Microsatellites: simple sequences with complex evolution. Nat Rev Genet. 2004;5:435–445. doi: 10.1038/nrg1348. [DOI] [PubMed] [Google Scholar]
- 14.Lopez L, Barreiro R, Fischer M, Koch MA. Mining microsatellite markers from public expressed sequence tags databases for the study of threatened plants. BMC Genomics [Internet]. BMC Genomics; 2015;16. Available from: doi:10.1186/s12864-015-2031-1 [DOI] [PMC free article] [PubMed]
- 15.Squirrell J, Hollingsworth PM, Woodhead M, Russell J, Lowe AJ, Gibby M, et al. How much effort is required to isolate nuclear microsatellites from plants? Mol Ecol. 2003;12:1339–1348. doi: 10.1046/j.1365-294X.2003.01825.x. [DOI] [PubMed] [Google Scholar]
- 16.Wu H, Zhan XJ, Yan L, Liu SY, Li M, Hu JC, et al. Isolation and characterization of fourteen microsatellite loci for striped field mouse (Apodemus agrarius) Conserv Genet. 2008;9:1691–1693. doi: 10.1007/s10592-008-9535-z. [DOI] [Google Scholar]
- 17.Sikes RS. 2016 guidelines of the American Society of Mammalogists for the use of wild mammals in research and education. J Mammal. 2016;97:663–688. doi: 10.1093/jmammal/gyw078. [DOI] [PMC free article] [PubMed] [Google Scholar]
- 18.Meglécz E, Pech N, Gilles A, Dubut V, Hingamp P, Trilles A, et al. QDD version 3.1: a user-friendly computer program for microsatellite selection and primer design revisited: experimental validation of variables determining genotyping success rate. Mol Ecol Resour. 2014;14:1302–1313. doi: 10.1111/1755-0998.12271. [DOI] [PubMed] [Google Scholar]
- 19.Untergasser A, Cutcutache I, Koressaar T, Ye J, Faircloth BC, Remm M, et al. Primer3-new capabilities and interfaces. Nucleic Acids Res. 2012;40:1–12. doi: 10.1093/nar/gks596. [DOI] [PMC free article] [PubMed] [Google Scholar]
- 20.Excoffier L, Lischer HEL. Arlequin suite ver 3.5: a new series of programs to perform population genetics analyses under Linux and windows. Mol Ecol Resour. 2010;10:564–567. doi: 10.1111/j.1755-0998.2010.02847.x. [DOI] [PubMed] [Google Scholar]
- 21.Raymond M, Rousset F. GENEPOP (version 1.2): population genetics software for exact tests and ecumenicism. J Hered. 1995;86:248–249. doi: 10.1093/oxfordjournals.jhered.a111573. [DOI] [Google Scholar]
- 22.Rousset F. GENEPOP’007: a complete re-implementation of the GENEPOP software for windows and Linux. Mol Ecol Resour. 2008;8:103–106. doi: 10.1111/j.1471-8286.2007.01931.x. [DOI] [PubMed] [Google Scholar]
- 23.Rice WR. Analyzing tables of statistical tests. Evolution (N Y) 1989;43:223–225. doi: 10.1111/j.1558-5646.1989.tb04220.x. [DOI] [PubMed] [Google Scholar]
- 24.Peakall R, Smouse PE. GenALEx 6.5: genetic analysis in excel. Population genetic software for teaching and research-an update. Bioinformatics. 2012;28:2537–2539. doi: 10.1093/bioinformatics/bts460. [DOI] [PMC free article] [PubMed] [Google Scholar]
Associated Data
This section collects any data citations, data availability statements, or supplementary materials included in this article.
Data Availability Statement
Dataset is provided by an additional file. All specimens are stored in National Institute of Biological Resources, Korea. It’s available after obtaining permission from the agency.