

Abstract
Objective:
To understand the role of cultural and psychosocial factors in the outcomes of Veteran wheelchair users with spinal cord injury (SCI) to help clinicians identify unique factors faced by their patients and help researchers identify target variables for interventions to reduce disparities in outcomes.
Design:
Cross-sectional cohort study
Setting:
Three urban VA Medical Centers affiliated with academic medical centers.
Participants:
Of the 516 patients who were eligible to participate, 482 completed the interview and 439 had SCI. Due to small numbers in other race groups, analyses were restricted to white (WH) and African American (AA) participants, resulting in a final sample of 422.
Intervention:
NA
Main outcome measures:
Quality of life (QOL, Veterans RAND 12 Item Health Survey); satisfaction (Client Satisfaction Questionnaire); and participation (Craig Handicap Assessment and Reporting Technique Short Form – CHART SF)
Results:
AA Veterans reported poorer physical QOL, but better mental QOL than did WH. No other significant race differences were found in unadjusted analyses. Multivariable analyses showed that psychosocial factors were predominantly associated with patients’ QOL outcomes and satisfaction with service, but demographic and medical factors were predominantly associated with participation outcomes. Interaction analyses showed that there was a stronger negative association between anxiety and mental QOL for AA than for WH, and a positive association between higher self-esteem and social integration for WH but not AA.
Conclusions:
Findings suggest that attempts to improve the outcomes of Veterans with SCI should focus on a tailored approach that emphasizes patients’ demographic, medical, and psychosocial assets (e.g., building their sense of self-esteem or increasing their feelings of mastery), while providing services targeted to their specific limitations (e.g., reducing depression and anxiety).
Keywords: spinal cord injury, race, quality of life
The proportion of racial and ethnic minority wheelchair users with spinal cord injury (SCI) has increased in recent decades.1 Although great strides have been made in reducing morbidity and mortality, and improving long-term health and community participation in this group, progress has not been uniform across all racial/ethnic groups. Among wheelchair users with SCI, racial and ethnic minorities tend to have higher rehospitalization rates, higher levels of depression, more days in poor health, higher unemployment, more difficulty with mobility, lower subjective well-being, poorer quality of life (QOL), lower life satisfaction, and greater risk of marital breakup.2–7 Racial and ethnic minorities also have an increased risk of secondary complications (e.g., pain, pressure ulcers) and poorer self-care ability as compared to whites (WH).5, 8–12 Similarly, previous studies have found higher rates of depressive symptomatology and lower rates of post-injury employment among minority wheelchair users with SCI, as compared to their WH counterparts. Further, WH versus minority race differences in pain severity and pain interference were significantly associated with differences in subjective wellbeing.13 Additional factors that may be associated with race (e.g., education, health literacy) have also been linked to health disparities in people with SCI.14–17
Previous work has not examined several key cultural or psychosocial factors among wheelchair users with SCI, or whether such factors are associated with QOL. Research in other clinical populations demonstrates that factors such as medical mistrust, perceived discrimination, locus of control, and health literacy18–24 are associated with race disparities in healthcare processes and outcomes. For example, AA are more likely to miss medical appointments or delay obtaining necessary care/prescriptions, and are less likely to seek certain health care options (e.g., tests, surgeries) or adhere to physician instructions, because they distrust the healthcare system and/or believe that it is a source of discrimination.23, 25–30 Although other factors such as self-image, and emotional distress have been examined in a number of healthcare populations,31–36 no studies have focused on wheelchair users with SCI, other than our own work with non-Veterans37.
Our conceptual model focuses on how patient, provider, and system-level factors within the healthcare setting may contribute to disparities in health and healthcare outcomes;38 and our previous work in non-VA settings demonstrated that cultural and psychosocial factors were associated with SCI wheelchair user outcomes,37 but in ways that differed from disparities research in other clinical populations described above. We found that higher levels of perceived discrimination and racism and better communication with health care providers were associated with an increase in participation and functioning and improvements in perceptions of well-being. Understanding the role of these factors in the VA will help clinicians identify unique factors faced by Veteran wheelchair users with SCI and will help researchers identify important variables upon which to intervene to reduce disparities in patient outcomes.
To accomplish this goal, we conducted a large-scale cohort study of Veteran wheelchair users with SCI. Our goals were to (a) compare patient demographics, medical factors, cultural and psychosocial characteristic by race; (b) compare patient outcomes (i.e., QOL, satisfaction, participation) by race; and, (c) assess the independent associations of patient race and other demographic, medical, cultural and psychosocial factors with patient outcomes. We hypothesized that: (1) AAs would endorse higher levels of perceived discrimination, racism, distrust, and emotional distress, but lower communication, health literacy, and self-image; (2) AAs would report lower levels of QOL, satisfaction, and participation than WHs; and (3) race differences in cultural factors and psychosocial characteristics would account for the advantages for WH Veterans in QOL, satisfaction, and participation.
METHODS
Participants
Data were collected from Veteran wheelchair users with SCI from three urban, academic-affiliated VA Medical Centers with an SCI specialty clinic that spanned the northern, middle, and Southeast Coast of the United States (03/2011–10/2013). Sites were selected based on the following criteria: (a) adequate numbers of SCI patients, (b) racial diversity among the patient population, (c) an actively engaged site PI, and (d) resources and ability to participate in the study. Sites obtained local Institutional Review Board approval prior to study initiation. Eligible participants were age≥18 years, had non-progressive SCI, used a power or manual wheelchair as their primary means of mobility for >1 year, and were non-ambulatory except for exercise purposes. We excluded Veterans who were non-English speakers, unable to communicate due to neurological impairment, or had diseases other than SCI that required wheelchair use.
Procedures
Participants completed a structured questionnaire face-to-face (~60 minutes) or by mail (for those who could not complete the questionnaire in person), and were compensated $40.00. Supplemental information detailing study procedures and measures are in Appendix 1.
Independent Variables
Demographic Characteristics and Medical Factors
Demographic characteristics and medical factors were assessed with standardized self-report measures used in our previous work.37 Demographic characteristics included race (WH, AA, Asian, American Indian/Alaskan Native, Native Hawaiian/Other Pacific Islander, other), ethnicity (Hispanic, non-Hispanic), gender, age, employment status, education, income, and insurance coverage. Medical factors included self-reported co-morbid medical and psychiatric conditions from a checklist of possible factors, and time since injury. Using chart reviews, we assessed level of injury (tetraplegia or paraplegia) and whether the participant’s wheelchair was prescribed at a VA with an SCI specialty clinic whose staff had advanced training in SCI treatment and wheelchair service delivery (yes/no).
Cultural Factors
We assessed all culturally-related factors using validated measures (all alphas presented are for the current sample). For experience with discrimination, participants indicated the extent to which they had experienced each of 7 discriminatory practices in the healthcare setting (range=1–6; Cronbach’s α=0.92).18, 27, 30 For perceived racism, participants indicated the extent to which they believed that 4 instances of racism occurs within the healthcare system (range=1–5; Cronbach’s α=0.83). 26, 29, 37 We assessed medical mistrust with the 9-item Healthcare System Distrust Scale39 (range=1–5; Cronbach’s α=0.86). We used a 4-item subset of the Components of Primary Care Index40 to assess communication with providers involved in participants’ SCI care (range=1–5; Cronbach’s α=0.70). We used the Rapid Estimate of Adult Literacy in Medicine (REALM-R)41 to assess health literacy, for which participants read aloud eight medical words and were assigned a score based on how many they read correctly (range=0–11).
Psychosocial Factors
We assessed emotional distress with the anxiety and depression subscales of the Brief Symptom Inventory (BSI).42 Endorsed symptoms in each subscale were summed to create total anxiety and depression scores (range for each=1–5; Cronbach’s α=0.86 for anxiety and 0.89 for depression). We assessed self-image using the 10-item Rosenberg Self-Esteem Scale43 (range=1–4) and the 7-item Sense of Mastery scale44 (range=1–4) (Cronbach’s α=0.88 for selfesteem and 0.82 for mastery).
Outcome Measures
We assessed patient satisfaction with their SCI service using the 8-item Client Satisfaction Questionnaire (CSQ-8) (range=8–32; Cronbach’s α=0.94).45 To assess QOL, we used the physical component summary (PCS) (range=20.45–61.31; Cronbach’s α=0.63) and mental component summary (MCS) (range=2.48–69.78; Cronbach’s α=0.63) scores from the Veterans RAND 12 Item Health Survey (VR-12) revised for patients in wheelchairs.46–48,49 We also included one item from the standard RAND-36 Health Status Inventory regarding patients’ overall assessment of their current health status.48 We assessed participation in society with the Craig Handicap Assessment and Reporting Technique Short Form50 (CHART-SF; overall Cronbach’s α=0.51), with sub-scales measuring physical independence (range=4–100), cognitive independence (range=0–100), mobility (range=3–100), occupation (range=0–100), and social integration (range=0–100).51, 52
Analyses
We assessed all data for violation of statistical assumptions (e.g., normality, kurtosis). Due to non-normal distributions, we dichotomized employment status (employed vs. not), education (≥some College), income (≥$25,000), insurance coverage (any private vs. no private), comorbid conditions (>1), communication with provider (>4), and health literacy (>10); we also categorized experience of discrimination as “ever/never.” Finally, due to non-normal distribution, we dichotomized the CHART outcomes as disabled (<100) or not disabled (=100).50 We chose cut points based on their distribution and whether the cut points were clinically meaningful based on the recommendation of the measurement developers.18, 27, 30, 40, 41, 50
We calculated descriptive statistics for all study variables. We compared racial groups using two sample t-tests for continuous variables and chi-square or Fisher exact tests for categorical variables. To determine the variables to include in our final analyses, we first regressed each outcome (patient satisfaction, QOL, CHART) on predictors that were associated with each given outcome at p≤ 0.10 when tested individually.53 We used linear regression for continuous outcomes (patient satisfaction and QOL), and if normality assumptions were violated, we used the bootstrap method to estimate the standard errors, significance level, and percentile confidence intervals. We used logistic regression for dichotomous outcomes (CHART). We examined the selected variables to identify potential multicollinearity. For pairs of variables with correlation ≥ 0.50 we retained only the variable that was more highly correlated with the outcome.52 In the final multivariable models, we retained race and any patient characteristics that were associated with the outcome at p<0.05. Finally, we tested all interactions between race and the variables retained in the final model.
RESULTS
Of the 516 patients who were eligible to participate in our study, 498 consented, 482 completed the interview, and 439 of those were patients with SCI. Six participants had missing race data, and another 11 participants identified as ‘other’ race. This group was significantly different from the AA participants and therefore could not be combined into one non-white group. But the group was too small to include as a third group for comparison. Thus, we restricted analyses to WH and AA participants (n=422). Ten of the 422 participants completed the questionnaire by mail, but did not differ from the remaining sample on race, age, or gender. There were four pairs of variables that were highly correlated (r>0.50): perceived racism and medical mistrust (r=0.56), mastery and self-esteem (r=0.68), depression and self-esteem (r=0.55) and anxiety and depression (r=0.76). We kept the one from each pair that was more highly correlated with each outcome.
Race comparisons for all patient characteristics and outcomes
Table 1 presents descriptive data for the study sample and racial comparisons on demographic, medical, cultural, and psychosocial factors. In our sample, all three sites had more WH participants than AA participants. Smaller proportions of AA than WH were female or married. AA also had significantly less education and income, and were less likely to be employed or have private insurance. There were no racial differences in age, ethnicity, whether Veterans received their wheelchair from an SCI specialty clinic, number of co-morbid conditions, or level of injury, but AA had fewer years since their injury than WH.
Table 1.
Comparison of demographic, medical, cultural, and psychosocial factors by race
| Factor | Total (N=422) |
African American (N=171) |
White (N=251) |
p-value1,2 |
|---|---|---|---|---|
| Site - % (N) by site | < 0.001 | |||
| VAMC A | 25.1 (106) | 41.5 (44) | 58.5 (62) | |
| VAMC B | 43.4 (183) | 49.2 (90) | 50.8 (93) | |
| VAMC C | 31.5 (133) | 27.8 (37) | 72.2 (96) | |
| Demographic - % (N) | ||||
| Gender (female) | 4.3 (18) | 1.8 (3) | 6.0 (15) | 0.04 |
| Ethnicity (Hispanic) | 5.2 (22) | 2.9 (5) | 6.8 (17) | 0.08 |
| Married (Yes) | 39.6 (167) | 32.8 (56) | 44.2 (111) | 0.02 |
| Educational level (≥ Some College) | 61.4 (259) | 51.5 (88) | 68.1 (171) | < 0.001 |
| Employment Status (Employed) | 10.7 (45) | 4.7 (8) | 14.7 (37) | < 0.001 |
| Family Income (≥ $25,000) | 44.6(188) | 38.6 (66) | 48.6 (122) | 0.02 |
| Insurance (Any Private - yes) | 14.0 (59) | 8.2 (14) | 17.9 (45) | < 0.01 |
| Wheelchair from SCI specialty clinic (yes) | 69.2 (292) | 71.4 (122) | 67.7 (170) | 0.54 |
| Age - M(SD) | 57.3 (12.3) | 57.7 (10.2) | 57.0 (13.6) | 0.56 |
| Medical - % (N) | ||||
| Co-Morbid Conditions ( > 1) | 49.3 (208) | 47.4 (81) | 50.6 (127) | 0.52 |
| Level of Injury | 0.08 | |||
| Tetraplegia | 45.7 (193) | 50.9 (87) | 42.2 (106) | |
| Paraplegia | 54.3 (229) | 49.1 (84) | 57.8 (145) | |
| Years since injury - M(SD) | 18.9 (14.9) | 15.9 (12.8) | 20.9 (15.9) | < 0.001 |
| Culturally - Related Factors3 | ||||
| Experience of Discrimination - % ever(n) |
34.1 (144) | 46.8 (80) | 25.5 (64) | <0.0001 |
| Communication with provider - % > 4(n) | 32.5 (137) | 28.7 (49) | 35.1 (88) | 0.17 |
| Health Literacy - % > 10(n) | 58.3 (246) | 48.0 (82) | 65.3 (164) | <0.001 |
| Perceived Racism - M(SD) | 2.4 (0.8) | 2.6 (0.8) | 2.3 (0.7) | <0.0001 |
| Healthcare System Distrust - M(SD) | 2.5 (0.6) | 2.5 (0.7) | 2.5 (0.6) | 0.97 |
| Psychosocial Factors – M(SD)4 | ||||
| Self-esteem | 3.1 (0.5) | 3.2 (0.4) | 3.1 (0.5) | 0.02 |
| Mastery | 2.9 (0.5) | 2.9 (0.5) | 2.9 (0.5) | 0.59 |
| Anxiety | 1.4 (0.6) | 1.3 (0.5) | 1.4 (0.6) | 0.02 |
| Depression | 3.1 (0.5) | 1.4 (0.6) | 1.6 (0.8) | <0.01 |
Note:
Independent samples t-test was performed for continuous variables, chi-square for dichotomous variables or Fisher exact test if appropriate.
Bold items are significant at p ≤ 0.05.
Experience of discrimination (range: 1–6); perceived racism (range: 1–5); healthcare system distrust (range: 1–5); communication with provider (range: 1–5); health literacy (range: 0–11).
Self-esteem (range: 1–4); Mastery (range: 1–4); Anxiety (range: 1–5); Depression (range: 1–5)
AA reported more experiences of discrimination in healthcare, greater perceived racism, and had lower health literacy than did WH (Table 1). There were no racial differences in healthcare system distrust or communication with provider. AA reported higher self-esteem, less anxiety and depression than did WH, but did not differ on mastery.
We compared patient outcomes by race in Table 2. AA reported lower physical QOL and higher mental QOL than did WH. There were no significant differences in satisfaction or participation outcomes.
Table 2.
Comparison of patient satisfaction, quality of life, and participation by race
| Outcome | Total (N=422) |
African American (N=171) |
White (N=251) |
p-value1,2 |
|---|---|---|---|---|
| Satisfaction w/Service – Mean (SD) | 26.7 (5.3) | 26.6 (5.3) | 26.7 (5.4) | 0.89 |
| Quality of Life – Mean (SD) | ||||
| PCS | 44.7 (7.8) | 43.3 (7.9) | 45.6 (7.6) | < 0.01 |
| MCS | 44.3 (15.3) | 46.6 (15.4) | 42.8 (15.1) | 0.01 |
| General Health | 3.0 (1.0) | 3.0 (0.9) | 3.0 (1.0) | 0.96 |
| Participation | ||||
| CHART (binary: >= 100) | ||||
| Physical Independence - % (N) | 31.8 (134) | 26.9 (46) | 35.1 (88) | 0.08 |
| Cognitive Independence - % (N) | 69.2 (292) | 69.6 (119) | 68.9 (173) | 0.88 |
| Mobility - % (N) | 16.6 (70) | 13.5 (23) | 18.7 (47) | 0.15 |
| Occupation - % (N) | 16.4 (69) | 12.9 (22) | 18.7 (47) | 0.10 |
| Social Integration - % (N) | 51.9 (219) | 48.0 (82) | 54.6 (137) | 0.20 |
Independent associations of patient characteristics with satisfaction and QOL outcomes
Our multivariable analysis of patient characteristics with satisfaction and QOL outcomes (Table 3) showed that, although some demographics and medical factors were significantly associated with outcomes, the psychosocial factors were predominant. Significant demographic variables included AA race, which was associated with higher mental QOL; and older age, which was significantly associated with lower physical QOL and general health. Among the medical factors, higher levels of co-morbid conditions were associated with lower physical and mental QOL, as well as lower overall general health. Having more years since injury was associated with higher physical QOL. Among cultural factors, previous experience of discrimination in health care and higher healthcare system distrust were associated with lower levels of satisfaction with service. Further, better communication with providers was associated with higher satisfaction with service and greater physical QOL. Among the psychosocial characteristics, those who reported a higher sense of self-esteem were more likely to have better mental QOL and greater overall general health. Those who reported greater anxiety were more likely to report a lower mental QOL and overall general health. There was a significant interaction of race by anxiety on mental QOL indicating a stronger negative association between anxiety and mental QOL for AA than for WH (Figure 1). We found no other significant relationships in this analysis.
Table 3.
| Factors | Satisfaction] w/Service4 β (95% CI) |
PCS β (95% CI) |
MCS β (95% CI) |
General Health β (95% CI) |
|---|---|---|---|---|
| Demographic | ||||
| Race (AA) | 0.32 (−0.85, 1.38) | −1.36 (−2.80, 0.09) | 7.50* (1.40, 13.61) | −0.11 (−0.28, 0.06) |
| Gender (Female) | NE | NE | NE | NE |
| Age | NE | −0.07* (−0.13, −0.01) | NE | −0.01** (−0.02, −0.00) |
| Ethnicity (Hispanic) | NE | NS | NE | NE |
| Married (Yes) | NE | NE | NE | NE |
| Educational level (≥ Some College) | NE | NE | NS | NE |
| Employment Status (Employed) | NE | NS | NS | NS |
| Family Income (≥$25,000) | NE | NS | NE | NS |
| Insurance (Any Private?) | NE | NS | NE | NE |
| Wheelchair from SCI Center (yes) | NE | NS | NE | NE |
| Medical | ||||
| Co-Morbid Conditions ( >1) | NE | −3.04*** (−4.47, −1.60) | −4.24*** (−6.49, −1.98) | −0.34*** (−0.52, −0.16) |
| Years since injury | NS | 0.06* (0.01, 0.11) | NE | NE |
| Injury Level | NE | NE | NE | NE |
| Tetraplegia vs. Paraplegia | ||||
| Cultural | ||||
| Experience of Discrimination (ever) | −1.76** (−2.86, −0.69) | NE | NE | NS |
| Perceived Racism | MC | NE | NE | NE |
| Healthcare System Distrust | −2.19*** (−3.18, −1.43) | NE | NS | NS |
| Communication with provider (>4) | 1.14** (0.22, 1.72) | 1.66* (0.18, 3.15) | NE | NS |
| Health Literacy (>10) | NE | NE | NE | NE |
| Psychosocial | ||||
| Self-esteem | NE | NE | 9.38*** (6.82, 11.95) | 0.56*** (0.36, 0.75) |
| Mastery | NE | NS | NE | NE |
| Anxiety | NS | NE | −9.52*** (−11.89, −7.15) | −0.30*** (−0.46, −0.14) |
| Depression | NE | NS | NE | NE |
| Interaction | ||||
| Race (AA) x Anxiety | NE | NE | −5.22* (−9.42, −1.03) | NE |
Note:
Significant at *p≤.05; **p≤.01; ***p≤.001; all variables were checked for inter-correlation before being included in the final model.
The data presented in each column corresponding to a particular outcome lists only the variables that were included in the model for a particular outcome.
NE = not included because of non-significant bivariate correlations; MC = removed from final model because of multi-collinearity; NS = removed from final model because the variable was not significantly related to the outcome.
Due to a skewed distribution for satisfaction, we applied the bootstrap method of analysis.
Figure 1.

The Effect of Race by Anxiety on Mental QOL
Independent associations of patient characteristics and CHART outcomes
Results of our multivariable analysis of patient characteristics and CHART outcomes (Table 4) demonstrated that several demographic and medical factors, but few cultural and psychosocial factors, were significantly associated with CHART outcomes. Specifically, AA race was associated with lower physical independence. Younger age was associated with greater physical independence, greater mobility, better occupational functioning, and higher social integration. Married Veterans were less physically independent, but had greater mobility and were more socially integrated. Participants who had some college or were employed were more likely to have better occupational functioning than those who had less college or were unemployed. Finally, Veterans with higher income were more likely to be socially integrated than those with lower income.
Table 4:
| Factors | Physical Independence OR (95% CI) |
Cognitive Independence OR (95% CI) |
Mobility OR (95% CI) |
Occupation OR (95% CI) |
Social Integration OR (95% CI) |
|---|---|---|---|---|---|
| Demographic | |||||
| Race (AA) | 0.51** (0.31, 0.84) | 0.79 (0.49, 1.28) | 0.74 (0.40, 1.35) | 1.00 (0.54, 1.85) | 0.81 (0.49, 1.35) |
| Gender (Female) | NS | NE | NS | NS | NS |
| Age | 0.98* (0.96, 1.00) | NE | 0.95*** (0.93, 0.97) | 0.96*** (0.93, 0.98) | 0.96*** (0.94, 0.98) |
| Ethnicity (Hispanic) | NE | NE | NE | NE | NE |
| Married (Yes) | 0.51** (0.31, 0.85) | NE | 2.76** (1.51, 5.06) | NE | 5.46*** (3.09, 9.63) |
| Educational level (≥ Some College) | NE | NE | NS | 2.13* (1.10, 4.12) | NS |
| Employment Status (Employed) | NS | NE | NS | 3.70*** (1.77, 7.73) | NS |
| Family Income (≥$25,000) | NE | NE | NS | NS | 1.71* (1.02, 2.87) |
| Insurance (Any Private?) | NE | NE | NS | NS | NS |
| Wheelchair from SCI Site (yes) | NE | NS | NE | NE | NE |
| Medical | |||||
| Co-Morbid Conditions ( >1) | 0.60* (0.37, 0.98) | 0.62* (0.39, 0.98) | NS | NS | NE |
| Years since injury | NE | 1.02** (1.01, 1.04) | NE | NE | NE |
| Injury Level | |||||
| Tetraplegia vs. Paraplegia | 0.26*** (0.16, 0.42) | NE | 0.35** (0.19, 0.65) | 0.33*** (0.18, 0.61) | NE |
| Cultural | |||||
| Experience of Discrimination (ever) | NE | NE | NE | NE | NE |
| Perceived Racism | NE | NE | NE | NE | NE |
| Healthcare System Distrust | NE | NE | NE | NE | NE |
| Communication with provider (>4) | NS | NE | NS | NS | NE |
| Health Literacy (>10) | NE | NE | NE | NS | NE |
| Psychosocial | |||||
| Self-esteem | MC | 2.27*** (1.40, 3.69) | MC | MC | 3.34*** (1.66, 6.72) |
| Mastery | 2.58*** (1.57, 4.26) | MC | 1.84*** (2.68, 8.76) | NS | MC |
| Anxiety | NE | NS | MC | NE | NE |
| Depression | NE | MC | NS | NE | NE |
| Interaction | |||||
| Race (AA) x Self-esteem | NE | NE | NE | NE | 0.22** (0.07, 0.70) |
Note:
The OR denotes the odds of less disability; significant at *p≤.05; **p≤.01; ***p≤.001; all variables were checked for intercorrelation before being included in the final model.
The data presented in each column corresponding to a particular outcome lists only the variables that were included in the model for a particular outcome.
NE = not included because of non-significant bivariate correlations; MC = removed from final model because of multicollinearity; NS = removed from final model because the variable was not significantly related to the outcome.
Among medical factors, having one or more co-morbid condition was associated with lower physical and cognitive independence. More years since injury was associated with higher cognitive independence. Having tetraplegia was associated with lower physical independence, mobility or occupational functioning than those with paraplegia. No cultural factors were associated with CHART outcomes. Among the psychosocial characteristics, higher self-esteem was associated with greater cognitive independence and more social integration. A greater sense of mastery was associated with more physical independence and greater mobility. We also identified a significant race by self-esteem interaction for social integration (Figure 2). Having higher self-esteem was associated with better social integration in WH, but not AA Veterans.
Figure 2.
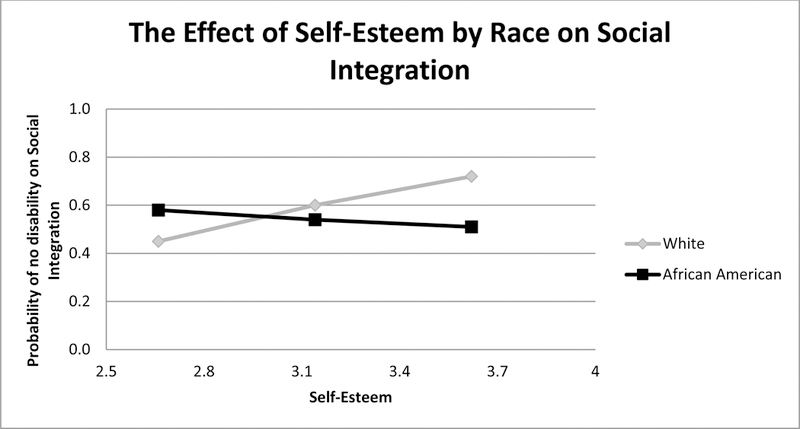
The Effect of Self-Esteem by Race on CHART Social Integration
DISCUSSION
Ours was the first study to examine the association of Veterans’ demographic, medical, cultural, and psychosocial factors with QOL outcomes across several VAMCs. The first goal of our study was to compare AA and WH Veterans with SCI on demographic, medical, cultural, and psychosocial factors. Confirming work in community-dwelling and other healthcare populations,54–58 we found that AA Veterans with SCI were less likely to be married, had significantly less education, lower levels of employment, lower total family income, and were less likely to have private insurance compared to WH. As found in other healthcare populations,18–21, 23, 24, 27, 37, 59–62 AA Veterans reported more experiences of discrimination in healthcare, greater perceived racism, and lower health literacy than did WH Veterans. Confirming previous research, AA in our sample reported higher self-esteem 63 and less anxiety,64 than did WH, but in contrast to others’ research65 they reported less depression.
The results of our study’s second goal showed that AA reported lower physical QOL, but higher mental QOL than did WH. Although these differences were statistically significant, and confirmed previous work,2–7 the magnitude of the difference was less than half a standard deviation, and thus may not be clinically meaningful.66
For our study’s final goal, we found that race rarely remained a significant predictor of SCI patient outcomes once other demographic, cultural, and psychosocial factors were considered in the analysis. Instead, while cultural and psychosocial factors were the predominant variables associated with patients’ satisfaction with service and QOL outcomes, demographic and medical factors were predominantly associated with CHART outcomes. We believe these results may be due to the different aspects of patient outcomes that each of the measures captures. Specifically, the CHART outcomes mostly focus on things people do, and are closely tied with patients’ demographic and medical characteristics. In contrast, patients’ satisfaction with service and their global perceptions of quality of life, are more psychologically-based experiences and more closely linked with their psychosocial assets such as mastery and selfesteem, as well as their psychosocial challenges such as anxiety or depression. These results contrast with our previous work that showed that higher levels of perceived discrimination and racism and better communication with health care providers were associated with an increase in participation and functioning and improvements in perceptions of well-being.37 However, they corroborate other research showing a positive association between perceived discrimination and racism with lower patient satisfaction, and high self-esteem, lower anxiety and depression with greater QOL.18, 21, 23, 26, 28, 67–70 Our interaction analyses, which showed a stronger negative association between anxiety and mental QOL for AA, and that higher self-esteem was associated with better social integration in WH, indicates that a targeted approach to improving outcomes in Veteran wheelchair users with SCI is advisable.
Study Limitations
The data were collected cross-sectionally, therefore conclusions cannot be drawn about causal relationships among the patient characteristics, QOL, satisfaction, and participation outcomes. Future work should test the robustness of the findings with a prospective design. Although we attempted to collect data from a diverse sample at multiple sites, the study was limited to comparisons between AA and WH participants because of too few other racial/ethnic group members in our sample. Given the changing national landscape, it would be important that future research include large enough samples representing the growing Hispanic and Asian populations in the US to be able to statistically test for differences across these racial/ethnic groups. Finally, this information may not be generalizable beyond the Veteran population with SCI. It would be important to determine whether the results found for this Veteran sample exist in non-VA medical centers in future research.
Conclusions
Ours was the first large-scale multi-site cohort study of Veterans with SCI to determine the association of race with quality of life and other patient outcomes. Given that demographic, medical, and psychosocial factors were differentially associated with patient outcomes, it is important that the VA uses a patient-centered approach in their care. We believe that attempts to improve the outcomes of Veterans with SCI should focus on a tailored approach that emphasizes patients’ assets (e.g., building their sense of self-esteem or increasing their feelings of mastery), while providing services targeted to their specific limitations (e.g., reducing depression and anxiety), and that this targeted approach may need to be tailored differently to WH and AA Veterans.
Supplementary Material
Abbreviations
- AA
African American
- CHART SF
Craig Handicap Assessment and Reporting Technique Short Form
- MCS
Mental Component Summary
- PCS
Physical Component Summary
- QOL
quality of life
- SCI
spinal cord injury
- SES
socioeconomic status
- VA
Veterans Affairs
- WH
white
REFERENCES
- 1.National Spinal Cord Injury Statistical Center. Spinal Cord Injury Facts & Figures at a Glance 2008. Available: www.spinalcord.uab.edu. Accessed 04/20/09.
- 2.Gary KW, Nicholls E, Shamburger A, et al. Do racial and ethnic minority patients fare worse after SCI? A critical review of the literature. Neurorehabilitation 2011;29(3):275–293. [DOI] [PubMed] [Google Scholar]
- 3.Jackson A, Dijkers M, Devivo M, et al. A demographic profile of new traumatic spinal cord injuries: change and stability over 30 years. Arch Phys Med Rehabil 2004;85(11):1740–1748. [DOI] [PubMed] [Google Scholar]
- 4.Krause J, Broderick L. Outcomes after spinal cord injury: comparisons as a function of gender and race and ethnicity. Archives of Physical Medicine and Rehabilitation 2004;85(3):355–362. [DOI] [PubMed] [Google Scholar]
- 5.Krause J, Broderick L, Saladin L, et al. Racial disparities in health outcomes after spinal cord injury: mediating effects of education and income. J Spinal Cord Med 2006;29(1):17–25. [DOI] [PMC free article] [PubMed] [Google Scholar]
- 6.Krause J, Saladin L, Adkins R. Disparities in subjective well-being, participation, and health after spinal cord injury: a 6-year longitudinal study. NeuroRehabilitation 2009;24(1):47–56. [DOI] [PubMed] [Google Scholar]
- 7.Lad SP, Umeano OA, Karikari IO, et al. Racial disparities in outcomes after spinal cord injury. Journal of Neurotrauma 2013;30(6):492–497. [DOI] [PubMed] [Google Scholar]
- 8.Cardenas D, Bryce T, Shem K, et al. Gender and minority differences in the pain experience of people with spinal cord injury. Arch Phys Med Rehabil 2004;85(11):1774–1781. [DOI] [PubMed] [Google Scholar]
- 9.Chen Y, Devivo M, Jackson A. Pressure ulcer prevalence in people with spinal cord injury: age-period-duration effects. Arch Phys Med Rehabil 2005;86(6):1208–1213. [DOI] [PubMed] [Google Scholar]
- 10.Fuhrer M, Garber S, Rintala D, et al. Pressure ulcers in community-resident persons with spinal cord injury: prevalence and risk factors. Arch Phys Med Rehabil 1993;74(11):1172–1177. [PubMed] [Google Scholar]
- 11.Saladin L, Krause J. Pressure ulcer prevalence and barriers to treatment after spinal cord injury: comparisons of four groups based on race-ethnicity. NeuroRehabilitation 2009;24(1):57–66. [DOI] [PubMed] [Google Scholar]
- 12.Fyffe DC, Deutsch A, Botticello AL, et al. Racial and ethnic disparities in functioning at discharge and follow-up among patients with motor complete spinal cord injury. Archives of Physical Medicine and Rehabilitation 2014;95(11):2140–2151. [DOI] [PMC free article] [PubMed] [Google Scholar]
- 13.Saunders LL, Gregory-Bass R, Krause JS. Gender, race, pain, and subjective well-being of adults with spinal cord injury. Journal of Health Care for the Poor & Underserved 2013;24(3):1257–1265. [DOI] [PubMed] [Google Scholar]
- 14.Johnston M, Diab M, Kim S, et al. Health literacy, morbidity, and quality of life among individuals with spinal cord injury. Journal of Spinal Cord Medicine 2005;28(3):230–240. [DOI] [PubMed] [Google Scholar]
- 15.Kemp B, Krause J, Adkins R. Depression among African Americans, Latinos, and Caucasians with Spinal Cord Injury: An Exploratory Study. Rehabilitation Psychology 1999;44(3):235–247. [Google Scholar]
- 16.Krause J, Kemp B, Coker J. Depression after spinal cord injury: relation to gender, ethnicity, aging, and socioeconomic indicators. Arch Phys Med Rehabil 2000;81(8):1099–1109. [DOI] [PubMed] [Google Scholar]
- 17.Krause J, Kewman D, Devivo M, et al. Employment after spinal cord injury: an analysis of cases from the Model Spinal Cord Injury Systems. Arch Phys Med Rehabil 1999;80(11):1492–1500. [DOI] [PubMed] [Google Scholar]
- 18.Bird ST, Bogart LM, Delahanty DL. Health-related correlates of perceived discrimination in HIV care. AIDS Patient Care and STDs 2004;18(1):19–26. [DOI] [PubMed] [Google Scholar]
- 19.Bogart LM, Bird ST. Exploring the relationship of conspiracy beliefs about HIV/AIDS to sexual behaviors and attitudes among African-American adults. Journal of the National Medical Association 2003;95(11):1057–1065. [PMC free article] [PubMed] [Google Scholar]
- 20.Boulware LE, Ratner LE, Ness PM, et al. The contribution of sociodemographic, medical, and attitudinal factors to blood donation among the general public. Transfusion 2002;42:669–678. [DOI] [PubMed] [Google Scholar]
- 21.Burgess DJ, Ding Y, Hargreaves M, et al. Relationship between perceived discrimination and unmet physical and mental healthcare needs in a multi-ethnic community sample. Journal of Health Care for the Poor and Underserved 2008;19(3):894–911. [DOI] [PubMed] [Google Scholar]
- 22.Casagrande SS, Gary TL, LaVeist TA, et al. Perceived discrimination and adhrerence to medical care in a racially integrated community. Journal of General Internal Medicine 2007;233(3):389–395. [DOI] [PMC free article] [PubMed] [Google Scholar]
- 23.Paradies Y A systematic review of empirical research on self-reported racism and health. International Journal of Epidemiology 2006;35:888–901. [DOI] [PubMed] [Google Scholar]
- 24.Trivedi A, Ayanian J. Perceived discrimination and use of preventive health services. Journal of General Internal Medicine 2006;21(6):553. [DOI] [PMC free article] [PubMed] [Google Scholar]
- 25.Finnegan JR, Meischke H, Zapka JG, et al. Patient delay in seeking care for heart attack symptoms: Findings from focus groups conducted in five US regions. Preventive Medicine 2000;31:205–213. [DOI] [PubMed] [Google Scholar]
- 26.LaVeist TA, Nickerson KJ, Bowie JV. Attitudes about racism, medical mistrust, and satisfaction with care among African-American and White cardiac patients. Medical Care Research & Review 2000;57(Suppl 1):146–161. [DOI] [PubMed] [Google Scholar]
- 27.Bird ST, Bogart LM. Perceived race-based and socioeconomic status (SES)-based discrimination in interactions with health care providers. Ethnicity and Disease 2001;11:554–563. [PubMed] [Google Scholar]
- 28.Krieger N Discrimination and health. In Berkman L, Kawachi I, (Eds). Social Epidemiology Oxford: Oxford University Press; 2000:36–75. [Google Scholar]
- 29.Myaskovsky L, Doebler D, Posluszny D, et al. Perceived discrimination predicts longer time to be accepted for kidney transplant. Transplantation, “Editor’s Pick” 2012;93(4):423–429. [DOI] [PMC free article] [PubMed] [Google Scholar]
- 30.Williams DR, Yu Y, Jackson JS, et al. Racial differences in physical and mental health: Socio-economic status, stress, and discrimination. Journal of health psychology 1997;2(3):335–351. [DOI] [PubMed] [Google Scholar]
- 31.Davis TC, Long SW, Jackson RH, et al. Rapid estimate of adult literacy in medicine: A shortened screening instrument. Family Medicine 1993;25(6):391–395. [PubMed] [Google Scholar]
- 32.Dew MA, Myaskovsky L, Switzer GE, et al. Profiles and predictors of the course of psychological distress across four years after heart transplantation. Psychological Medicine 2005;35:1215–1227. [DOI] [PubMed] [Google Scholar]
- 33.Switzer GE, Dew MA, Harrington DJ, et al. Ethnic differences in donation-related characteristics among potential hematopoietic stem cell donors. Transplantation 2005;80(7):890–896. [DOI] [PubMed] [Google Scholar]
- 34.Wallston KA. Overview of the special issue on research with the Multidimensional Health Locus of Control (MHLC) Scales. Journal of health psychology 2005;10(5):619–621. [DOI] [PubMed] [Google Scholar]
- 35.Bean-Mayberry B, Chang C-C, Scholle SH. Lack of a race effect in primary care ratings among women veterans. Journal of General Internal Medicine 2005;21:1105–1108. [DOI] [PMC free article] [PubMed] [Google Scholar]
- 36.Parchman ML, Noel PH, Lee S. Primary care attributes, health care system hassles, and chronic illness. Medical Care 2005;43(11):1123–1129. [DOI] [PubMed] [Google Scholar]
- 37.Myaskovsky L, Burkitt KH, Lichy AM, et al. The association of race, cultural factors, and health-related quality of life in persons with spinal cord injury. Archives of Physical Medicine and Rehabilitation 2011;92(3):441–448. [DOI] [PubMed] [Google Scholar]
- 38.Kilbourne A, Switzer GE, Hyman KB, et al. Advancing health disparities research within the health care system: a conceptual framework. American Journal of Public Health 2006;96(12):2113–2121. [DOI] [PMC free article] [PubMed] [Google Scholar]
- 39.Shea JA, Micco E, Dean LT, et al. Development of a revised Healthcare System Distrust scale. Journal of general internal medicine 2008;23(6):727–732. [DOI] [PMC free article] [PubMed] [Google Scholar]
- 40.Flocke SA. Measuring attributes of primary care: Development of a new instrument. The Journal of Family Practice 1997;45(1):64–74. [PubMed] [Google Scholar]
- 41.Bass PF, Wilson JF, Griffith CH. A shortened instrument for literacy screening. Journal of General Internal Medicine 2003;18:1036–1038. [DOI] [PMC free article] [PubMed] [Google Scholar]
- 42.Derogatis L, Spencer P. The Brief Symptom Inventory (BSI): Administration, Scoring, and Procedures Manual. Clinical Psychometric Research Baltimore, MD: 1975. [Google Scholar]
- 43.Rosenberg M Society and the adolescent self image Princeton, NJ: Princeton University Press; 1965. [Google Scholar]
- 44.Pearlin L, Schooler C. The structure of coping. Journal of Health and Social Behavior 1978;19:2–21. [PubMed] [Google Scholar]
- 45.Larsen D, Attkinson C, Hargreaves W, et al. Assessment of client/patient satisfaction: Development of a general scale. Evaluation and Program Planning 1979;2:197–207. [DOI] [PubMed] [Google Scholar]
- 46.Jones D, Kazis L, Lee A, et al. Health status assessments using the Veterans SF-12 and SF-36: Methods for evaluating outcomes in the Veterans Health Administration. Journal of Ambulatory Care Management 2001;24(3):68–86. [DOI] [PubMed] [Google Scholar]
- 47.Kazis LE, Selim A, Rogers W, et al. Dissemination of methods and results from the Veterans Health Study. Journal of Ambulatory Care Management 2006;29(4):310–319. [DOI] [PubMed] [Google Scholar]
- 48.Hays R, Prince-Embury S, Chen H. RAND-36 Health Status Inventory San Antonio, TX: The Psychological Corporation; 1998. [Google Scholar]
- 49.Dudley-Javoroski S, Shields RK. Assessment of physical function and secondary complications after complete spinal cord injury. Disability and Rehabilitation 2006;28(2):103–110. [DOI] [PMC free article] [PubMed] [Google Scholar]
- 50.Whiteneck G, Brooks C, Charlifue S, et al. Guide for Use of the CHART: Craig Handicap Assessment and Reporting Technique Englewood, CO: Craig Hospital 1992. [Google Scholar]
- 51.Magasi SR, Heinemann AW, Whiteneck GG. Participation following traumatic spinal cord injury: An evidence-based review for research (Report on the National Institute on Disability and Rehabilitation Research Spinal Cord Injury Measures Meeting). The Journal of Spinal Cord Medicine 2008;31(2):145–156. [DOI] [PMC free article] [PubMed] [Google Scholar]
- 52.Sander AM, Pappadis MR, Davis LC, et al. Relationship of race/ethnicity and income to community integration following traumatic brain injury: Investigation in a non-rehabilitation trauma sample. NeuroRehabilitation 2009;24(1):15–27. [DOI] [PubMed] [Google Scholar]
- 53.Tabachnick BG, Fidell LS, (Eds). Using Multivariate Statistics Boston, MA: Allyn and Bacon; 2007. [Google Scholar]
- 54.Arango-Lasprilla J, Ketchum J, Francis K, et al. Influence of race/ethnicity on divorce/separation 1, 2, and 5 years post spinal cord injury. Arch Phys Med Rehabil 2009;90(8):1371–1378. [DOI] [PubMed] [Google Scholar]
- 55.Arango-Lasprilla J, Ketchum J, Stevens L. Ethnicity/racial differences in employment outcomes following spinal cord injury. NeuroRehabilitation 2009;24(1):37–46. [DOI] [PubMed] [Google Scholar]
- 56.Carlson D, Ehrlich N. Source of payment for assistive technology: findings from a national survey of persons with disabilities. Assistive Technology 2006;18(1):77–86. [DOI] [PubMed] [Google Scholar]
- 57.Cerdá M, Tracy M, Ahern J, et al. Addressing Population Health and Health Inequalities: The Role of Fundamental Causes. American Journal of Public Health 2014;104(S4):S609–S619. [DOI] [PMC free article] [PubMed] [Google Scholar]
- 58.Fiscella K, Franks P, Gold M, et al. Inequality in quality: Addressing socioeconomic, racial, and ethnic disparities in health care. JAMA 2000;283(19):2579–2584. [DOI] [PubMed] [Google Scholar]
- 59.Department of Veterans Affairs. VA and Spinal Cord Injury Fact Sheet Available: http://www.va.gov/opa/publications/factsheets.asp. Accessed 8/11/2016.
- 60.Landrine H, Klonoff EA. Cultural diversity and health psychology. In Baum A, Revenson T, Singer J, (Eds). Handbook of Health Psychology Mahwah, NJ: Lawrence Erlbaum Associates; 2001:851–891. [Google Scholar]
- 61.Mays VM, Ponce NA, Washington DL, et al. Classification of race and ethnicity: Implications for public health. Annual Review of Public Health 2003;24:83–110. [DOI] [PMC free article] [PubMed] [Google Scholar]
- 62.Williams DR, Mohammed SA. Discrimination and racial disparities in health: Evidence and needed research. J Behav Med 2009;32:20–47. [DOI] [PMC free article] [PubMed] [Google Scholar]
- 63.Gray-Little B Factors influencing racial comparison of self-esteem: A quantitative review. Psychological Bulletin 2000;126(1):26–54. [DOI] [PubMed] [Google Scholar]
- 64.Asnaani A, Richey JA, Dimaite R, et al. A cross-ethnic comparison of lifetime prevalence rates of anxiety disorders. Journal of Nervous and Mental Disorders 2010;198(8):551–555. [DOI] [PMC free article] [PubMed] [Google Scholar]
- 65.Dunlop DD, Song J, Lyons JS, et al. Racial/ethnic differences in rates of depression among preretirement adults. American Journal of Public Health 2003;93(11):1945–1952. [DOI] [PMC free article] [PubMed] [Google Scholar]
- 66.Norman GR, Sloan JA, Wyrwich KW. Interpretation of changes in health-related quality of life: The remarkable universality of half a standard deviation. Medical Care 2003;41(5):582–592. [DOI] [PubMed] [Google Scholar]
- 67.Agency for Healthcare Research and Quality. National Healthcare Quality & Disparities Reports Available: http://www.ahrq.gov/research/findings/nhqrdr/index.html Accessed 12/2/2014.
- 68.Bird ST, Bogart LM. Perceived race-based and socioeconomic status(SES)-based discrimination in interactions with health care providers. Ethnicity & disease 2001;11(3):554–563. [PubMed] [Google Scholar]
- 69.Krieger N Does racism harm health? Did child abuse exist before 1962? On explicit questions, critical science, and current controversies: An ecosocial perspective. american Journal of Public Health 2003;21:194–199. [DOI] [PMC free article] [PubMed] [Google Scholar]
- 70.Williams DR. Race and health: Basic questions, emerging directions. Annals of Epidemiology 1997;7:322–333. [DOI] [PubMed] [Google Scholar]
Associated Data
This section collects any data citations, data availability statements, or supplementary materials included in this article.