Abstract
Premise of the Study
Phloem‐limited diseases are becoming increasingly pervasive, threatening the existence of crops worldwide. Studies of phloem diseases are complicated by the inaccessibility of the phloem tissue. Phloem cells are located deep inside the plant body, are interspersed with other cell types, are among the smallest cells in the plant kingdom, and make up a small percentage of the total cell population in a plant. These properties make phloem cells difficult to investigate.
Methods
We used leaf midrib protoplasts and a combination of organelle‐specific dyes including Neutral Red (acidic compartments), MitoTracker Green (mitochondria), Hoechst 3342 (nucleus), and chloroplast autofluorescence. We examined the protoplasts under light and fluorescence microscopy.
Results
When observed using brightfield and fluorescence microscopy, sieve element protoplasts were distinguished by the lack of vacuole and a nucleus, and by containing various mitochondria. Companion cells showed a dense cytoplasm and various small vacuoles. They also revealed their characteristic large nucleus and abundant mitochondria.
Discussion
We present evidence that a combination of organelle‐specific dyes and autofluorescence allows for the identification of sieve elements and companion cell protoplasts from citrus leaf tissue.
Keywords: citrus phloem, companion cells, phloem protoplasts, sieve elements
Phloem‐limited diseases are becoming increasingly pervasive due to the rapid globalization of agricultural systems and to global warming (Bendix and Lewis, 2018). These diseases have resulted in massive crop losses and economic hardships, as evidenced by the virtual collapse of the citrus industry in the state of Florida (Albrecht and Bowman, 2008; Folimonova et al., 2009; Gottwald, 2010) and in Brazil (Coletta‐Filho et al., 2004; Texeira et al., 2005). Both epidemics result from the phloem bacterial disease huanglongbing (HLB or citrus greening). HLB is caused by the unculturable, gram negative, phloem‐limited α‐proteobacterium Candidatus Liberibacter asiaticus (CLas) (Jagoueix et al., 1994; Bové, 2006) and vectored by the Asian citrus psyllid, Diphorina citri (Pelz‐Stelinski et al., 2010; Hall et al., 2013).
Huanglongbing symptoms are variable and present in almost all parts of the plant, including underground organs. A primary characteristic of the disease is the hyperaccumulation of starch in virtually every living cell of the plant including the enucleated sieve elements (SE) (Etxeberria et al., 2009). In addition, SEs are occluded by callose plugs and phloem protein (P‐protein; Achor et al., 2010) epitomizing the drastic metabolic changes brought about by CLas infection. Given that SEs do not have a nucleus, it is difficult to envision any lack of involvement by the companion cell (CC) in the pathogenic response to CLas by the enucleated SE.
As phloem‐limited bacteria (Bové, 2006), CLas has only been observed in sieve elements (Tyler et al., 2009). However, PCR analysis of tissues lacking vasculature (e.g., juice cells, exocarp, and phelloderm) consistently detects a CLas genetic signal imprint (Etxeberria et al., 2016). This and other evidence outlined by Etxeberria et al. (2015, 2016) offer strong evidence of a genetic signal capable of moving intracellularly from the host SE to other cells through subcellular channels that cannot support the movement of bacteria. Consistent with these observations is the presence of CLas peptides in chloroplasts of HLB‐affected citrus trees (Pitino et al., 2018).
Studies of phloem diseases (e.g., cucurbit yellow vine disease, zebra chip disease in potato, corn stunt disease, grapevine yellows disease, and onion yellow dwarf disease; Bendix and Lewis, 2018) are hindered by the almost inaccessible location of the phloem tissue. Phloem cells are commonly found buried inside the plant body and interspersed with storage parenchyma cells (Knoblauch and Oparka, 2012). In addition, phloem cells are among the smallest cells in the plant kingdom and make up less than 1% of the total cell population in a plant (Knoblauch and Oparka, 2012). Together, these properties present a complex research challenge (van Bell, 2003).
In pertinent cases, protoplasts can provide an alternative approach to study the structure and function of phloem cells in isolation. For example, for HLB studies, isolated protoplasts can be used to determine the presence of CLas genetic signal in either CCs and/or SEs by fluorescence in situ hybridization (FISH). If sufficient material is generated, gene expression analysis on CCs can be conducted, conditions that would provide insights into the means of CLas pathogenicity and transmission.
However, fundamental to this notion of isolating phloem cells is the ability to distinguish SEs and CCs within a population of protoplasts. In a previous study, Hafke et al. (2007) were able to generate and identify phloem protoplasts from partially digested Vicia faba internode tissue. In their study, phloem cells were identified by their content of forisomes, a species‐specific protein body, and by the presence of composite SEs, a pair of SEs adjoined by their sieve plate. In the absence of phloem‐specific features, SE and CC identification would be a more difficult task. For this purpose, we aimed at developing a system to allow the distinction of SEs and CCs from the remaining cells. In this article, we present evidence that a combination of organelle‐specific dyes and autofluorescence allows for the identification of SE and CC protoplasts from citrus leaf tissue.
Materials and methods
Plant material
Fully expanded leaves were collected from 2‐yr‐old healthy sweet orange (Citrus sinensis (L.) Osbeck) ‘Hamlin’ or ‘Valencia’ trees grown in a greenhouse. Leaves were placed in plastic bags and brought to the laboratory.
Tissue preparation and protoplast isolation
Leaves were washed, and most blade tissue excised and discarded. A longitudinal cut was made along the remaining midrib and secondary veins to fully expose the vascular tissue. Midrib halves were cut into smaller pieces of approximately 1 mm in length. Approximately 1 g of the chopped tissue was incubated overnight in a 125‐mL Erlenmeyer flask containing 11 mL of a cellular digestion solution. The digestion solution was prepared according to previously described procedures (Grosser and Gmitter, 1990) and contained 3 mL of enzyme solution (2% cellulase and 2% macerozyme dissolved in 0.9 M mannitol) mixed with 8 mL of 0.6 M BH3 (see Grosser and Gmitter, 1990 for detailed composition). The flask was placed in a rotary shaker and incubated overnight at 30 rpm and 28°C. The protoplast mixture was passed through a 200‐μm nylon mesh, and the resulting solution transferred to a 15‐mL centrifuge tube. The mixture was kept undisturbed for about 20 min to allow the protoplasts to settle to the bottom of the conical tube. The supernatant was discarded except for the bottom 2 mL containing the protoplasts.
Staining
All stains used were organelle specific. Stains were initially diluted in 1 mL of protoplast solution before gently mixing with an equal volume containing the protoplasts. The 1 mL protoplast solution contained: 30 μL of 20 mM Hoechst 3342 (Ex 361⁄Em 497 nm; Molecular Probes, Eugene, Oregon, USA), 40 μL of 20 μM MitoTracker Green FM (MitoTracker Green M7514 Ex 490/Em 516 nm; Molecular Probes), and 40 μL of a 4 mM stock solution Neutral Red (Dubrovsky et al., 2006). Once both solutions were combined, the final concentrations were: Hoechst 0.15 μM, 100 nM MitoTracker, and 80 μM Neutral Red. The protoplast/stain mixture was incubated for 15 min. After the incubation period, 10 μL of protoplast mixture were placed on a microscope slide and carefully covered with a cover slip. The entire procedure was carried out 11 times.
Microscopy
Microscopic observations were made using a Carl Zeiss Axio Scope A1 fluorescence microscope (Carl Zeiss Microscopy GmbH, Gottingen, Germany) equipped with a Zeiss Axio Cam ICc1, with filter Set 43 or Rhodamine filter from Carl Zeiss Microscopy GmbH (Ex: BP 545/25, Em: BP 525/50) for red and green fluorescence (vacuole and mitochondria), and a DAPI filter or the Zeiss Filter set 49 (Ex: G365, Em: BP 445/50) for blue fluorescence (nucleus).
Results and discussion
Phloem cells possess distinctive anatomical and physiological properties that can be systematically exploited for their identification within a population of protoplasts. For example, compared to the surrounding living cells, SEs are enucleated, possess no vacuoles, and contain only a small number of organelles (van Bell, 2003). The reduced number of organelles include mitochondria, plastids, and stacked smooth endoplasmic reticulum (Knoblauch and Oparka, 2012) characteristically located at the parietal region (Heo et al., 2017) and anchored to the plasmalemma (Lalonde et al., 2001; Ohtani et al., 2017). In contrast, CCs have abundant mitochondria, a distinctively large nucleus (Lalonde et al., 2001), and, in Citrus, several smaller vacuoles (Aritua et al., 2013). Additionally, both types of phloem cells are among the smallest cells in the plant body (Knoblauch and Oparka, 2012). Parenchyma cells of the cortex and pith regions are much larger and possess a sizable vacuole, whereas mesophyll cells also contain abundant chloroplasts.
In the present investigation, protoplasts were generated from mature citrus leaf tissue incubated overnight in cell wall hydrolytic media. Considering that phloem cells are located within the vascular veins, we removed as much leaf blade tissue as possible from the larger veins. After overnight incubation, we obtained a mixed population of protoplasts of different cell types. It must be stressed that maximizing protoplast production, and consequently percent of phloem cells, is a separate experimental objective not considered here that is dependent on many factors such as plant species, type of tissue, and environmental conditions. Such tissue‐ and species‐specific processes must be developed individually prior to the application of the phloem‐identification method described here. In this investigation, we aimed solely to identify phloem cells within a population of protoplasts.
Central to our working model is the ability to differentiate cellular organelles and structures, either by their physiological autofluorescence or assisted by use of specific brightfield and/or fluorescent dyes. For example, chloroplasts can be identified by their red autofluorescence, mitochondria by using the specific fluorescent mitochondria marker MitoTracker green, and the vacuole by the accumulation of Neutral Red in acidic compartments (Dubrovsky et al., 2006). The presence of a nucleus can be detailed by the nucleic acid–specific, blue‐fluorescent marker Hoechst 3342. Identification (or lack of) of these targeted organelles facilitates recognition of phloem cells. Figure 1 depicts the hypothetical working model of this communication and emphasizes the prominent structures as highlighted by the combination of dyes, autofluorescence, and light filters.
Figure 1.
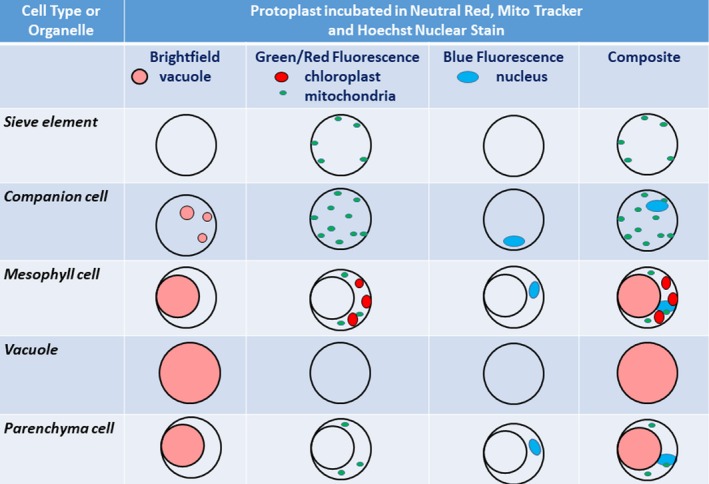
Working model for the identification of sieve elements and companion cell protoplasts using brightfield and fluorescence microscopy. Prominent structures for each cell or cellular compartment are depicted under different light sources, filters, and dyes.
Under brightfield microscopy, we observed cells of a wide range of sizes containing a variety of cell structures. The range of cell types was expected because the midrib (plus a small portion of the adjacent blade) contained, aside from vascular tissue, a mix of cortex parenchyma, pith parenchyma, mesophyll cells, and epidermal cells. A number of free vacuoles were also present in every preparation. In general, the number of SEs and CCs was quite low, agreeing with the results of Hafke et al. (2007). Digestion mixtures, conventionally prepared for isolation of protoplasts from most other tissues, usually fail to protect phloem cells with different osmotic properties. For this and other reasons outlined by Hafke et al. (2007), yield of phloem protoplasts is generally low.
The dominant cell type in all cases was chloroplast‐containing mesophyll cells (Fig. 2). These were easily identified in brightfield microscopy for their “reddish” vacuole (due to Neutral Red stain) and green‐colored plastids (Fig. 2A). Under fluorescent light and green/red filter, chloroplasts appeared red from chlorophyll autofluorescence and a green fluorescent mitochondrial layer (due to MitoTracker) encircled the cell (Fig. 2B). The vacuole appeared mostly translucent, but often had a fluorescent, greenish orange color. This variation in color was ascribed to the location of green fluorescent mitochondria and/or red fluorescent chloroplasts on the distal part of the cell away from the focal plane, creating an artifactual color. The fact that loose vacuoles always appeared red in both brightfield and fluorescent light (see Fig. 3B) is consistent with our contention that in complete protoplasts green fluorescence from MitoTracker overshadowed the red color. However, we cannot exclude the possibility that the slight changes in vacuolar pH affects Neutral Red fluorescence, resulting in green/orange fluorescent vacuoles (Dubrovsky et al., 2006). Mesophyll cells also had a distinguishable blue nucleus when observed under the DAPI filter (Fig. 2C).
Figure 2.
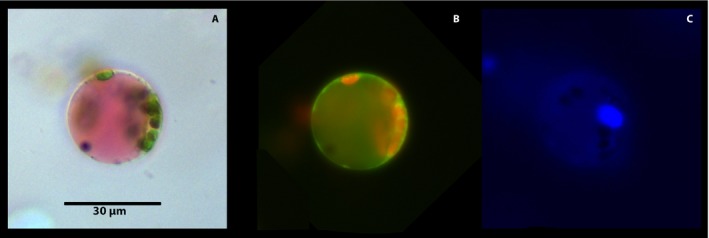
Citrus leaf mesophyll protoplast viewed under different light sources and filters after incubation in 0.15 μM Hoechst 3342, 100 nM MitoTracker, and 80 μM Neutral Red for 15 min. Each cell was viewed under brightfield microscopy (A); fluorescence microscopy (Rhodamine filter; Ex: BP 545/25, Em: BP 525/50) for red and green fluorescence (B); and under DAPI filter (Hoechst 3342; Ex: G365, Em: BP 445/50) for blue fluorescence (C).
Figure 3.
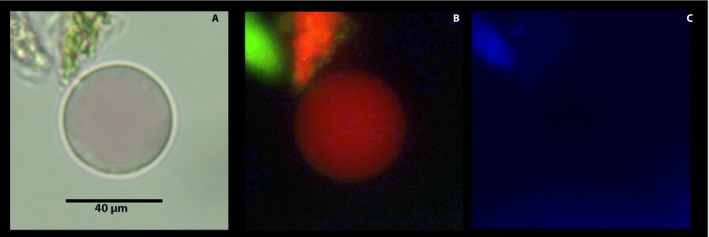
Free vacuole from a population of citrus leaf protoplast viewed under different light sources and filters after incubation in 0.15 μM Hoechst 3342, 100 nM MitoTracker, and 80 μM Neutral Red for 15 min. Vacuole was viewed under brightfield microscopy (A); fluorescence microscopy (Rhodamine filter; Ex: BP 545/25, Em: BP 525/50) for red and green fluorescence (B); and under DAPI filter (Hoechst 3342; Ex: G365, Em: BP 445/50) for blue fluorescence (C).
Non‐photosynthetic parenchyma cells also abound in the midrib area and, consequently, in our protoplast preparations. In general, these cells are located in the interior of the cortex and in the pith. In brightfield microscopy, parenchyma cells contained a large central vacuole surrounded by a cytoplasmic layer and a defined membrane (Fig. 4A). Under fluorescence microscopy, parenchyma cells had a green mitochondrial layer, a vacuole with a green hue (Fig. 4B), and a blue nucleus (Fig. 4C). Consistent with their location, the cells lacked developed chloroplasts, although occasionally small red fluorescent structures were observed, likely representing pro‐plastids with underdeveloped thylakoids (Boardman and Wildman, 1962). It is noteworthy that vacuoles of parenchyma cells did not accumulate Neutral Red to the same levels as those of mesophyll cells, likely reflecting differences in vacuolar pH.
Figure 4.
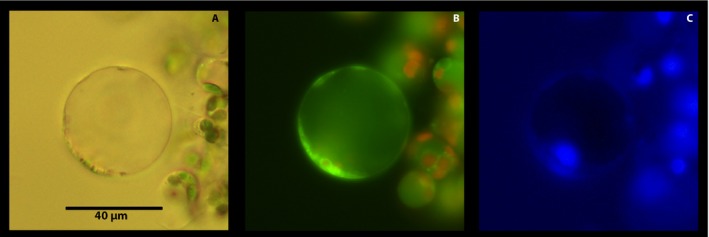
Citrus leaf parenchyma protoplast viewed under different light sources and filters after incubation in 0.15 μM Hoechst 3342, 100 nM MitoTracker, and 80 μM Neutral Red for 15 min. Each cell was viewed under brightfield microscopy (A); fluorescence microscopy (Rhodamine filter; Ex: BP 545/25, Em: BP 525/50) for red and green fluorescence (B); and under DAPI filter (Hoechst 3342; Ex: G365, Em: BP 445/50) for blue fluorescence (C).
A number of free vacuoles were always present in each protoplast preparation. These were distinguished by a distinctively shinier membrane outline under brightfield microscopy (Fig. 3A), a reddish vacuolar content, absence of any additional organelle (Fig. 3B), and lack of nucleus under fluorescence microscopy (Fig. 3C).
In addition to mesophyll, parenchyma cells, and free vacuoles, this system is most useful for the identification of SEs and CCs. It is worth noting that neither SEs nor CCs were particularly abundant in any of our protoplast preparations, consistent with the fact that they are significantly outnumbered by the remaining cell types (Hafke et al., 2007). Hafke et al. (2007) also reported a low number of phloem cells in their preparations of Vicia faba leaf protoplasts. In our preparations, we estimated an approximate average of one SE or CC per 250 protoplasts. Nevertheless, their peculiar properties and small size facilitated their identification, especially during the initial screening.
Sieve elements are enucleated cells that contain no vacuoles (Fig. 5; Appendix S1), but which do have a few organelles such as endoplasmic reticulum and plastids. Although reliant on CCs for most of their metabolic activities, SEs contain few mitochondria at maturity. In agreement with their protoplasmic composition, SEs did not have a distinct organized internal structure (Fig. 5A) with mitochondria located at the periphery despite the absence of a vacuole (Fig. 5B). Given the slightly alkaline pH of the SE milieu (Fukumorita et al., 1983; Hafke et al., 2005), no Neutral Red accumulation was observed. The lack of a nucleus in SEs was confirmed by examining the cells under a DAPI filter (Fig. 5C). To make certain no nucleus was present, we shifted the focal plane from the most proximal to most distant point in the cells.
Figure 5.
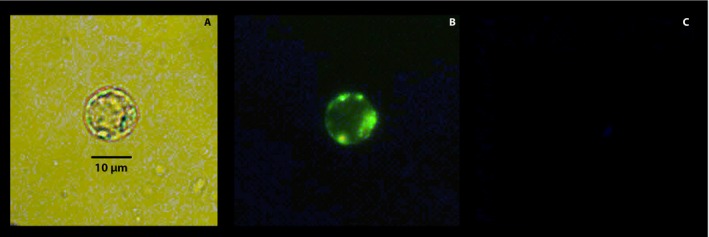
Citrus leaf sieve element protoplast viewed under different light sources and filters after incubation in 0.15 μM Hoechst 3342, 100 nM MitoTracker, and 80 μM Neutral Red for 15 min. Each cell was viewed under brightfield microscopy (A); fluorescence microscopy (Rhodamine filter; Ex: BP 545/25, Em: BP 525/50) for red and green fluorescence (B); and under DAPI filter (Hoechst 3342; Ex: G365, Em: BP 445/50) for blue fluorescence (C).
Companion cells showed a dense cytoplasm and various small vacuoles under brightfield microscopy (Fig. 6A; Appendix S2). They also revealed their characteristic large nucleus and abundant green mitochondria when observed under appropriate fluorescent filters (Fig. 6B, C). The large nucleus and number of mitochondria in CCs are characteristic of their high rates of metabolic activity responsible for providing energy required for transporting sugars and other nutrients (Lalonde et al., 2001). In terms of size, both cells (SE and CC) were at the lower end of the size distribution for the protoplast population. Sieve elements were slightly larger than CCs and agreed with our size estimates based on light micrographs of petiole tissue (Brodersen et al., 2014). Images presented here are of characteristic cell sizes.
Figure 6.

Citrus leaf companion cell protoplast viewed under different light sources and filters after incubation in 0.15 μM Hoechst 3342, 100 nM MitoTracker, and 80 μM Neutral Red for 15 min. Each cell was viewed under brightfield microscopy (A); fluorescence microscopy (Rhodamine filter; Ex: BP 545/25, Em: BP 525/50) for red and green fluorescence (B); and under DAPI filter (Hoechst 3342; Ex: G365, Em: BP 445/50) for blue fluorescence (C).
The use of transgenic citrus plants expressing green fluorescent protein (GFP) in phloem cells (Folimonov et al., 2007) provided morphological verification of our method. Non‐virulent strains of phloem‐specific citrus tristeza virus have produced transgenic citrus plants with GFP‐labeled plasma membranes of the SE‐CC complex (Folimonov et al., 2007). When examined under fluorescence microscopy, phloem cells were easily identified by their fluorescence on a cross section of a petiole (Fig. 7A). A close up corroborated the amphicribral location of the phloem cells just outside the xylem (Fig. 7B). Their characteristic tubular shape was also evident in longitudinal sections of the petiole (Fig. 7C). By virtue of their fluorescence, phloem protoplasts (SE and CC) were easily identified and distinguished from each other by the absence of nucleus in SEs (Fig. 8) and presence in CCs (Fig. 9). Their size and general morphological features corresponded to those identified above by the use of stains (Figs. 5 and 6). It should be noted that the general fluorescence of the plasma membrane concealed the equally green fluorescent mitochondria.
Figure 7.

Citrus phloem tissue transformed with green fluorescent protein (GFP) using citrus tristeza virus as vector. (A) Cross section of a citrus leaf petiole illustrating fluorescent phloem (sieve elements and companion cells) cells. (B) Close up of a separate petiole sample. Phloem cells (P) form an amphicribral ring around the xylem (X). (C) Longitudinal section of a citrus petiole from a citrus tree with GFP‐modified phloem SE and CC (see Folimonov et al., 2007). Tissues were viewed under Rhodamine fluorescence filter (Ex: BP 545/25, Em: BP 525/50) for red and green fluorescence.
Figure 8.

Companion cell protoplast obtained from citrus tristeza virus–vectored green fluorescent protein (GFP)–transformed phloem cells. Both sieve elements and companion cells show GFP fluorescence as described by Folimonov et al. (2007). Each cell was viewed under brightfield microscopy (A); fluorescence microscopy (Rhodamine filter; Ex: BP 545/25, Em: BP 525/50) for red and green fluorescence (B); and under DAPI filter (Hoechst 3342; Ex: G365, Em: BP 445/50) for blue fluorescence (C).
Figure 9.

Companion cell protoplast obtained from citrus tristeza virus–vectored green fluorescent protein (GFP)–transformed phloem cells. Both sieve elements and companion cells show GFP fluorescence as described by Folimonov et al. (2007). Each cell was viewed under brightfield microscopy (A); fluorescence microscopy (Rhodamine filter; Ex: BP 545/25, Em: BP 525/50) for red and green fluorescence (B); and under DAPI filter (Hoechst 3342; Ex: G365, Em: BP 445/50) for blue fluorescence (C).
In this report, we present a simple assay that facilitates the recognition of SEs and CCs within a population of cells (protoplasts). The method is more versatile than that described by Hafke et al. (2007) in that it can be used independently of the presence of an intrinsic phloem‐specific marker. Identification of phloem cells can be used as an additional tool in studies of phloem‐limited diseases, especially when used together with other techniques. For example, in combination with the patch‐clamp technique, protoplasts are ideal to study changes in membrane properties such as ion fluxes, membrane electrical properties, and biophysics of membrane elasticity, a study not possible with intact cells. In addition, identifying phloem cells can help in other areas of phloem physiology, such as characterizing the location of membrane‐bound carriers or channels (e.g., presence of sucrose carriers or ATPases in SEs, CCs, or both by immunohistochemistry and patch‐clamp technique), their location throughout the plant, and their properties depending on their distribution in source or sink tissues.
Supporting information
APPENDIX S1. Citrus leaf sieve element protoplast viewed under different light sources and filters after incubation in 0.15 μM Hoechst 3342, 100 nM MitoTracker, and 80 μM Neutral Red for 15 min. Each cell was viewed under brightfield microscopy (A); fluorescence microscopy (Rhodamine filter; Ex: BP 545/25, Em: BP 525/50) for red and green fluorescence (B); and under DAPI filter (Hoechst 3342; Ex: G365, Em: BP 445/50) for blue fluorescence (C).
APPENDIX S2. Citrus leaf companion cell protoplast viewed under different light sources and filters after incubation in 0.15 μM Hoechst 3342, 100 nM MitoTracker, and 80 μM Neutral Red for 15 min. Each cell was viewed under brightfield microscopy (A); fluorescence microscopy (Rhodamine filter; Ex: BP 545/25, Em: BP 525/50) for red and green fluorescence (B); and under DAPI filter (Hoechst 3342; Ex: G365, Em: BP 445/50) for blue fluorescence (C).
Acknowledgments
This work was supported by U.S. Department of Agriculture–National Institute of Food and Agriculture (USDA‐NIFA) grant 2015‐70016‐23030.
Kaur, P. , Gonzalez P., Dutt M., and Etxeberria E.. 2018. Identification of sieve elements and companion cell protoplasts by a combination of brightfield and fluorescence microscopy. Applications in Plant Sciences 6(9): e1179.
Literature cited
- Achor, D. S. , Etxeberria E., Wang N., Folimonova S. Y., Chung K.‐R., and Albrigo L. G.. 2010. Sequence of anatomical symptom observations in citrus affected with huanglongbing disease. Plant Pathology Journal 9: 56–64. [Google Scholar]
- Albrecht, U. , and Bowman K. D.. 2008. Gene expression in Citrus sinensis (L.) Osbeck following infection with the bacterial pathogen Candidatus Liberibacter asiaticus causing huanglongbing in Florida. Plant Science 175: 291–306. [Google Scholar]
- Aritua, V. , Achor D., Gmitter F. G., Albrigo G., and Wang N.. 2013. Transcriptional and microscopic analyses of citrus stem and root responses to Candidatus Liberibacter asiaticus infection. PLoS ONE 8(9): e73742. [DOI] [PMC free article] [PubMed] [Google Scholar]
- Bendix, C. , and Lewis J. D.. 2018. The enemy within: Phloem‐limited pathogens. Molecular Plant Pathology 19: 238–254. [DOI] [PMC free article] [PubMed] [Google Scholar]
- Boardman, N. K. , and Wildman S. J.. 1962. Identification of proplastids by fluorescence microscopy and their isolation and purification. Biochimica et Biophysica Acta 59: 222–224. [DOI] [PubMed] [Google Scholar]
- Bové, J. M. 2006. Huanglongbing: A destructive, newly‐emerging, century‐old disease in citrus. Journal of Plant Pathology 88: 7–37. [Google Scholar]
- Brodersen, C. , Narciso C., Reed M., and Etxeberria E.. 2014. Phloem production in huanglongbing‐affected citrus trees. HortScience 49: 59–64. [Google Scholar]
- Coletta‐Filho, H. D. , Targon M. L. P. N., Takita M. A., De Negri J. D., Pompeu J. Jr., and Machado M. A.. 2004. First report of the causal agent of huanglongbing (“Candidatus Liberibacter asiaticus”) in Brazil. Plant Disease 88: 1382. [DOI] [PubMed] [Google Scholar]
- Dubrovsky, J. G. , Guttenberger M., Saralegui A., Napsucialy‐Mandivil S., Voight B., Baluska F., and Menzel D.. 2006. Neutral red as a probe for confocal laser scanning microscopy studies of plant roots. Annals of Botany 97: 1127–1138. [DOI] [PMC free article] [PubMed] [Google Scholar]
- Etxeberria, E. , Gonzalez P., Achor D., and Albrigo L. G.. 2009. Anatomical distribution of abnormally high levels of starch in HLB‐affected Valencia orange trees. Physiological and Molecular Plant Pathology 74: 76–83. [Google Scholar]
- Etxeberria, E. , Gonzalez P., and Brodersen C.. 2015. Evidence for an alternative pathway of CLas movement in citrus trees. Proceedings of the Florida State Horticultural Society 128: 73–76. [Google Scholar]
- Etxeberria, E. , Brodersen C., and Gonzalez P.. 2016. Movement of HLB genetic signal within a citrus tree: More questions than answers. Proceedings of the Florida State Horticultural Society 129: 83–86. [Google Scholar]
- Folimonov, A. S. , Folimonova S. Y., Bar‐Joseph M., and Dawson W. O.. 2007. A stable RNA virus‐based vector for citrus trees. Virology 368: 205–216. [DOI] [PubMed] [Google Scholar]
- Folimonova, S. Y. , Robertson C. J., Garnsey S. M., Gowda S., and Dawson W. O.. 2009. Examination of the responses of different genotypes of citrus to huanglongbing (citrus greening) under different conditions. Phytopathology 99: 1346–1354. [DOI] [PubMed] [Google Scholar]
- Fukumorita, T. , Noziri Y., Haraguchi H., and Chino M.. 1983. Inorganic content in rice phloem sap. Soil Science and Plant Nutrition 29: 185–192. [Google Scholar]
- Gottwald, T. R. 2010. Current epidemiological understanding of citrus huanglongbing. Annual Review of Phytopathology 48: 119–139. [DOI] [PubMed] [Google Scholar]
- Grosser, J. W. , and Gmitter F. G.. 1990. Protoplast fusion and citrus improvement In Janick J. [ed.], Plant breeding reviews, 339–374. John Wiley & Sons, New York, New York, USA. [Google Scholar]
- Hafke, J. B. , van Amerongen J.‐K., Kelling F., Furch A. C. U., Gaupels F., and van Bel A. J. E.. 2005. Thermodynamic battle for photosynthate acquisition between sieve tubes and adjoining parenchyma in transport phloem. Plant Physiology 138: 1527–1537. [DOI] [PMC free article] [PubMed] [Google Scholar]
- Hafke, J. B. , Furch A. C. U., Reitz M., and van Bel A. J. E.. 2007. Functional sieve element protoplasts. Plant Physiology 145: 703–711. [DOI] [PMC free article] [PubMed] [Google Scholar]
- Hall, D. G. , Richardson M. L., Ammar E.‐D., and Halbert S. E.. 2013. Asian citrus psyllid, Diaphorina citri, vector of citrus huanglongbing disease. Entomologia Experimentalis et Applicata 146: 207–223. [Google Scholar]
- Heo, J.‐O. , Blob B., and Helariutta Y.. 2017. Differentiation of conductive cells: A matter of life and death. Current Opinion in Plant Biology 35: 23–29. [DOI] [PubMed] [Google Scholar]
- Jagoueix, S. , Bové J. M., and Garnier M.. 1994. The phloem‐limited bacterium of greening disease of the proteobacteria is a member of the alpha subdivision of the proteobacteria. International Journal of Systemic Bacteriology 44: 379–386. [DOI] [PubMed] [Google Scholar]
- Knoblauch, M. , and Oparka K.. 2012. The structure of the phloem–still more questions than answers. Plant Journal 70: 147–156. [DOI] [PubMed] [Google Scholar]
- Lalonde, S. , Franceshi V. R., and Frommer W. B.. 2001. Encyclopedia of life sciences. John Wiley and Sons, New York, New York, USA. [Google Scholar]
- Ohtani, M. , Akiyoshi N., Takenake Y., Sano R., and Demura T.. 2017. Evolution of plant conducting cells: Perspectives from key regulators of vascular cell differentiation. Journal of Experimental Botany 68: 71–78. [DOI] [PubMed] [Google Scholar]
- Pelz‐Stelinski, K. S. , Brlansky R. H., Ebert T. A., and Rogers M. E.. 2010. Transmission parameters for Candidatus Liberibacter asiaticus by Asian citrus psyllid (Hemiptera: Psyllidae). Journal of Economic Entomology 103: 1531–1541. [DOI] [PubMed] [Google Scholar]
- Pitino, M. , Allen V., and Duan Y.. 2018. Las15315 effector induces extreme starch accumulation and chlorosis as Ca. Liberibacter asiaticus infection in Nicotiana benthamiana . Frontiers in Plant Science 9: 113. [DOI] [PMC free article] [PubMed] [Google Scholar]
- Texeira, D. C. , Ayres J., Kitajima E. W., Danet L., Jagoueix‐Eveillard S., Saillard C., and Bové J. M.. 2005. First report of a huanglongbing‐like disease of citrus in São Paulo State, Brazil and association of a new Liberibacter species, “Candidatus Liberibacter americanus”, with the disease. Plant Disease 89: 107. [DOI] [PubMed] [Google Scholar]
- Tyler, H. L. , Roesch L. F. W., Gowda S., Dawson W. O., and Triplett E. W.. 2009. Confirmation of the sequence of ‘Candidatus Liberibacter asiaticus’ and assessment of microbial diversity in huanglongbing‐infected citrus phloem using a metagenomic approach. Molecular Plant‐Microbe Interactions 22: 624–1634. [DOI] [PubMed] [Google Scholar]
- van Bell, A. J. E. 2003. The phloem, a miracle of ingenuity. Plant, Cell and Environment 26: 125–149. [Google Scholar]
Associated Data
This section collects any data citations, data availability statements, or supplementary materials included in this article.
Supplementary Materials
APPENDIX S1. Citrus leaf sieve element protoplast viewed under different light sources and filters after incubation in 0.15 μM Hoechst 3342, 100 nM MitoTracker, and 80 μM Neutral Red for 15 min. Each cell was viewed under brightfield microscopy (A); fluorescence microscopy (Rhodamine filter; Ex: BP 545/25, Em: BP 525/50) for red and green fluorescence (B); and under DAPI filter (Hoechst 3342; Ex: G365, Em: BP 445/50) for blue fluorescence (C).
APPENDIX S2. Citrus leaf companion cell protoplast viewed under different light sources and filters after incubation in 0.15 μM Hoechst 3342, 100 nM MitoTracker, and 80 μM Neutral Red for 15 min. Each cell was viewed under brightfield microscopy (A); fluorescence microscopy (Rhodamine filter; Ex: BP 545/25, Em: BP 525/50) for red and green fluorescence (B); and under DAPI filter (Hoechst 3342; Ex: G365, Em: BP 445/50) for blue fluorescence (C).


