

Abstract
The development and maintenance of tissues requires collective cell movement, during which neighboring cells coordinate the polarity of their migration machineries. Here, we ask how polarity signals are transmitted from one cell to another across symmetrical cadherin junctions, during collective migration. We demonstrate that collectively migrating endothelial cells have polarized VE-cadherin-rich membrane protrusions, “cadherin fingers”, which leading cells extend from their rear and follower cells engulf at their front, thereby generating opposite membrane curvatures and asymmetric recruitment of curvature sensing proteins. In follower cells, engulfment of cadherin fingers occurs along with the formation of a lamellipodia-like zone with low actomyosin contractility, and requires VE-cadherin/catenin complexes and Arp2/3-driven actin polymerization. Lateral accumulation of cadherin fingers in follower cells precedes turning, and increased actomyosin contractility can initiate cadherin finger extension as well as engulfment by a neighboring cell, to promote follower behavior. We propose that cadherin fingers serve as guidance cues that direct collective cell migration.
Introduction
Identification of the mechanisms by which collectively migrating cells coordinate their movement is critical for understanding tissue development, homeostasis, and disease1,2. During collective migration, individual cells typically use their autonomous migration machinery for locomotion, while being connected to their neighbors through adhesive cell-cell interactions. Rather than cells being pulled or pushed along, collective cell guidance therefore requires that neighboring cells coordinate their direction of movement by signaling across cell-cell junctions. Previous studies have shown that vectorial signaling requires mechanical coupling between cells through cadherin-dependent cell-cell junctions3–7. Nevertheless, how symmetric cadherin cell-cell junctions can support asymmetric signal transduction by which one cell can direct the movement of its neighbor is not yet understood.
In stationary epithelial and endothelial tissues, cadherin-dependent cell-cell junctions are smooth and morphologically distinct from serrated cell-cell junctions, also termed discontinuous, punctate, or focal adherens junctions, observed during migration and junction remodeling8–16. These serrated cell-cell junctions result from mechanical tension generated by actomyosin contractility13,17 and have been observed in various endothelial in vitro systems as well as in ex vivo preparations of human endothelial tissues18.
Here we report that serrated endothelial cell-cell junctions between collectively migrating HUVEC are polarized relative to the direction of cell movement. We characterize their formation and structure and show that they represent membrane tubes that point away from the rear of migrating cells and are engulfed by the front of follower cells, with VE-cadherin present at the junction between the two tubular plasma membranes. We termed these engulfed structures “cadherin fingers” to highlight their polarized orientation and structure. Our study suggests that cadherin fingers mediate cell guidance during collective migration.
Results
Collectively migrating endothelial cells orient “cadherin fingers” backwards relative to the direction of movement
We used monolayers of human umbilical vein endothelial cells (HUVEC) as a cell model for collective migration since endothelial cells move fast during vascular morphogenesis and repair and require efficient polarity signaling between them for coordinated movement19,20. Live-cell imaging and automated cell tracking of HUVEC stained with nuclear dye showed random streams and swirls of highly coordinated, collectively migrating subgroups of cells within the monolayer (Figure 1a). The coordination between neighboring cells’ movements, measured as averaged pairwise velocity correlation between each cell in a monolayer and its neighbors (Figure 1b)21,22, was close to random in sub-confluent cultures, increased with increasing cell density, peaked at ~700 cells/mm2, and again decreased at higher densities (Figure 1a, c, Video 1). Cells were primarily coordinated with cells at their front and rear rather than with cells at their sides (Figure 1d, e), arguing that the major coupling mechanism that mediates collective migration is between the rear of leader cells and the front of follower cells. We use the term leader cells both for cells that move into open space and for cells that have followers within a monolayer23.
Figure 1. Collectively migrating endothelial cells orient “cadherin fingers” backwards relative to the direction of movement.
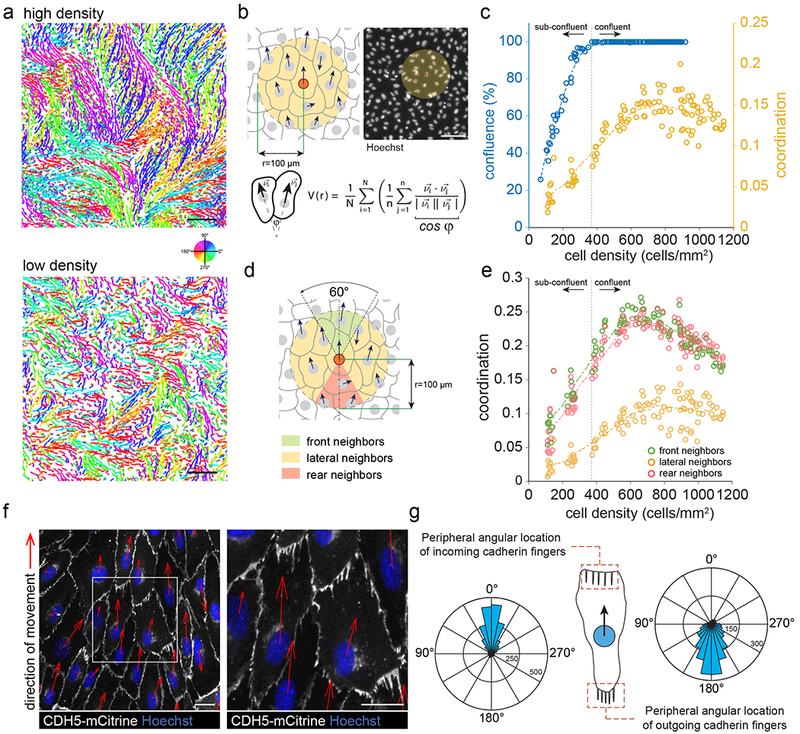
(a) Unperturbed high- and low-density monolayers of HUVEC were stained with nuclear dye (Hoechst), imaged for 4 h at 10 min intervals, and nuclei were automatically tracked. Nuclear trajectories are colored based on the direction of movement. High-density (upper panel), but not low-density monolayers (lower panel) showed streams of highly coordinated cell movement. Scale bars, 250 μm. (b) Averaged pairwise velocity correlation between a given cell and its neighbors within a given radius as a metric for coordinated cell movement (Materials and Methods). Scale bar, 100 μm. (c) Coordinated cell movement and confluence as a function of cell density in unperturbed monolayers. For confluence, individual data points are confluence measured in 20x magnification fields of fixed and Hoechst/phalloidin-stained HUVEC cultures. For coordination, individual data points are averaged coordination measurements each from entire wells of 96-well plates, pooled from three independent experiments. (d) Averaged pairwise velocity correlation similar to (b), but between a cell and separately with its front, lateral, and rear neighbors. (e) Coordination with front, lateral, and rear neighbors as a function of cell density. Individual data points are averaged coordination measurements each from an entire well of a 96-well plate, pooled from three independent experiments. (f) Monolayers of HUVEC stably expressing fluorescently-tagged VE-cadherin (CDH5-mCitrine) were stained with Hoechst, time-lapse sequences were acquired, and the direction of movement of individual cells was determined through automated nuclear tracking (red arrows). Comb-shaped cadherin-positive structures (“cadherin fingers”) pointing away from the rear of cells towards their followers are visible. Scale bars, 20 μm (g) Rose plots of the angular location of incoming and outgoing cadherin fingers along the periphery of cells, relative to the direction of cell movement (Materials and Methods). Data pooled from n=522 cells, from three independent experiments.
We confirmed the presence of smooth and serrated cadherin junctions across a range of cell densities from sub-confluent to densely packed using anti-VE-cadherin antibody (anti-CDH5) (Supplementary Figure 1a). To investigate endothelial cell-cell junctions during migration, we generated HUVEC stably expressing fluorescent protein-conjugated VE-Cadherin (HUVEC-CDH5-mCitrine). Live-cell imaging revealed that collectively migrating HUVEC had serrated as well as smooth cell-cell junctions in the same cell. With respect to the direction of migration, smooth junctions were observed along the lateral cell-boundaries, whereas serrated junctions or cadherin fingers were mostly present in the front and rear (Figure 1f, Video 2). Surprisingly, we found that cadherin fingers exclusively pointed away from the back of migrating cells and overlapped with the front of their followers, i.e. they were polarized with respect to the direction of migration (Figure 1g, Video 2).
We wounded monolayers of HUVEC to determine whether polarized cadherin fingers were also present between leader cells at the wound edge and their followers. We found polarized cadherin fingers pointing from the rear of leader cells away from the wound edge towards the cell monolayer (Supplementary Figure 1b, c). Cadherin fingers were not only oriented in cells at the wound edge, but became oriented away from the wound between internal leader and follower cells hundreds of microns into the cell monolayer (Supplementary Figure 1c). This is consistent with a propagation mechanism whereby cells in a monolayer sequentially polarize each other, thereby promoting collective migration towards a wound, or, in intact monolayers, promote collective streaming behavior (Figure 1a).
Cadherin fingers are double membrane tubes extended from the back of leader cells and engulfed by the front of follower cells
To gain insight into the structural organization of cadherin fingers, we employed 3D structured illumination microscopy (3D-SIM) of F-actin and VE-cadherin labelled cells. Cadherin fingers extending from the rear of cells not only overlapped significantly with their follower cells, but appeared to be tightly connected to the actin cytoskeleton of both neighbors (Figure 2a, Supplementary Figure 2a). This suggested that outgoing cadherin fingers extending from one cell might be engulfed by the plasma membrane of a neighboring cell. We used three independent approaches to test for a potential engulfment.
Figure 2. Cadherin fingers are double membrane tubes extended from the back of leader cells and engulfed by the front of follower cells.
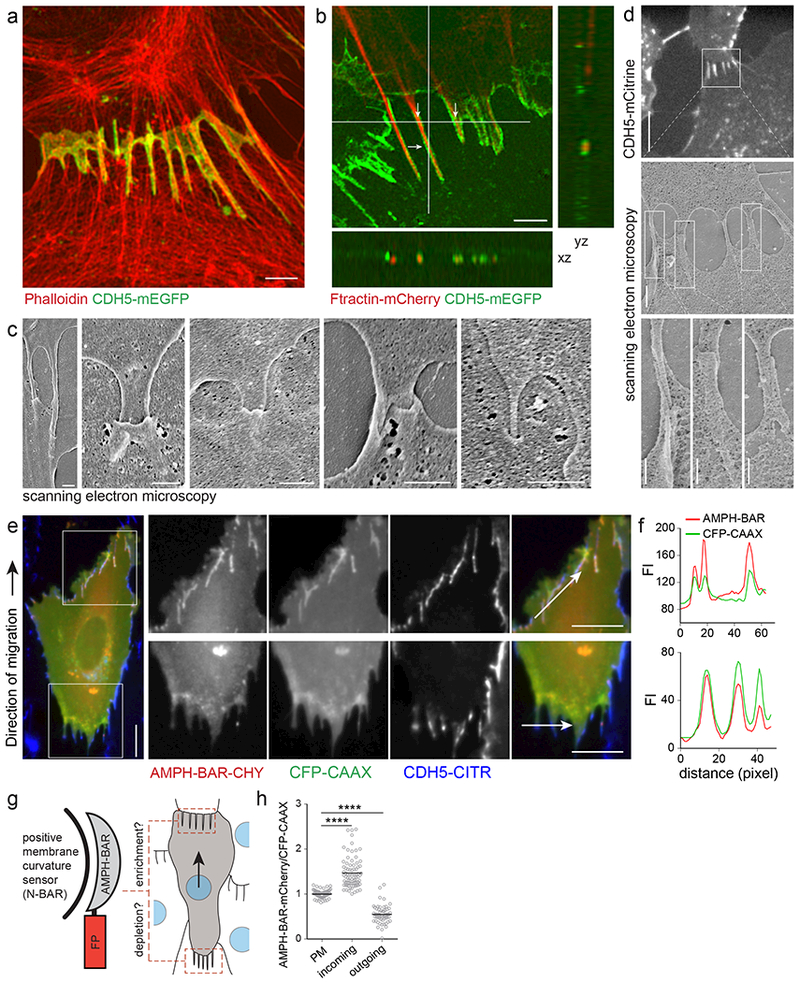
(a, b) 3D-SIM of HUVEC migrating bottom to top. (a) HUVEC stably expressing CDH5-mEGFP, fixed and stained with Phalloidin-AF594, show that cadherin fingers are extensively embedded within the actin cytoskeleton of the follower cell. Scale bar, 2 μm. (b) Two populations of HUVEC expressing either only Ftractin-mCherry or only CDH5-mEGFP were mixed and co-plated. Actin-rich, finger-like protrusions marked in the leader cell (top) are enveloped by CDH5-positive membranes originating from the follower cell (arrows, bottom). xz and yz cross-sections taken at the white lines show actin bundles of the leader cell enveloped by VE-cadherin from the follower cell. Scale bar, 2 μm. (c) Scanning electron microscopy (SEM) of endothelial cell-cell junctions shows finger-like protrusions engulfed by neighboring cells. Scale bars, 0.5 μm. (d) Correlated fluorescence (CDH5-mCitrine) and scanning electron microscopy (CLEM) of sparsely plated HUVEC reveals engulfed, finger-like structures at serrated cell-cell junctions. Scale bars, 10 μm (top), 1 μm (middle), and 0.5 μm (bottom). (e) HUVEC stably expressing CDH5-mCitrine and transfected with AMPH-BAR-mCherry and CFP-CAAX, a curvature-insensitive membrane marker, viewed by widefield-fluorescence microscopy. Incoming cadherin fingers (upper panels) show enrichment of AMPH-BAR-mCherry, whereas outgoing cadherin fingers (lower panels) show depletion of AMPH-BAR-mCherry relative to CFP-CAAX. Scale bars, 10 μm. (f) Intensity profiles of AMPH-BAR-mCherry and CFP-CAAX along the arrows in the image shown in (e). (g) Schematic of AMPH-BAR-FP, a fluorescent protein-conjugated N-BAR positive membrane curvature reporter and rationale of the enrichment/depletion analysis. (h) Statistical analysis of the enrichment and depletion of AMPH-BAR on the surface of incoming and outgoing cadherin fingers, respectively, relative to a curvature insensitive membrane marker CFP-CAAX (Materials and Methods). Individual measurements and means of n=137 cadherin fingers from 21 cells, pooled from two independent experiments. **** p<0.0001, Kruskal Wallis ANOVA/Dunn.
First, we performed mosaic cell experiments, where HUVEC expressing Ftractin-mCherry, a live-cell marker for F-actin24, were co-plated with HUVEC expressing CDH5-mEGFP, and focused on cell-cell junctions between the two cell types. Strikingly, outgoing cadherin fingers were marked by actin bundles that were surrounded by CDH5-mEGFP-positive membranes from the follower cell (Figure 2b). This argues that outgoing cadherin fingers in the back of leader cells contain actin bundles, with the back plasma membrane of the leader cell being engulfed by the front plasma membrane of the follower cell.
Second, we used field emission scanning electron microscopy (FE-SEM) to visualize cell-cell junctions in HUVEC monolayers. FE-SEM confirmed this striking topology by showing that finger-like protrusions extending from the presumed leader cell were engulfed by the follower cell (Figure 2c). In control correlated light and electron microscopy (CLEM) experiments, where we directly registered SEM and fluorescence microscopy data, we found that the sites of tubular membrane engulfment visible in SEM corresponded to the cadherin fingers we characterized by fluorescence microscopy (Figure 2d).
Third, due to their proposed asymmetric structure, tubular cadherin fingers should expose a convex or positively curved surface in the front of follower cells, and a concave or negatively curved surface in the back of leader cells. Indeed, when we compared the localization of a protein domain that selectively binds to positive membrane curvature in living cells (AMPH-BAR , Figure 2g,)25,26 to that of a plasma membrane marker, AMPH-BAR was enriched at the surface of incoming cadherin fingers in the front and depleted from the surface of outgoing cadherin fingers in the rear (Figure 2e-h). This ~3-fold enrichment is consistent with an engulfed tubular structure of cadherin fingers and shows that cadherin finger membranes are sufficiently curved to selectively recruit curvature-sensitive regulatory proteins, providing a potential mechanism for vectorial signal propagation during collective migration. An increased localization of an F-BAR domain protein to focal adherens junctions has recently been reported in support of the hypothesis that curved membranes can be associated with cadherin-dependent cell-cell junctions27.
Control experiments showed that cadherin fingers did not colocalize with the focal adhesion marker paxillin (Supplementary Figure 2b), confirming previous reports for serrated cell-cell junctions13. We also found that neither cellular extensions in cadherin finger junctions nor intercellular bridges fused the cytoplasms or plasma membranes of neighboring cells together, since neither a soluble (Ftractin-mCherry) nor a membrane marker (CDH5-mEGFP) were exchanged between neighboring cells expressing those markers (Supplementary Figure 2c), confirming previous reports11.
Together, these data argue that cadherin fingers are double plasma membrane tubes wherein the tubular membrane from a leader cell is engulfed by plasma membrane of the neighboring follower cell. Live-cell imaging showed that individual cadherin fingers are dynamic structures, increasing and decreasing in length and with a mean half-life of ~13 min (Supplementary Figure 1d, Video 3). However, while individual cadherin fingers dynamically grow and shrink, the polarized orientation of an ensemble of cadherin fingers at the interface between leader and follower cells remained the same relative to the direction of movement during collective migration (Video 2).
A cadherin/catenin-based link between cells is required for cadherin finger formation and coordinated cell migration, but not for autonomous migration
Mechanical coupling between collectively migrating cells has been shown to require classical cadherins, associated intracellular α and β catenins as well as actomyosin contractility28–30. Consistent with a need for mechanical coupling both for cadherin finger formation and for maintenance, siRNA-mediated knockdown of α-catenin (CTNNA1) disrupted cadherin fingers (Figure 3a-b), as did the expression of a truncated version of VE-cadherin lacking the cytoplasmic β-catenin binding domain (CDH5-Δβcat, Figure 3e-f). Furthermore, actomyosin contractility was also needed to maintain cadherin fingers, as inhibition of Rho-associated kinase (ROCK), a mediator of actomyosin contractility (using 20 μM Y27632), converted cadherin fingers into smooth junctions (Fig 3i-j)13.
Figure 3. A cadherin/catenin-based link between cells is required for cadherin finger formation and coordinated cell migration, but not for autonomous migration.
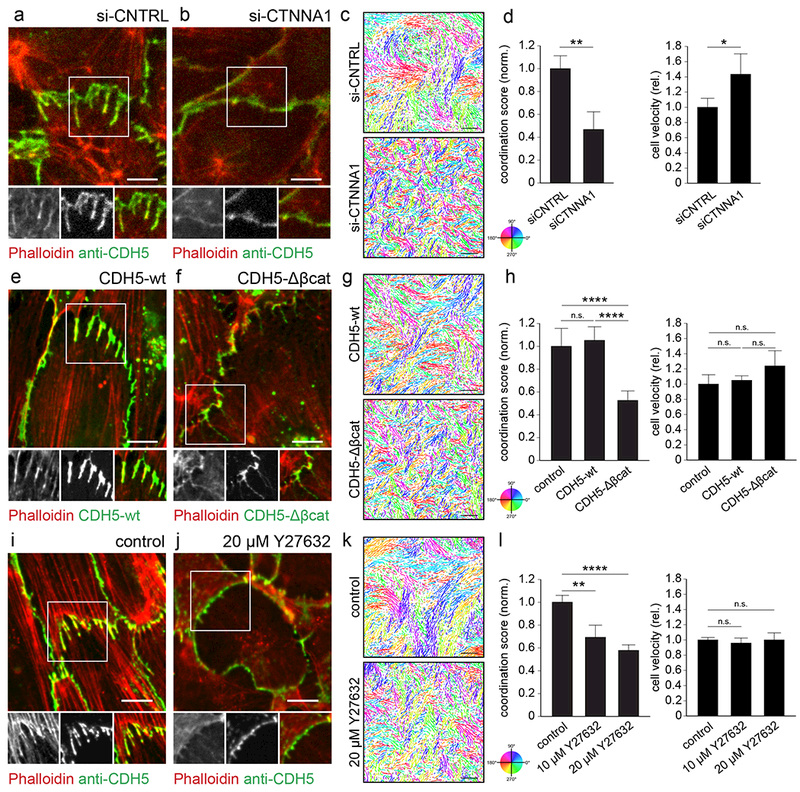
(a, b) HUVEC were transfected with either control siRNA or siRNA targeting α-catenin (CTNNA1), the cytoplasmic actin adapter of the cadherin/catenin complex. Polarized cadherin fingers were lost in α-catenin-depleted cells. Scale bars, 10 μm. (e, f) HUVEC stably expressing either fluorescently-tagged wild-type (CDH5-wt) or truncated VE-cadherin lacking the cytoplasmic beta-catenin binding domain (CDH5-Δβcat). Polarized cadherin fingers (e) were lost upon CDH5-Δβcat-expression (f). Scale bars, 10 μm. (i, j) HUVEC were either treated with the ROCK inhibitor Y27632 (20 μM) or left untreated. Polarized cadherin fingers (i) were lost in Y27632-treated cells (j). Scale bar, 10 μm. (c, g ,k) Cells migrating in monolayers were imaged for 2 h at 10 min intervals, their nuclei tracked, and the resulting trajectories colored according to their direction of movement to illustrate the extent of coordinated movement. Scale bars, 250 μm. Depletion of α-catenin (c-d), overexpression of truncated VE-cadherin (g-h), and ROCK inhibition (k-l) all caused a decrease in the extent of coordinated cell migration, but did not slow down individual cell migration. Bars are means ± S.D., n=3 independent experiments (d, h) or n=7 wells pooled from two independent experiments (l). * p<0.05, ** p<0.01, **** p<0.0001, (d) Student t-test, (h) ANOVA/Tukey, (i) Kruskal Wallis ANOVA/Dunn.
Using averaged pairwise velocity correlation as a metric, α-catenin depletion, overexpression of CDH5-Δβcat, and ROCK inhibition not only caused a loss of cadherin fingers but also, in parallel, a strong decrease in cell-cell coordination (Figure 3c-d, g-h, k-l). This suppression of coordination is remarkable, since cell motility measured as averaged single-cell speed was unaffected or even increased for all three perturbations (Figure 3d, h, l). Together, these studies confirm that both cadherin finger formation as well as coordinated movement require mechanical coupling between VE-cadherin and actin as well as actomyosin contractility. Furthermore, this shows that cadherin fingers are not required for cells to polarize or migrate autonomously, and supports the hypothesis that cadherin fingers have instead a role in orienting cells and coordinating collective migration.
Polarization of cadherin fingers requires continued Arp2/3-driven actin polymerization and asymmetric actomyosin contractility
Since engulfed cadherin fingers are present in the front of migrating follower cells, where Arp2/3 drives protrusive actin polymerization, we tested whether Arp2/3 activity is required for cadherin finger formation and maintenance. Acute treatment with the Arp2/3 inhibitor CK666 (200 μM31) caused immediate shrinking of cadherin fingers and, within 15 minutes, most had disappeared or lost polarized orientation (Figure 4a, Video 4). In addition, cell migration ceased (Supplementary Figure 3a). Similarly, acute treatment with the ROCK inhibitor Y27632 (20 μM) to reduce myosin II activity, caused cadherin fingers to shrink rapidly (Figure 4a, Video 4). When cells were treated with Thrombin (1U/ml), a potent activator of myosin II activity, cell-cell junctions became more serrated, as reported previously13. However, an intriguing observation was that the finger-like structures in Thrombin-treated cells lost their polarized orientation and now pointed both ways (Figure 4a, Video 4). This argues that Arp2/3-driven actin polymerization and actomyosin contractility are needed both for polarized cadherin finger formation and for maintenance. This also suggests that contractility must be spatially asymmetric for cadherin fingers to form, as a uniform increase in contractility leads to a loss in polarized cadherin finger orientation.
Figure 4. Polarization of cadherin fingers requires continued Arp2/3-driven actin polymerization and asymmetric actomyosin contractility.
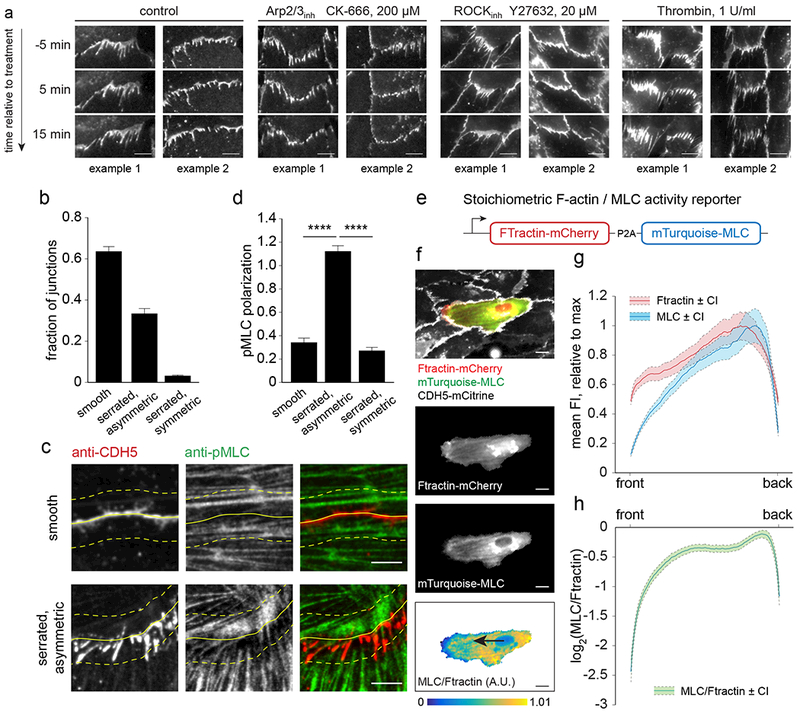
(a) HUVEC expressing CDH5-mCitrine were control treated or treated with an Arp2/3 inhibitor (CK666, 200 μM), a ROCK inhibitor (Y27632, 20 μM), or Thrombin (1U/ml) during the acquisition of time-lapse sequences. Cadherin fingers were lost upon Arp2/3 and ROCK inhibition, whereas Thrombin treatment caused cadherin fingers to point both ways. (b-d) Asymmetric phospho-myosin light chain (pMLC) distribution at asymmetric cell-cell junctions. (b) The fraction of (i) smooth, (ii) serrated/asymmetric and (iii) serrated/symmetric cell-cell contacts in HUVEC fixed and stained with phalloidin/anti-pMLC/anti-CDH5. 916 cell-cell junctions were analyzed, bars are means ±S.D. from n=3 independent experiments. (c-d) In serrated, asymmetric cell-cell contacts of control cells, pMLC signal was enriched near where cadherin fingers originated in the donor cells and locally depleted near incoming cadherin fingers in the acceptor cell. No gradients in pMLC signal could be observed in smooth contacts. Solid yellow lines indicate cell boundaries, dashed lines outline regions where pMLC signal was enriched/depleted in case of serrated/asymmetric, but not smooth cell-cell contacts. (d) pMLC intensity in two areas on opposite sides of smooth, serrated asymmetric, or serrated symmetric cell-cell contacts was measured and a normalized ratio expressed as pMLC polarization. Bars are means ±S.E.M. from n=52 measurements per junction type, pooled from two independent experiments. **** p<0.0001, Kruskal Wallis ANOVA/Dunn. (e) Schematic of the stoichiometric F-actin (Ftractin-mCherry) and myosin II activity (mTurquoise-MLC) reporter used. (f-h) Mosaic experiment of cells either expressing CDH5-mCitrine alone or coexpressing CDH5-mCitrine and Ftractin-mCherry-P2A-mTurquoise-MLC to determine front-back activity profiles of myosin activity in migrating cells. Time-lapse sequences acquired at 5 min intervals were used to track cells expressing Ftractin-mCherry-P2A-mTurquoise-MLC for 45 min. (f) Example of a cell expressing Ftractin-mCherry-P2A-mTurquoise-MLC surrounded by CDH5-mCitrine expressing cells. Masking was done based on Ftractin-mCherry signal and the relative myosin II activity calculated as the ratio of mTurquoise-MLC and Ftractin-mCherry intensities. (g,h) Front-back profiles of Ftractin-mCherry, mTurquoise-MLC, and the ratio mTurquoise-MLC/Ftractin-mCherry show a depletion of myosin activity in the front. Mean profiles ±95% confidence intervals from n=181 cells, pooled from two independent experiments. Scale bars, 10 μm
To test for gradients in actomyosin contractility during collective migration, we compared actomyosin activity in the rear of leader cells and the front of follower cells in two ways.
First, we used an antibody to detect activated, phosphorylated myosin II regulatory light chain (pMLC). We classified cell-cell junctions into (i) smooth, (ii) asymmetric/serrated, and (iii) symmetric/serrated junctions (Figure 4b). By comparing pMLC localization in the two regions on adjacent sides of cell-cell junctions, we found that pMLC showed a high local gradient at asymmetric/serrated cell-cell junctions but was symmetrical at both smooth and symmetric/serrated cell-cell junctions. Markedly, pMLC antibody staining was depleted near incoming cadherin fingers in the cytoplasm of follower cells, arguing that actomyosin contractility must be low in this region (Figure 4c, d).
Second, we generated a stoichiometric F-actin and myosin II activity reporter construct based on fluorescently tagged Ftractin and myosin II regulatory light chain (MLC) that we expressed equally as two proteins from the same mRNA (Figure 4e). MLC is diffusely cytoplasmic when inactive, but forms puncta along actin filaments when activated32. Comparing fluorescent signals of MLC and Ftractin in low-density HUVEC cultures showed a strong depletion of myosin II activity in regions of active lamellipodia protrusions (Video 5). Furthermore, consistent with the results obtained by immunofluorescence and anti-pMLC antibody, myosin II activity was locally depleted from the same front regions of collectively migrating cells where cadherin fingers were present (Figure 4f-h, Supplementary Figure 3b-d, Video 6, 7).
Individual cells within a collectively migrating monolayer have previously been shown to be intrinsically polarized with their “frontness” defined by frequent local lamellipodium-like protrusions (“cryptic lamellipodia”33). The zone of low actomyosin contractility near incoming cadherin fingers at the front may allow such cryptic lamellipodia to form to direct forward movement.
Presence and orientation of cadherin fingers correlate with local edge dynamics and predict cell turning
In order to better understand a potential role of cadherin fingers in cell guidance, we followed three strategies to determine the dynamic relationship between cadherin fingers, local membrane protrusion, and cell turning.
First, we performed mosaic culture analysis with cells either expressing fluorescently tagged CDH5 or the F-actin marker Ftractin. Both 3D-SIM and live-cell widefield fluorescence microscopy revealed that cadherin fingers colocalized with cryptic lamellipodia of follower cells that protrude forward below the cadherin fingers, along the adhesion surface (Figure 5a, b). The close spatial association between cadherin fingers and cryptic lamellipodia suggests that they may form a functional unit important for directed migration.
Figure 5. Incoming cadherin fingers are spatially and temporally correlated with locally extending cryptic lamellipodia.
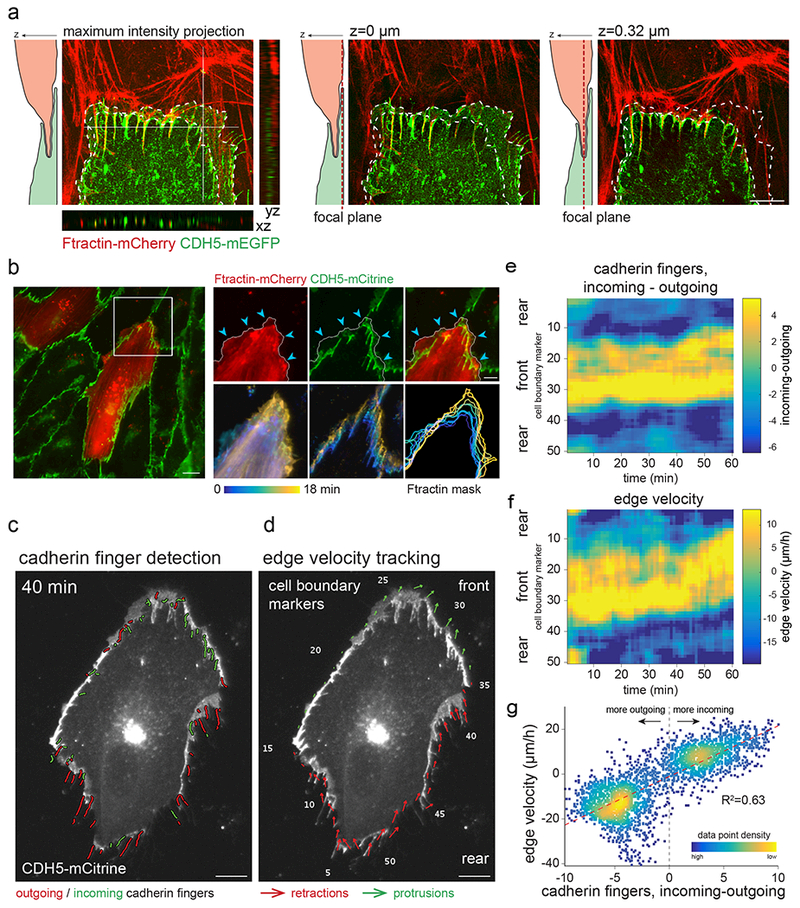
(a, b) Incoming cadherin fingers are associated with local protrusive, lamellipodial activity. (a) 3D-SIM of the junctional region between an Ftractin-mCherry (top) and a CDH5-mCitrine (bottom) expressing cell. Optical z-sectioning shows cryptic lamellipodial activity (arrowheads) near incoming cadherin fingers. xz and yz sections were stretched 2x in z-direction. Scale bar, 5 μm. (b) A mosaic monolayer of HUVEC either stably expressing CDH5-mCitrine alone or coexpressing CDH5-mCitrine+Ftractin-mCherry, plated at 10:1, and imaged at 2 min intervals. Protrusive lamellipodial activity was observed in the front of the Ftractin-mCherry-expressing cell, near incoming cadherin fingers. Enlargements show protrusions (upper right, arrowheads) and temporally color-coded Ftractin-mCherry/CDH5-mCitrine signals, as well as a temporally color-coded outline of the Ftractin-mCherry mask (lower right). Scale bars, 10 μm (left), 5 μm (right). (c-g) Individual HUVEC expressing CDH5-mCitrine in mosaic monolayers with HUVEC expressing CDH5-mRuby3 (plated at 1:10, CDH5-mRuby3 not shown) were imaged at 1 min intervals. Segmented incoming and outgoing cadherin fingers (c) and local edge velocity (d) were determined based on CDH5-mCitrine and CDH5-mRuby3 signal (Materials and Methods). Velocity arrows reflect movement of boundary markers averaged over 7 minutes and scaled 10x for visualization. Scale bars, 10μm. (e) Incoming cadherin finger bias, computed as incoming - outgoing cadherin fingers within overlapping windows of 5 boundary markers and averaged over 7 minutes, was plotted for all cell boundary markers over 1 h to generate a spatio-temporal map of cadherin finger presence and orientation. (f) Similarly, local edge velocity was plotted for equivalent peripheral windows to generate a spatio-temporal edge velocity map. (g) Correlation between incoming cadherin finger bias and local edge velocity as computed in (e, f) plotted against each other demonstrate that peripheral regions with more incoming cadherin fingers protrude, whereas regions with more outgoing cadherin fingers retract. Data for additional cells shown in Supplementary Figure 4.
Second, we quantitatively related the presence and orientation of cadherin fingers to the rate of membrane protrusion by automatically identifying incoming and outgoing cadherin fingers and correlating their presence to local cell edge velocity. Local edge velocities and cadherin finger orientation and presence were measured over 60 min based on segmentation of individual CDH5-mCitrine-expressing cells in CDH5-mCitrine/CDH5-mRuby3 mosaic monolayers (Figure 5c-d, Video 8). Markedly, the presence of incoming cadherin fingers closely correlated with local protrusion rates, whereas outgoing cadherin fingers correlated with local retraction rates (Figures 5e-g, Supplementary Figure 4). The close spatiotemporal correlation between incoming cadherin fingers and local membrane protrusion provides support for a role of newly formed cadherin fingers in directing protrusions and thereby mediating collective cell guidance.
Third, we determined whether cadherin fingers may have a role in re-directing follower cells or in mediating cell turning by focusing on a subpopulation of cells that spontaneously exhibited significant turning behavior in unperturbed monolayers. We tracked CDH5-mCitrine-expressing HUVEC with their nuclei stained with Hoechst and selected turning cells based on their nuclear trajectories (Figure 6a). For the selected cells, we monitored the presence and location of cadherin fingers before and during the turning process and related them spatially and temporally to the associated nuclear trajectories (Figure 6b, c, Supplementary Figure 5a, b). Cross-correlation analysis of the left-right bias of incoming cadherin fingers compared to cell turning revealed that the abundance of cadherin fingers increases on the side of a cell towards which a cell will turn ~12 min. before the cell actually turns (Figure 6d, Supplementary Figure 5b, c, Video 9). The finding that cadherin fingers are induced in follower cells before they turn is consistent with the hypothesis that cadherin fingers are instructive structures that redirect cryptic lamellipodia and the direction of migration of follower cells. Importantly, similar analyses for outgoing cadherin fingers at the rear of cells showed that the localization of outgoing cadherin fingers did not predict, but lagged behind turning (Figure 6e-g, Supplementary Figure 5d, e, Video 10).
Figure 6. Increased localization of incoming cadherin fingers towards the left or right front region precedes cell turning.
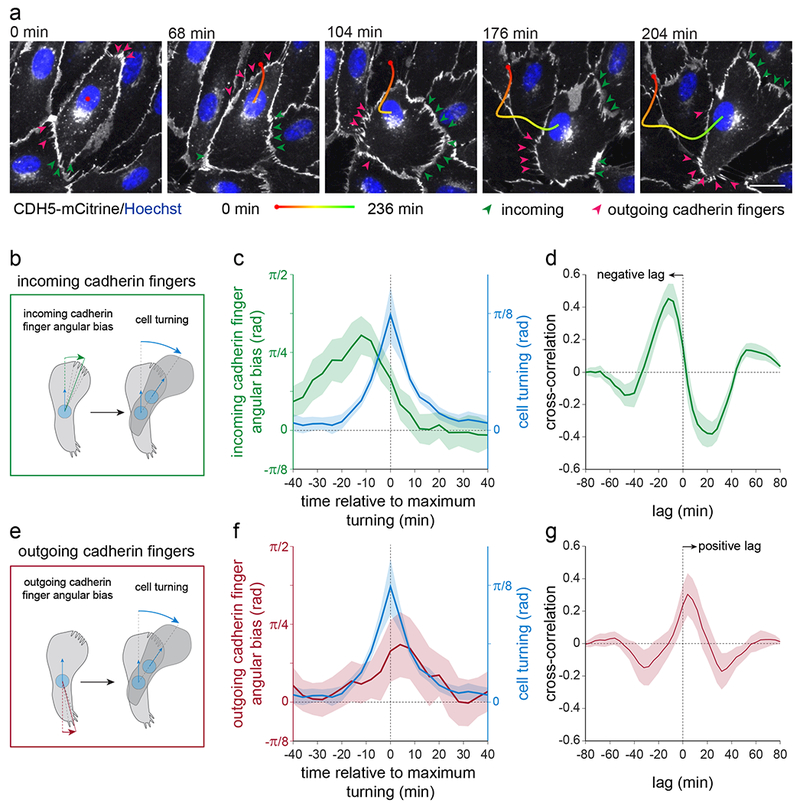
(a-g) HUVEC stably expressing CDH5-mCitrine and stained with nuclear dye (Hoechst) were imaged at 4 min intervals for 4 h. Turning cells were identified based on nuclear tracks and analyzed for the presence and localization of incoming/outgoing cadherin fingers along their periphery prior, during, and after the turning events (Materials and Methods). (a) Example of a cell during a turning event. Incoming and outgoing cadherin fingers are highlighted by green and red arrowheads, respectively. Scale bar, 20 μm. (b) Schematic for quantitative analysis of incoming cadherin finger angular bias and cell turning, calculated as the mean angular deviation of all incoming cadherin fingers, located along a cell’s periphery, from the direction of cell movement, at a given time point (Materials and Methods). (c) Evolution over time of cell turning and incoming cadherin finger angular bias during turning events, aligned to the time point of maximum turning. (d) Temporal cross-correlation between incoming cadherin finger angular bias and cell turning showed that incoming cadherin finger angular bias preceded cell turning. (e-g) Analogous analysis as in (b-d) for outgoing cadherin finger angular bias and cell turning. Outgoing cadherin finger angular bias followed cell turning. (c-d, f-g), means ± 95% confidence intervals for n=33 cells, pooled from 2 independent experiments.
Together, a potential turning mechanism mediated by cadherin fingers and low myosin activity is reminiscent of a guidance mechanism in mesenchymal cells, where localized inactivation of myosin II at the leading edge has been shown to correlate with chemotaxis towards growth factor34.
Increased contractility in leader cells triggers polarized cadherin finger formation and engulfment by follower cells
To understand how cadherin fingers may direct local protrusions during collective migration, we investigated how cadherin fingers are formed and oriented between cells. Cadherin finger formation and orientation might in principle be initiated by either a future follower cell or a future leader cell. A future follower cell may induce leader behavior in a neighbor35 by increasing actin polymerization and lamellipodia extension to engulf cadherin fingers (model (i), Figure 7a). Alternatively, a future leader cell may increase actomyosin contractility and trigger formation of outgoing cadherin fingers to induce follower behavior in a neighbor (model (ii), Figure 7b).
Figure 7. Increased contractility in leader cells triggers polarized cadherin finger formation and engulfment by follower cells.
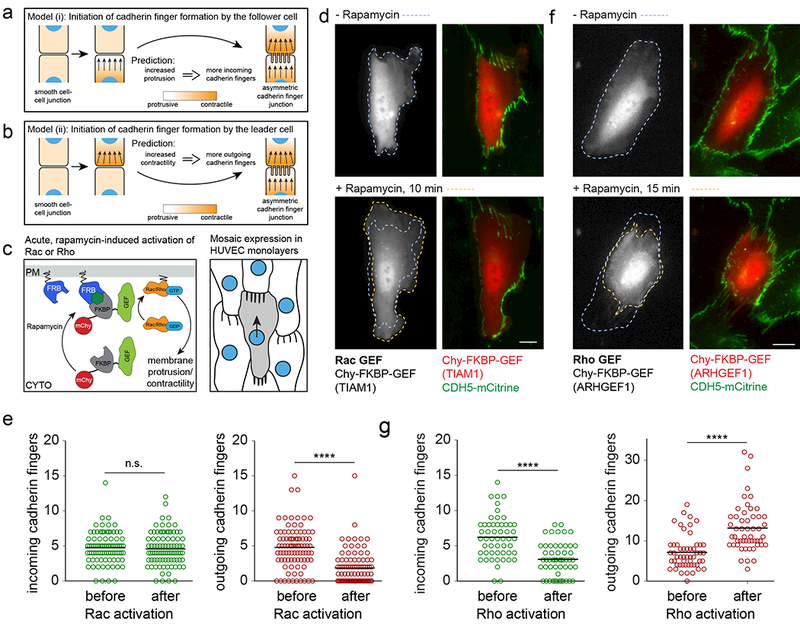
(a,b) Schematics for models where cadherin finger formation is initiated by the future follower (a) or the future leader cell (b). (c) Schematic illustrating the strategies to synthetically activate Rac and Rho in individual cells in monolayers of HUVEC expressing CDH5-mCitrine. (d) Activation of Rac by addition of Rapamycin (0.5 μM) to cells transiently cotransfected with Lyn11-FRB and mCherry-FKBP-GEF(TIAMl) induces protrusive actin polymerization leading to increased cell spreading. Scale bar, 10 μm. (e) Changes of the number of incoming and outgoing cadherin fingers along the cell periphery of cells, before and 10 min after the synthetic activation of Rac. n=89 cells from two independent experiments were analyzed, individual measurements and means are shown. **** p<0.0001, Wilcoxon signed rank test. (f) Activation of Rho by addition of Rapamycin (0.1 μM) to cells transiently cotransfected with Lyn11-FRB and mCherry-FKBP-GEF(ARHGEFl) induces a contractile response. Scale bars, 10 μm. (g) Changes of the number of incoming and outgoing cadherin fingers along the cell periphery of cells, before and 15 min after the synthetic activation of Rho. n=53 cells from 3 independent experiments were analyzed, individual measurements and means are shown. **** p<0.0001, Wilcoxon signed rank test.
To distinguish between these models, we induced either protrusive actin polymerization or actomyosin contractility in individual cells in a monolayer. This was done by synthetically activating Rac or Rho GTPases through translocation of FKBP-conjugated Rac or Rho GEF domains to the plasma membrane by Rapamycin-induced heterodimerization with a plasma membrane-localized Lyn11-FRB (Figure 7c)36. Transient cotransfection of HUVEC stably expressing CDH5-mCitrine with the membrane anchor Lyn11-FRB and either mCherry-FKBP-GEF(TIAM1), a Rac GEF, or mCherry-FKBP-GEF(ARHGEF1), a Rho GEF, resulted in mosaic monolayers of transfected and untransfected cells. Addition of Rapamycin robustly induced spreading or contraction of the transfected cells within minutes, consistent with acute activation of Rac or Rho, respectively (Figure 7d, f).
Scoring the number of incoming and outgoing cadherin fingers along the periphery of transfected cells, before and 10 min after addition of Rapamycin, showed that Rac activation did not change the number of incoming cadherin fingers, arguing against a model that follower cells can induce leader behavior in a neighboring cell by activating membrane protrusion (Figure 7d, e, Video 11). Nevertheless, Rac activation and increased lamellipodia protrusion led to an overall decrease in outgoing cadherin fingers, arguing that local Rac activation can strengthen existing follower behavior in the front and weaken leader behavior in the back (Figure 7e).
In contrast, increased actomyosin contractility through activation of Rho, increased the number of outgoing cadherin fingers (Figure 7f) with incoming cadherin fingers frequently “flipping” outwards (Figure 7f-g, Video 12). This argues that Rho activation can promote engulfment of cadherin fingers by a neighbor.
We used two additional approaches to corroborate this result. First, we monitored cell-cell junctions between interphase cells and cells at the onset of mitotic cell rounding, an event where cells naturally experience increased actomyosin contractility37–39. The results were qualitatively and quantitatively similar to synthetic Rho activation (Figure 8a, b, Video 13). Second, we used local optogenetic activation of Rho through light-induced translocation of (PDZ)2-mCherry-GEF(LARG) to the plasma membrane-localized Stargazin-GFP-LOVpep (Figure 8c)40. Locally increased contractility through local Rho activation using 445 nm laser stimulation resulted in an increased number of outgoing and a loss of incoming cadherin fingers (Figure 8d, Video 14).
Figure 8. Cadherin finger formation at the onset of mitotic cell rounding and following optogenetic Rho activation.
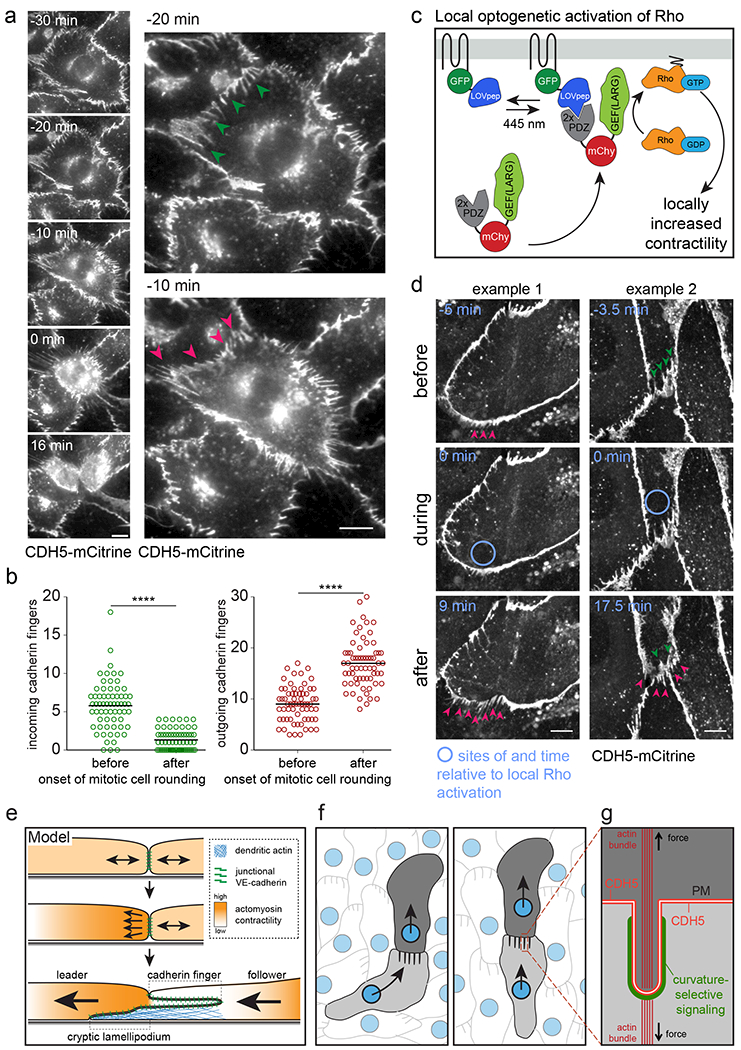
(a) Live-cell imaging of HUVEC expressing CDH5-mCitrine during the onset of mitotic cell rounding. Timestamps are times relative to the completion of mitotic cell rounding. Green arrowheads point towards incoming cadherin fingers that flip to become outgoing cadherin fingers (red arrowheads). Scale bars, 10 μm. (b) Change of the number of incoming and outgoing cadherin fingers along the cell periphery of cells going into mitosis, within an 8 min interval before and after the onset of mitotic cell rounding. n=65 cells from two independent experiments were analyzed, individual measurements and means are shown. **** p<0.0001, Wilcoxon signed rank test. (c) Strategy to locally activate Rho using optogenetics in individual cells in monolayers of HUVEC expressing CDH5-mCitrine. (d) Local light-mediated Rho activation in cells transiently cotransfected with Stargazin-GFP-LOVpep and (PDZ)2-mCherry-GEF(LARG) caused locally increased formation of outgoing cadherin fingers. Green/red arrowheads indicate incoming/outgoing cadherin fingers. Scale bars, 10 μm. (e) Cadherin fingers are characteristic membrane and actin structures at the interface between leader and follower cells. Their formation is initiated by increased contractility at the rear of the future leader cell. The follower cell responds to support cadherin finger engulfment and extends local cryptic lamellipodia. (f) Leader-follower cell relationships are maintained by cadherin fingers that leaders extend from their rear and followers engulf in their front. Incoming cadherin fingers may bias the autonomous migration machinery of follower cells to follow the leader by favoring local protrusion events. (g) The surface of incoming, engulfed cadherin fingers may serve as a platform for recruitment of curvature-selective regulators to bias cell-autonomous signaling gradients supporting collective cell migration (see main text).
Together, these results argue for the second model (Figure 7b), in which polarized cadherin finger formation can be initiated by increased contractility in the rear of a leader cell to trigger engulfment of cadherin fingers and induce follower behavior in a neighbor.
Discussion
Serrated or discontinuous endothelial cell-cell junctions have previously been implicated in junction remodeling, the response to inflammatory stimuli, and the regulation of vascular permeability 10,13,41,42. We show that serrated cell-cell junctions, here termed cadherin fingers, are polarized, engulfed cadherin and membrane structures that connect the front and rear of collectively migrating endothelial cells. Cadherin fingers are double plasma membrane tubes with one plasma membrane extending from the rear of a leader cell to be engulfed by the plasma membrane of its follower cell, through VE-cadherin-mediated cell-cell adhesion (Figure 8e-g). We confirmed the existence of this engulfed structure using both 3D-SIM light and scanning electron microscopy. We show that with respect to the direction of migration, cadherin fingers point outward from the rear of cells towards their followers, both in streams of collectively migrating cells in unperturbed monolayers, and during wound healing. We confirmed the opposite curvature characteristic of the membrane tubes in leader and follower cells using a live-cell BAR domain curvature reporter.
3D-SIM also showed that VE-cadherin in cadherin fingers is deeply connected to the actin cytoskeleton of leader and follower cells, suggesting that both cells contribute to the formation of cadherin fingers. While present on both sides, the contractile actomyosin structures are distinct in both cells, with actomyosin contractility being high in the back of leader cells, and low in a narrow zone with cadherin fingers in the front of follower cells. Actomyosin contractility is likely needed on both sides of the zone with low actomyosin activity to mechanically anchor the cadherin finger structure.
We found a requirement of cadherin/α/β-catenin complexes, myosin II-mediated contractility, as well as Arp2/3-mediated actin polymerization for cadherin finger formation and maintenance. Using chemical and optogenetic strategies to acutely induce either protrusive actin polymerization or actomyosin contractility in individual cells or cell regions, we directly showed that increased contractility in future leader cells, but not protrusive lamellipodia extension in follower cells, can initiate cadherin finger formation in a neighbor.
Thus, our study is consistent with a model where cadherin finger formation is a sequential process that starts in a monolayer with locally increased contractility in the future leader cell. Actomyosin contractility has previously been shown to mediate locally curved plasma membrane structures and may provide an initial membrane curvature asymmetry26. Extension of outgoing membrane tubes and engulfment of incoming cadherin fingers by follower cells may then occur in parallel in a process powered by Arp2/3-driven dendritic actin polymerization and rearward moving actin structures (“treadmilling”) in the front of follower cells15,16. Such a process may link the formation of outgoing cadherin fingers from a leader cell to the local protrusion of cryptic lamellipodia in a follower cell.
Our findings that formation and orientation of cadherin fingers can be propagated from one cell to the next suggested that cadherin fingers mediate or stabilize leader-follower cell relationships. We were intrigued to find that when cells turn within the monolayer, incoming cadherin fingers became laterally enriched at the side of the front towards which cells were going to turn ~12 minutes later. A guidance role for cadherin fingers was also suggested by molecular perturbations that caused a correlated loss of cadherin fingers and coordinated cell movement, without affecting the autonomous polarization and migration of individual cells (Figure 3). Thus, cadherin fingers have a likely role in locally biasing a follower cells’ autonomous polarity signaling processes and thereby reorienting the polarity of the follower cell. By then directing the next follower cell, cadherin fingers may act as serial guidance signals for collective migration.
In order to serve as an instructive guidance cue, the asymmetry of the cadherin finger structure has to be converted into an asymmetric signaling response that is distinct between the rear of leaders and front of followers. We hypothesize that the opposite orientation of membrane curvature on incoming and outgoing cadherin fingers could bias the localization of curvature-sensing proteins to create asymmetry in signaling. Such a role of curvature-sensitive proteins is plausible as we found a ~3-fold polarized enrichment of a curvature sensing BAR domain along the surface of incoming cadherin fingers compared to outgoing cadherin fingers. Of note, only a relatively small asymmetry of regulatory proteins might be sufficient to orient cells as they have an autonomous capacity to polarize. Asymmetric curvature sensing provides a compelling mechanism how polarity might be propagated from leader to follower cells if the formation of cadherin fingers is paralleled by a polarized recruitment of proteins with curvature sensing domains that can suppress actomyosin contractility, induce actin polymerization, and promote cadherin finger engulfment (Figure 8g). Future studies will aim at identifying curvature-specific regulators that may control these processes in endothelial cells.
Together, our study introduces cadherin fingers as polarized, engulfed structures that support collective polarization during collective endothelial cell migration. Our data suggest that cadherin fingers provide instructive structural cues needed to direct endothelial follower cells during collective migration. Such a mechanism is reminiscent of local chemoattractant cues that can direct and polarize solitary neutrophils and Dictyostelium discoideum43,44, where, in contrast to endothelial cells, guidance is achieved independently of mechanical coupling between cells. Serrated cell-cell junctions have been observed in a variety of epithelial and endothelial cell types and cadherin finger-mediated polarity signaling between cells may therefore be a general mechanism supporting tissue-level organization of cells.
Methods
Cell culture
Primary HUVEC (Lonza, C2519A) were cultured in EGM2 (Lonza CC-3162). hTERT-immortalized HUVEC (HT-HUVEC) were generated by transduction of HUVEC with lentivirus encoding hTERT-IRES-hygro followed by hygromycin selection (50 μg/ml). HUVEC stably expressing fluorescent reporter constructs were derived from HT-HUVEC by lentiviral transduction followed by either FACS sorting or antibiotics selection (0.5 μg/ml puromycin, 10 μg/ml blasticidin). 293T cells (not authenticated) were maintained in DMEM supplemented with 10% FBS and 1% GlutaMAX (Thermo Fisher Scientific). The HEK293T cell line used for lentivirus production is in the ICLAC list of misidentified cell lines. However, none of our conclusions rely on the identity of the HEK293T cells. The absence of mycoplasma contamination in cell cultures was routinely verified using a PCR test45.
Antibodies and reagents
Mouse monoclonal anti-CDH5 was purchased from BD Transduction Laboratories (610252, used at 1:400), rabbit polyclonal anti-phospho-myosin light chain 2 (Ser19) from Cell Signaling Technology (3671S, used at 1:400), rabbit monoclonal anti-paxillin from Abcam (ab32084, used at 1:250). Phalloidin conjugated to FITC and Alexa Fluor dyes, secondary antibodies, and Hoechst 33342 were from Thermo Fisher Scientific, CK666 from Sigma-Aldrich (SML0006), Y27632 from Santa Cruz Biotechnology (sc281642), Thrombin from Sigma-Aldrich (T4648), Rapamycin from LC Laboratories (R-5000), and bFGF from R&D Systems (223-FB).
DNA constructs and lentivirus production
Plasmid constructs generated for this study along with detailed sequence information will be available from Addgene following publication (http://www.addgene.org/Tobias_Meyer/).
CDH5 (human, VE-cadherin) was PCR amplified from HUVEC-derived cDNA and TOPO-cloned into pENTR/D-TOPO. CDH5-mCitrine and CDH5-mEGFP were generated by LR recombination using the custom-made Gateway destination vectors pmCitrine-N-DEST/TO and pmEGFP-N-DEST/TO, respectively. CDH5-mEGFP and CDH5-mCitrine were then transferred, following PCR amplification, into pCAGEN (Addgene #11160) as EcoRI/XhoI fragments. For pLenti-CDH5-mCitrine-IRES-puro, CAG-CDH5-mCitrine was released and ligated as SalI/NotI fragment into a custom-made and XhoI/NotI-digested pLenti-MCS-IRES-puro. pLenti-CDH5-mRuby3-IRES-puro was generated by releasing mCitrine from pLenti-CDH5-mCitrine-IRES-puro as an AgeI/NotI fragment and replacing it with mRuby346, kindly provided by Michael Lin (Stanford University), by Gibson assembly47. For pLenti-CDH5-mEGFP, CAG-CDH5-mEGFP was first subcloned into pENTR1A-noCCDB (Addgene #17398) as a SalI/XhoI fragment, then transferred by LR recombination into pLenti-X1-puro-DEST (Addgene #17297). To overexpress VE-cadherin with the cytoplasmic β-catenin binding site deleted (CDH5-Δβcat), we used a construct similar to tailless VE-cadTS 48, but based on human VE-cadherin (encoding VE-cadherin amino acids 1-669, C-terminally tagged by TS-mod, featuring mTFP1 and mVenus fluorescent tags).
pLenti-Ftractin-mCherry was generated by PCR-amplification of Ftractin-mCherry in pEGFP-N149 and ligation into CSII-EF-MCS (kindly provided by Dr. Xuedong Liu, University of Colorado, Boulder CO) as XhoI/NotI fragment.
pLenti-mTurquoise-MLC-IRES-neo was constructed by PCR amplification of human MLC (myosin II regulatory light chain, MYL9) from a HUVEC cDNA library, PCR amplification of mTurquoise, and Gibson assembly into custom-made, BamHI and EcoRI-digested pLenti-EF1a-MCS-IRES-neo.
The stoichiometric myosin II/F-actin activity reporter consisted of cDNA encoding Ftractin-mCherry followed by a Gly-Ser-Gly linker, a P2A ribosomal skipping sequence50, and mTurquoise-MLC (MYL9). Low expression of the reporter was achieved through a 5’ upstream ORF (ACCATGGGTTGAACC, uORF51). Ftractin-mCherry was PCR amplified from Ftractin-mCherry in pEGFP-N149, mTurquoise-MLC from pLenti-mTurquoise-MLC-IRES-neo. The 5’ uORF and the P2A sequences were introduced during PCR and both fragments were Gibson-assembled into custom-made, BamHI and EcoRI-digested pLenti-EF1a-MCS-IRES-blast.
For pLenti-hTERT-IRES-hygro, hTERT (from Addgene #1773,52), IRES, and HygroR were each PCR amplified and Gibson-assembled into the EcoRI/XmaI-digested lentiviral vector EF1a-MCS-PGK-Blast (kindly provided by Dr. Gerald Crabtree, Stanford University, Stanford, CA). AMPH-BAR-mCherry. Using human Amphiphysin1 (AMPH1) as a template (human ORFeome v5.1), the BAR domain of AMPH1 (amino acids 1-256) was PCR amplified and ligated into pCAGEN, digested by EcoRI/AgeI, containing mCherry for C-terminal tagging.
Lyn11-FRB and CFP-CAAX and have been described36,43.
mCherry-FKBP-GEF(TIAM1), cloned into pCAGEN, included mCherry, FKBP, and the DH domain of human TIAM1 (amino acids 1012-1250). The DH-PH domain of TIAM1 potently activates Rac activity when translocated to the plasma membrane53; here the isolated DH domain of TIAM1 was used to further reduce the basal GEF activity of the construct in the absence of Rapamycin. mCherry-FKBP-GEF(ARHGEF1) was analogously constructed, but included the GEF domain (amino acids 380-630) of ARHGEF1 (p115 RhoGEF), a Rho-specific RhoGEF54.
Constructs for optogenetic activation of RhoA, Stargazin-GFP-LOVpep and (PDZ)2-mCherry-DH(LARG), were a gift from Dr. Michael Glotzer (University of Chicago, Chicago IL) and have been described previously40.
Lentivirus was generated in HEK293T cells cotransfected with the 3rd-generation packaging plasmids pMDLg/pRRE, pRSV-rev, pCMV-VSVG (kindly provided by Dr. Xuedong Liu, University of Colorado, Boulder CO) using Lipofectamine200055, and a transfer vector containing the gene of interest. Viral supernatants collected at 48 h and 72 h post transfection were pooled, 0.22 μm-filtered, and concentrated using centrifugal filter units (100 kDa cutoff, Millipore, UFC910024).
siRNA transfections and high-throughput cell motility assay
siRNA pools targeting YFP (control) or α-Catenin (CTNNA1) were generated as described previously56. Briefly, −600 bp regions of targeting genes were amplified by PCR (Supplementary Table 1), in vitro transcribed using T7 polymerase and T7-flanked PCR products as templates. Double-stranded in vitro transcription products were diced in vitro using in-house made Giardia dicer and purified.
Optical 96-well plates, either plastic-bottom (Corning 3904), or glass-bottom (Cellvis, P96-1.5H-N), were pretreated with 31 μg/ml bovine collagen (Advanced BioMatrix, 5005-B) in PBS at 37°C for 1 h or 16 h, respectively. 104 HUVEC per well, suspended in 80 μl antibiotics-free EGM2, were reverse-transfected with siRNAs diluted in 20 μl OptiMEM to final 20 nM and using 0.25 μl Lipofectamine RNAiMAX. The transfection mix was replaced with EGM2 after 6-9 h. At 50-60 h post transfection, Hoechst was added to the medium at 200 ng/ml for 1 h to stain nuclei. The medium was replaced with imaging medium (EGM2 buffered with 20 mM HEPES pH 7.4), plates were sealed with adhesive tape, and time-lapse series were acquired at 1 frame/10 min using a 4× objective and the DAPI channel of an automated fluorescence microscope (ImageXpress Micro XL, Molecular Devices).
Cell tracking and motility analysis
Segmentation of cell nuclei and tracking were performed using custom-written MATLAB routines. The rationale, algorithm and code have been described before56,57. In brief, the nuclei of individual cells were identified using a modified Otsu’s method58. To monitor the moving trace of each nucleus, the nuclei identified at each time frame were linked based on the nearest neighbor method. In case mitosis happened, one of the daughter cells was directly linked to the mother cell. The other was assigned a new number, and its correlation with the mother cell was saved in a separate file. Cell velocity was determined based on nuclear displacements between subsequent time points (10 min interval), averaged over 10 time points. Coordinated cell movement was quantified based on averaged pairwise velocity correlation between individual cells and their neighbors using the equation:
for N cells migrating at , their n neighbors within radius r= 100 μm, migrating at (Figure 1b). Front and rear neighbors of a given cell were those cells within r=100 μm whose nuclei were within a 60° sectors ahead or behind, centered around, ; lateral neighbors the remaining cells within r=100 μm (Fig. 1d)
Fixed and live-cell imaging
HUVEC were plated on chambered coverslips (LabTek) or glass-bottom 96-well plates coated with collagen as described above. Cells were fixed by adding fixation solution (4% formaldehyde, 10 mM HEPES pH 7.4, in PBS) at a ratio of 1:1 to culture medium (final 2% formaldehyde). After 15 min the fixation solution was removed, cells were washed with PBS, followed by incubation in permeabilization/blocking solution (0.1% Triton X-100, 10% FBS, 1% BSA, 0.01% NaN3, in PBS) for 30 min, and stained with appropriate primary/secondary antibodies diluted in permeabilization/blocking solution. Fixed cells were imaged overlaid with PBS, live cells were imaged in EGM2 buffered with 20 mM HEPES pH 7.4 or extracellular buffer (ECB, 125 mM NaCl, 5 mM KCl, 1.5 mM MgCl2, 1.5 mM CaCl2, 10 mM D-glucose) supplemented with 1% FBS and 5 ng/ml bFGF, and plates were kept sealed during imaging.
Images shown in Figures 1b, 1f, 3, 4c, 4f, 6a, in Supplementary Figure 1c, and Videos 1, 2, 7, 9, 10, were captured using a fully automated fluorescence microscope (ImageXpress Micro XL, Molecular Devices), equipped with a Sola Light Engine (Lumencor), a Zyla 5.5 sCMOS camera (Andor), and using either a 20× 0.45 NA Plan Fluor or a 20× 0.75 NA Plan Apo objective (Nikon).
Images shown in Figures 2d, 2e, 5b-d, Supplementary Figure 1a, and Videos 5, 6, 8, were captured using a custom-built widefield-fluorescence/Yokogawa spinning disc confocal system built around a Zeiss Axiovert 200M microscope, enclosed in an environmental chamber (Haison), outfitted with a confocal spinning disc head (Yokogawa CSU22), a CRISP autofocus system (Applied Scientific Instrumentation), a QuantEM:512SC electron multiplied CCD camera (Photometries, confocal light path), an ORCA Flash 4.0 LT sCMOS camera (Hamamatsu, EPI light path), a 100 W HBO lamp, and three lasers 442 nm (He-Cd, 300 mW, Kimmon), 514 nm, (Ar-Kr, 400 mW, Melles Griot), and 593.5 nm (DPSS, 100 mW, CNI). A 63× 1.2 NA C-Apochromat water immersion or a 40× 1.3 NA Plan Neofluar oil immersion objective was used and the system was controlled using μManager59.
Images shown in Figures 4a, 7, 8, Supplementary Figure 2b, and Videos 3, 4, 11–14, were acquired using a fully automated widefield/Yokogawa spinning disc confocal fluorescence microscope system (Intelligent Imaging Innovations, 3i), built around a Nikon Ti-E stand, equipped with Nikon 40× 1.3NA oil and 60× 1.27 NA water immersion objectives, an Olympus 60× 1.35 NA oil immersion objective, a 3i laser stack (405, 442, 488, 514, 561, 640nm), 3i “Vector” photomanipulation device, an epifluorescence light source, (Sutter Lambda XL), a Yokogawa CSU-W1 scanning head with dual camera port, two sCMOS cameras (Andor Zyla 4.2), enclosed by an environmental chamber (Haison), and controlled by SlideBook software (3i). Supplementary Figure 1b was acquired using a scanning confocal system (Leica SP2-AOBS) and a 40× 1.25 NA oil immersion objective. Figures 2a, 2b, 5a, and Supplementary Figures 2a, 2c were acquired using a 3D-structured illumination microscope (see below).
3D-structured illumination microscopy (3D-SIM)
3D SIM imaging was performed using a Zeiss Axio Observer.Z1 inverted microscope outfitted with a structured-illumination apparatus60, in which a spatial light modulator (SLM) was used as a phase grating. The sub-millisecond image-loading speed of the SLM allows high-speed SIM pattern switching and live 3D imaging60. Raw images were collected using a 63× 1.2 NA water-immersion objective. Images of the two color channels were recorded on two sCMOS cameras (ORCA Flash 4.0, Hamamatsu), each with dedicated emission filters in front so as to eliminate the time spent between channel switching. The color channel was switched between every z plane to ensure concurrency between the two channels. Image registration between the two cameras was performed using the UCSF Priism software. Reconstructed 3D SIM images were generated from the raw data as described previously61.
Transient transfections of cDNA
For transient transfection of cDNA, 1.5·104 HUVEC/well were plated the day before transfection in glass bottom 96-well plates coated with collagen as described above. The day of the transfection, the culture medium was replaced with 80 μl/well of antibiotics-free EGM2 and the transfection mix, per well 0.2 μg DNA, 0.25 μl Lipofectamine2000 (Life Technologies) diluted in 20 μl OptiMEM, was added following the manufacturer’s protocol. The transfection mix was replaced after 2 h with EGM2 and cells were analyzed 16-24 h later.
Scanning Electron Microscopy
For SEM analysis, cells cultured on 12 mm glass coverslips were fixed for 24 h at 4°C with 4% formaldehyde and 2% glutaraldehyde in 0.1M sodium cacodylate buffer (pH 7.2), rinsed in the same buffer and post-fixed for 1 h with 1% aqueous OsO4. After dehydration in an ascending ethanol series (50, 70, 90, 100 % (2×); 10 min each) samples were critical point dried with liquid CO2 in a Tousimis Autosamdri-815B apparatus (Tousimis), mounted with colloidal graphite on 15 mm aluminum stubs (Electron Microscopy Sciences), and sputter-coated with 50Ά of gold-palladium using a Denton DeskII Sputter Coater (Denton Vacuum). Visualization was performed with a Zeiss Sigma FESEM (Carl Zeiss Microscopy) operated at 2 kV, using inLens SE detection at working distance 4-5 mm. Images were captured in TIFF using 2048×1536 pixels store resolution and a line averaging noise reduction algorithm. For correlative fluorescence-electron microscopy, HUVEC-CDH5-mCitrine plated on film grid-indexed coverslips (Pyser-SGI Limited, CMC34A), were first fixed using formaldehyde (4%, 10 mM HEPES pH 7.4, in PBS) and imaged in PBS using a 20× 0.75 NA Fluar air objective at 0.32 μm pixel resolution. Samples were subsequently fixed with 4% formaldehyde and 2% glutaraldehyde in 0.1M sodium cacodylate buffer (pH 7.2) and prepared for SEM as described above. Tiled fluorescence images were stitched together using the Grid/Collection stitching Plugin62 in FIJI63 and used as a reference during SEM acquisition.
Coordinated cell movement as a function of cell density and confluence
To determine confluence and coordinated cell movement as a function of cell density, HT-HUVEC were plated at increasing densities (0.25·104 to 2.5·104/well) in glass-bottom 96-well plates coated with collagen (see above). 24 h later, cells were stained with Hoechst and imaged for 2.5 h at 10 min intervals using the Hoechst channel and the 4x objective of an automated widefield fluorescence microscope to monitor cell motility (ImageXpress Micro XL, see above). Subsequently, cells were fixed, stained using FITC-phalloidin, anti-VE-cadherin antibody, and images were acquired using a 20× 0.75 NA objective (0.32 μm pixel resolution) and widefield fluorescence illumination. Raw images were background subtracted and thresholded. Confluence was computed as area covered by thresholded FITC-phallodin signal divided by total area and expressed as a function of cell density, which was determined by the number of segmented cell nuclei per area. Coordinated cell movement was computed based on nuclear trajectories as described above and averaged over ten subsequent time points. Data shown in Figures 1c, e are pooled from three independent experiments.
Cadherin finger location relative to cell movement
HT-HUVEC-CDH5-mCitrine were plated at 104 cells/well of a glass-bottom 96-well plated coated with collagen (see above). 24 h later, cells were stained with Hoechst (see above) and imaged using an automated widefield fluorescence microscope (ImageXpress Micro XL, see above), a 20× 0.75 NA objective (0.32 μm pixel resolution), at 4 min intervals, using both the Hoechst and YFP channels. Cell movement was automatically tracked based on nuclear trajectories and the location of incoming and outgoing cadherin fingers along the cellular periphery was determined semi-automatically. The orientation of cadherin fingers relative to the direction of cell movement was computed as the angular difference between the vectors connecting the nuclear centroid and the location of cadherin fingers and the vector of nuclear displacement. Data shown in Figure 1g is from n=522 randomly selected cells, assessing the orientation of 2519 incoming and 2173 outgoing cadherin fingers, pooled from three independent experiments.
Edge velocity tracking and segmentation of cadherin fingers
To facilitate cell segmentation and edge velocity tracking, mosaic monolayers with HT-HUVEC-CDH5-mCitrine and HT-HUVEC-CDH5-mRuby3, plated at a ratio 1:10, were used. Time-lapse sequences were acquired at 1 min intervals for 2 h, using a 40× 1.3 NA objective (0.16 μm pixel resolution) and epifluorescence illumination. For analysis, we focused on individual CDH5-mCitrine-expressing cells that were surrounded by CDH5-mRuby3-expressing cells. Edge velocity tracking was performed as follows. The cell body, and thus cell edges, were defined by a combination of intensity thresholding and edge-detection on the CDH5-mCitrine signal. For each frame, 50 markers were equally spaced along the cell boundary and shifted to minimize the median distance from the markers in the previous frame. This method enabled continuous tracking of markers and uniform spatial sampling of the cell edge. Cadherin fingers were segmented as follows. In order to accentuate the cadherin at the border of the mCitrine-expressing cell, the product of the CDH5-mCitrine and CDH5-mRuby3 images was calculated. Thresholding of local enrichment followed by skeletonization yielded an initial set of lines corresponding to areas of enriched cadherin, and lines proximal to the cell border were isolated for further processing. Branch points were removed, lines were broken into linear segments, proximal co-linear segments were connected, and only segments tangential to their proximal cell border were retained. Finally, the direction of the cadherin fingers was inferred by assuming that the image signal proximal to the tip of cadherin fingers is lower than the image signal proximal to the base of the cadherin fingers.
Cadherin finger location and cell turning
To analyze the spatiotemporal relationship of incoming and outgoing cadherin fingers during cell turning events, we focused on the small but consistent fraction of cells in confluent monolayers of HUVEC that spontaneously underwent significant turning. HT-HUVEC-CDH5-mCitrine were plated at 104 cells/well of a glass-bottom 96-well plated coated with collagen (see above). 24 h later, cells were stained with Hoechst (see above) and imaged using an automated widefield fluorescence microscope (ImageXpress Micro XL, see above), a 20× 0.75 NA objective (0.32 μm pixel resolution), at 4 min intervals for 4 h, using both the Hoechst and YFP channels. To identify turning cells, convex hulls were generated using each cells’ nuclear trajectories and sorted according to the area of the convex hulls. Subsequently, the location of incoming and outgoing cadherin fingers along the cell periphery was determined semi-automatically and their orientation relative to cell movement determined. For each time point and separately for incoming and outgoing cadherin fingers, a lateral bias was computed as the mean angular deviation between the vectors connecting the nuclear centroid and cadherin fingers. The angular bias was computed such that for both incoming and outgoing cadherin fingers, a positive lateral bias indicated more cadherin fingers on the left, a negative lateral bias more cadherin fingers on the right. No lateral bias by either incoming or outgoing cadherin fingers indicated that cadherin fingers of each kind were either distributed equally between the right and the left, or no cadherin fingers were present. Cell turning for each time point t0 was computed as the interpolated change in direction of nuclear displacement vectors connecting the nuclear locations at t−2, t0 and t0, t2. To facilitate comparison between right- and left-turning cells, values for turning and angular bias were mirrored along the axis of movement for right turning cells, so that all right-turning cells became left-turning cells. To establish a temporal order of cadherin finger bias and cell turning, cross-correlation analysis between cadherin finger bias and cell turning was performed. To this end, traces for cell turning and cadherin finger bias were aligned to the time of maximum turning for each cell, and cross-correlation analysis was done using the xcorr function in MATLAB.
Myosin II activity profiles in migrating cells
Myosin II activity was analyzed in mosaic cultures of HT-HUVEC expressing CDH5-mCitrine alone and HT-HUVEC coexpressing CDH5-mCitrine and the stoichiometric F-actin/myosin II activity reporter Ftractin-mCherry-P2A-mTurquoise-MLC. Cells were plated at 2·104 cells per 96-well, at a ratio of 1:10 of cells expressing the Ftractin-mCherry-P2A-mTurquoise-MLC reporter : cells not expressing the reporter. 24 h later, time-lapse sequences of unperturbed mosaic monolayers were acquired using an automated widefield fluorescence microscope (ImageXpress Micro XL, see above), a 20× 0.75 NA objective (0.64 μm pixel resolution), acquiring mTurquoise/mCitrine/mCherry channels at 5 min intervals. Cells were tracked over 45 min (10 time points), masked based on the Ftractin-mCherry signal, and the front-back profiles of the ratio mTurquoise-MLC/Ftractin-mCherry were computed based on background-subtracted images and a 6-pixel (3.84 μm) wide peripheral ring. For each cell analyzed, the front-back profiles were averaged over ten consecutive time points to yield one MLC/Ftractin profile per cell. The length of all profiles was normalized (front-back) to facilitate comparison of profiles between many cells.
Myosin II polarity across junctions
To measure polarization of pMLC antibody signal near cell-cell junctions, images of fixed cells co-stained with VE-cadherin and pMLC antibodies were taken using a 20× 0.75 NA objective and widefield fluorescence illumination. Junctional segments were first classified as either smooth, serrated asymmetric, or serrated symmetric based on VE-cadherin antibody signal. Then, for each junction segment a pair of ROIs was drawn on opposite sides of cell-cell junctions and the mean fluorescence intensity of pMLC within the two ROIs was measured (FIROI1 and FIROI2). For each pair of ROIs, the polarization of pMLC signal was then computed using the following equation:
For serrated asymmetric junctions, ROI1 was on the donor side and ROI2 on the acceptor side of cadherin fingers. For serrated symmetric and smooth junctions, ROI1 was the ROI with FIROI1>FIROI2 to warrant a conservative estimate of asymmetric pMLC localization when the polarity of the junction was unknown.
Response of cadherin finger abundance to synthetic activation of Rac, Rho, and increased contractility during the onset of mitotic cell rounding
Synthetic Rac or Rho activation was achieved by contransfecting HT-HUVEC-CDH5-mCitrine cells with the membrane anchor Lyn11-FRB and either mCherry-FKBP-GEF(TIAM1) or mCherry-FKBP-GEF(ARHGEF1) and inducing plasma membrane translocation of mCherry-FKBP-GEF by adding Rapamycin (100-500 nM). The number of incoming and outgoing cadherin fingers per cell before and 10 min (Rac) or 15 min (Rho) after the addition of Rapamycin was counted. For synthetic Rho activation, only cells that responded to the addition of Rapamycin by increased contractility, and that retained contacts with their neighbors until the end of the experiment were selected for analysis. To monitor the number of incoming/outgoing cadherin fingers before and after onset of mitotic cell rounding, HT-HUVEC-CDH5-mCitrine were imaged at 1 min intervals, and the number of incoming and outgoing cadherin fingers per cell was counted after the onset of mitotic cell rounding (but before cells detached form their neighbors) and 8 min before.
Local optogenetic Rho activation
HUVEC-CDH5-mCitrine were transiently cotransfected with membrane-anchored LOVpep (Stargazin-GFP-LOVpep) and the photorecruitable DH domain of LARG, a RhoA GEF, (PDZ)2-(PDZ)2-mCherry-GEF(LARG)40 at a ratio 5:1. Rho activity was locally stimulated in transfected cells by 455 nm light in small regions using a “Vector” photomanipulation device (3i). Laser power was tuned to 10%, raster block size set to 40, and dwell time to 0.5 ms. Time-lapse sequences of 60 frames, using 515 nm lasers for excitation, were acquired at 30 s intervals and photostimulation was performed 10 times, at 30 s intervals, at frames 11-21. The contractile response of cells to photostimulation ranged from weak local retractions to rapid cell rounding and detachment, depending on expression levels of the transfected constructs and cell morphology. Cells showing a moderate local contractile response were selected for Figure 7.
BAR domain enrichment/depletion analysis on incoming/outgoing cadherin fingers
Enrichment or depletion of AMPH-BAR-mCherry on the surface of cadherin fingers was measured in HT-HUVEC stably expressing CDH5-mCitrine and transiently cotransfected with AMPH-BAR-mCherry and the curvature-insensitive membrane marker CFP-CAAX. Images of live cells expressing all three markers were taken using a 63× 1.2 NA objective and widefield fluorescence illumination. Images were background-subtracted and incoming or outgoing cadherin fingers were identified based on the CDH5-mCitrine signal. Regions of interest (ROIs) were drawn around individual cadherin fingers and mean fluorescence intensities within ROIs were determined for the AMPH-BAR-mCherry and CFP-CAAX channels. The ratio between AMPH-BAR-mCherry and CFP-CAAX in each ROI was calculated and normalized by their ratio in peripheral regions of each cell to account for unequal relative expression levels of the two markers in different cells.
Statistical analysis and reproducibility
Parametric and non-parametric statistical tests to compare differences between groups, as indicated in the figure legends, were selected as appropriate for the data distribution (normal, non-normal, as by the Shapiro-Wilk test), for the number of groups, and for paired or unpaired measurements. Statistically significant differences are indicated as follows: * p<0.05, ** p<0.01, *** p<0.001, **** p<0.0001. Representative results were representative of at least two independent experiments.
Code availability
Computer code is available from authors upon request.
Data availability
All data that support the conclusions are available from the authors on reasonable request.
Supplementary Material
Acknowledgements
We thank Gerald Crabtree, Michael Lin, and Xuedong Liu for providing constructs, Mary Teruel for reagents to generate Giardia-diced siRNA, and the Stanford Shared FACS Facility for support. Elizabeth Wagner and Michael Glotzer generously provided constructs and advice for local Rho activation. We are grateful to Sean Collins, Damien Garbett, Aparna Suvrathan, Gautam Dey, and Milos Galic for helpful discussions and comments on the manuscript. A.H. was supported by postdoctoral fellowships from the Swiss National Science Foundation and from the Human Frontiers Science Program Organization. This work was supported by NIH grants GM063702 and MH095087.
Footnotes
Competing financial interests
The authors declare no competing financial interests.
References
- 1.Friedl P & Gilmour D Collective cell migration in morphogenesis, regeneration and cancer. Nat. Rev. Mol. Cell Biol 10, 445–57 (2009). [DOI] [PubMed] [Google Scholar]
- 2.Mayor R & Etienne-Manneville S The front and rear of collective cell migration. Nat. Rev. Mol. Cell Biol 17, 97–109 (2016). [DOI] [PubMed] [Google Scholar]
- 3.Cai D et al. Mechanical Feedback through E-Cadherin Promotes Direction Sensing during Collective Cell Migration. Cell 157, 1146–1159 (2014). [DOI] [PMC free article] [PubMed] [Google Scholar]
- 4.Reffay M et al. Interplay of RhoA and mechanical forces in collective cell migration driven by leader cells. Nat. Cell Biol 16, 217–223 (2014). [DOI] [PubMed] [Google Scholar]
- 5.Ng MR, Besser A, Danuser G & Brugge JS Substrate stiffness regulates cadherin-dependent collective migration through myosin-II contractility. J. Cell Biol 199, 545–63 (2012). [DOI] [PMC free article] [PubMed] [Google Scholar]
- 6.Khalil A a & Friedl, P. Determinants of leader cells in collective cell migration. Integr. Biol (Camb) 2, 568–74 (2010). [DOI] [PubMed] [Google Scholar]
- 7.Das T et al. A molecular mechanotransduction pathway regulates collective migration of epithelial cells. Nat. Cell Biol 17, 276–87 (2015). [DOI] [PubMed] [Google Scholar]
- 8.Yonemura S, Itoh M, Nagafuchi A & Tsukita S Cell-to-cell adherens junction formation and actin filament organization: similarities and differences between non-polarized fibroblasts and polarized epithelial cells. J. Cell Sci 108, 127–42 (1995). [DOI] [PubMed] [Google Scholar]
- 9.Vasioukhin V, Bauer C, Yin M & Fuchs E Directed actin polymerization is the driving force for epithelial cell-cell adhesion. Cell 100, 209–19 (2000). [DOI] [PubMed] [Google Scholar]
- 10.Millán J et al. Adherens junctions connect stress fibres between adjacent endothelial cells. BMC Biol 8, 11 (2010). [DOI] [PMC free article] [PubMed] [Google Scholar]
- 11.Hoelzle MK & Svitkina T The cytoskeletal mechanisms of cell-cell junction formation in endothelial cells. Mol. Biol. Cell 23, 310–23 (2012). [DOI] [PMC free article] [PubMed] [Google Scholar]
- 12.Taguchi K, Ishiuchi T & Takeichi M Mechanosensitive EPLIN-dependent remodeling of adherens junctions regulates epithelial reshaping. J. Cell Biol 194, 643–56 (2011). [DOI] [PMC free article] [PubMed] [Google Scholar]
- 13.Huveneers S et al. Vinculin associates with endothelial VE-cadherin junctions to control force-dependent remodeling. J. Cell Biol 196, 641–52 (2012). [DOI] [PMC free article] [PubMed] [Google Scholar]
- 14.Ando K et al. Rap1 potentiates endothelial cell junctions by spatially controlling myosin I activity and actin organization. J. Cell Biol 202, 901–916 (2013). [DOI] [PMC free article] [PubMed] [Google Scholar]
- 15.Peglion F, Llense F & Etienne-Manneville S Adherens junction treadmilling during collective migration. Nat. Cell Biol 16, 639–51 (2014). [DOI] [PubMed] [Google Scholar]
- 16.Kametani Y & Takeichi M Basal-to-apical cadherin flow at cell junctions. Nat. Cell Biol 9, 92–8 (2007). [DOI] [PubMed] [Google Scholar]
- 17.Brevier J, Montero D, Svitkina T & Riveline D The asymmetric self-assembly mechanism of adherens junctions: a cellular push-pull unit. Phys. Biol 5, 16005 (2008). [DOI] [PubMed] [Google Scholar]
- 18.van Geemen D et al. F-actin-anchored focal adhesions distinguish endothelial phenotypes of human arteries and veins. Arterioscler. Thromb. Vasc. Biol 34, 2059–2067 (2014). [DOI] [PubMed] [Google Scholar]
- 19.Jakobsson L et al. Endothelial cells dynamically compete for the tip cell position during angiogenic sprouting. Nat. Cell Biol 12, 943–53 (2010). [DOI] [PubMed] [Google Scholar]
- 20.Bentley K et al. The role of differential VE-cadherin dynamics in cell rearrangement during angiogenesis. Nat. Cell Biol 16, 309–21 (2014). [DOI] [PubMed] [Google Scholar]
- 21.Angelini TE et al. Glass-like dynamics of collective cell migration. Proc. Natl. Acad. Sci. U. S. A 108, 4714–9 (2011). [DOI] [PMC free article] [PubMed] [Google Scholar]
- 22.Haga H, Irahara C, Kobayashi R, Nakagaki T & Kawabata K Collective movement of epithelial cells on a collagen gel substrate. Biophys. J 88, 2250–6 (2005). [DOI] [PMC free article] [PubMed] [Google Scholar]
- 23.Vitorino P & Meyer T Modular control of endothelial sheet migration. Genes Dev 1, 3268–3281 (2008). [DOI] [PMC free article] [PubMed] [Google Scholar]
- 24.Schell MJ, Erneux C & Irvine RF Inositol 1,4,5-Trisphosphate 3-Kinase A Associates with F-actin and Dendritic Spines via its N Terminus. J. Biol. Chem 276, 37537–37546 (2001). [DOI] [PubMed] [Google Scholar]
- 25.Peter BJ et al. BAR domains as sensors of membrane curvature: the amphiphysin BAR structure. Science 303, 495–9 (2004). [DOI] [PubMed] [Google Scholar]
- 26.Galic M et al. External push and internal pull forces recruit curvature-sensing N-BAR domain proteins to the plasma membrane. Nat. Cell Biol 14, 874–81 (2012). [DOI] [PMC free article] [PubMed] [Google Scholar]
- 27.Dorland YL et al. The F-BAR protein pacsin2 inhibits asymmetric VE-cadherin internalization from tensile adherens junctions. Nat. Commun 7, 12210 (2016). [DOI] [PMC free article] [PubMed] [Google Scholar]
- 28.Haeger A, Wolf K, Zegers MM & Friedl P Collective cell migration: guidance principles and hierarchies. Trends Cell Biol 25, 556–66 (2015). [DOI] [PubMed] [Google Scholar]
- 29.Collins C & Nelson WJ Running with neighbors: coordinating cell migration and cell-cell adhesion. Curr. Opin. Cell Biol 36, 62–70 (2015). [DOI] [PMC free article] [PubMed] [Google Scholar]
- 30.Etienne-Manneville S Neighborly relations during collective migration. Curr. Opin. Cell Biol 30C, 51–59 (2014). [DOI] [PubMed] [Google Scholar]
- 31.Abu Taha A, Taha M, Seebach J & Schnittler H-J ARP2/3-mediated junction-associated lamellipodia control VE-cadherin-based cell junction dynamics and maintain monolayer integrity. Mol. Biol. Cell 25, 245–56 (2014). [DOI] [PMC free article] [PubMed] [Google Scholar]
- 32.Lou SS, Diz-Munoz A, Weiner OD, Fletcher DA & Theriot JA Myosin light chain kinase regulates cell polarization independently of membrane tension or Rho kinase. J. Cell Biol 209, 275–288 (2015). [DOI] [PMC free article] [PubMed] [Google Scholar]
- 33.Farooqui R & Fenteany G Multiple rows of cells behind an epithelial wound edge extend cryptic lamellipodia to collectively drive cell-sheet movement. J. Cell Sci 118, 51–63 (2005). [DOI] [PubMed] [Google Scholar]
- 34.Asokan SB et al. Mesenchymal Chemotaxis Requires Selective Inactivation of Myosin II at the Leading Edge via a Noncanonical PLCδ/PKCα Pathway. Dev. Cell 31, 747–60 (2014). [DOI] [PMC free article] [PubMed] [Google Scholar]
- 35.Theveneau E et al. Chase-and-run between adjacent cell populations promotes directional collective migration. Nat. Cell Biol 15, 1–12 (2013). [DOI] [PMC free article] [PubMed] [Google Scholar]
- 36.Inoue T, Heo W. Do Grimley JS, Wandless TJ & Meyer T An inducible translocation strategy to rapidly activate and inhibit small GTPase signaling pathways. Nat. Methods 2, 415–418 (2005). [DOI] [PMC free article] [PubMed] [Google Scholar]
- 37.Maddox AS & Burridge K RhoA is required for cortical retraction and rigidity during mitotic cell rounding. J. Cell Biol 160, 255–265 (2003). [DOI] [PMC free article] [PubMed] [Google Scholar]
- 38.Matthews HK et al. Changes in Ect2 Localization Couple Actomyosin-Dependent Cell Shape Changes to Mitotic Progression. Dev. Cell 23, 371–383 (2012). [DOI] [PMC free article] [PubMed] [Google Scholar]
- 39.Tatsumoto T, Xie X, Blumenthal R, Okamoto I & Miki T Human ECT2 Is an Exchange Factor for Rho GTPases, Phosphorylated in G2/M Phases, and Involved in Cytokinesis. Cell 147, 921–927 (1999). [DOI] [PMC free article] [PubMed] [Google Scholar]
- 40.Wagner E & Glotzer M Local RhoA activation induces cytokinetic furrows independent of spindle position and cell cycle stage. J. Cell Biol 213, 641–49 (2016). [DOI] [PMC free article] [PubMed] [Google Scholar]
- 41.Phng L-K et al. Formin-Mediated Actin Polymerization at Endothelial Junctions Is Required for Vessel Lumen Formation and Stabilization. Dev. Cell 32, 123–132 (2015). [DOI] [PubMed] [Google Scholar]
- 42.Wilson CW et al. Rasip1 regulates vertebrate vascular endothelial junction stability through Epac1-Rap1 signaling. Blood 122, 3678–90 (2013). [DOI] [PMC free article] [PubMed] [Google Scholar]
- 43.Arrieumerlou C & Meyer T A local coupling model and compass parameter for eukaryotic chemotaxis. Dev. Cell 8, 215–27 (2005). [DOI] [PubMed] [Google Scholar]
- 44.Swaney KF, Huang C-H & Devreotes PN Eukaryotic chemotaxis: a network of signaling pathways controls motility, directional sensing, and polarity. Annu. Rev. Biophys 39, 265–89 (2010). [DOI] [PMC free article] [PubMed] [Google Scholar]
Supplementary References
- 45.Young L, Sung J, Stacey G & Masters JR Detection of Mycoplasma in cell cultures. Nat. Protoc 5, 929–34 (2010). [DOI] [PubMed] [Google Scholar]
- 46.Bajar BT et al. Improving brightness and photostability of green and red fluorescent proteins for live cell imaging and FRET reporting. Sci. Rep 6, 20889 (2016). [DOI] [PMC free article] [PubMed] [Google Scholar]
- 47.Gibson DG et al. Enzymatic assembly of DNA molecules up to several hundred kilobases. Nat. Methods 6, 343–5 (2009). [DOI] [PubMed] [Google Scholar]
- 48.Conway DE et al. Fluid Shear Stress on Endothelial Cells Modulates Mechanical Tension across VE-Cadherin and PECAM-1. Curr. Biol 23, 1024–30 (2013). [DOI] [PMC free article] [PubMed] [Google Scholar]
- 49.Wollman R & Meyer T Coordinated oscillations in cortical actin and Ca2+ correlate with cycles of vesicle secretion. Nat. Cell Biol 14, 1261–9 (2012). [DOI] [PMC free article] [PubMed] [Google Scholar]
- 50.Szymczak-Workman AL, Vignali KM & Vignali DAA Design and construction of 2A peptide-linked multicistronic vectors. Cold Spring Harb. Protoc 2012, 199–204 (2012). [DOI] [PubMed] [Google Scholar]
- 51.Ferreira JP, Overton KW & Wang CL Tuning gene expression with synthetic upstream open reading frames. Proc. Natl. Acad. Sci. U. S. A 110, 11284–9 (2013). [DOI] [PMC free article] [PubMed] [Google Scholar]
- 52.Counter CM et al. Dissociation among in vitro telomerase activity, telomere maintenance, and cellular immortalization. Proc. Natl. Acad. Sci. U. S. A 95, 14723–8 (1998). [DOI] [PMC free article] [PubMed] [Google Scholar]
- 53.Yang HW et al. Cooperative Activation of PI3K by Ras and Rho Family Small GTPases. Mol. Cell 47, 281–290 (2012). [DOI] [PMC free article] [PubMed] [Google Scholar]
- 54.Hart MJ et al. Identification of a novel guanine nucleotide exchange factor for the Rho GTPase. J. Biol. Chem 271, 25452–25458 (1996). [DOI] [PubMed] [Google Scholar]
- 55.Campeau E et al. A versatile viral system for expression and depletion of proteins in mammalian cells. PLoS One 4, e6529 (2009). [DOI] [PMC free article] [PubMed] [Google Scholar]
- 56.Tsai F-C et al. A polarized Ca2+, diacylglycerol and STIM1 signalling system regulates directed cell migration. Nat. Cell Biol. 16, 133–44 (2014). [DOI] [PMC free article] [PubMed] [Google Scholar]
- 57.Tsai F-C & Meyer T Ca2+ pulses control local cycles of lamellipodia retraction and adhesion along the front of migrating cells. Curr. Biol 22, 837–42 (2012). [DOI] [PMC free article] [PubMed] [Google Scholar]
- 58.Otsu N A Threshold Selection Method from Gray-Level Histograms. IEEE Trans. Syst. Man Cybern SMC-9, 62–66 (1979). [Google Scholar]
- 59.Edelstein A, Amodaj N, Hoover K, Vale R & Stuurman N Computer control of microscopes using μManager. Curr. Protoc. Mol. Biol. Chapter 14, Unit14.20 (2010). [DOI] [PMC free article] [PubMed] [Google Scholar]
- 60.Fiolka R, Shao L, Rego EH, Davidson MW & Gustafsson MGL Time-lapse two-color 3D imaging of live cells with doubled resolution using structured illumination. Proc. Natl. Acad. Sci. U. S. A 109, 5311–5 (2012). [DOI] [PMC free article] [PubMed] [Google Scholar]
- 61.Gustafsson MGL et al. Three-dimensional resolution doubling in wide-field fluorescence microscopy by structured illumination. Biophys. J 94, 4957–70 (2008). [DOI] [PMC free article] [PubMed] [Google Scholar]
- 62.Preibisch S, Saalfeld S & Tomancak P Globally optimal stitching of tiled 3D microscopic image acquisitions. Bioinformatics 25, 1463–5 (2009). [DOI] [PMC free article] [PubMed] [Google Scholar]
- 63.Schindelin J et al. Fiji: an open-source platform for biological-image analysis. Nat. Methods 9, 676–82 (2012). [DOI] [PMC free article] [PubMed] [Google Scholar]
Associated Data
This section collects any data citations, data availability statements, or supplementary materials included in this article.
Supplementary Materials
Data Availability Statement
All data that support the conclusions are available from the authors on reasonable request.