

Summary
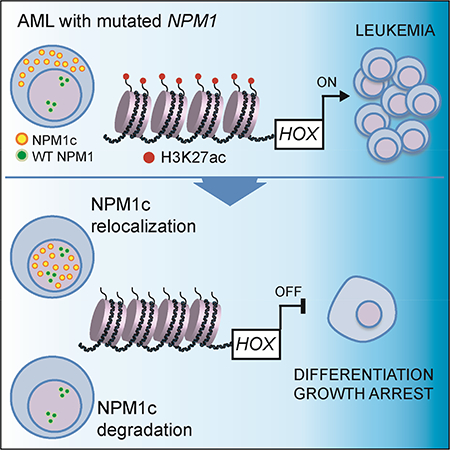
NPM1 is the most frequently mutated gene in cytogenetically normal acute myeloid leukemia (AML). In AML cells, NPM1 mutations result in abnormal cytoplasmic localization of the mutant protein (NPM1c), however it is unknown whether NPM1c is required to maintain the leukemic state. Here, we show that loss of NPM1c from the cytoplasm, either through nuclear relocalization or targeted degradation, results in immediate downregulation of homeobox (HOX) genes followed by differentiation. Finally, we show that XPO1 inhibition relocalizes NPM1c to the nucleus, promotes differentiation of AML cells, and prolongs survival of Npm1mutated leukemic mice. We describe an exquisite dependency of NPM1-mutant AML cells on NPM1c, providing the rationale for the use of nuclear export inhibitors in AML with mutated NPM1.
Keywords: NPM1, acute myeloid leukemia, AML, HOX, MEIS1, CRISPR-Cas9, dTAG, Selinexor
In Brief
Brunetti et al. show that specific loss of NPM1c from the cytoplasm leads to downregulation of HOX genes and differentiation in NPM1 mutant AML. Blocking NPM1c nuclear export by XPO1 inhibition reduces cytoplasmic NPM1c, promotes AML differentiation, and prolongs the survival of a mouse model of NPM1c+ AML.
Graphical Abstract
Introduction
Nucleophosmin (NPM1) is an abundant multifunctional nucleolar protein involved in the maintenance of genome stability and ribosome biogenesis (Grisendi et al., 2006). NPM1 is the most frequently mutated gene in cytogenetically normal acute myeloid leukemia (AML) (Falini et al., 2005; Falini et al., 2015; Schlenk et al., 2008). NPM1 mutations are considered AMLinitiating lesions, being highly associated with frank leukemia, absent in clonal hematopoiesis, and detectable in all leukemic cells in patients with NPM1-mutated leukemia (Grimwade et al., 2016; Ivey et al., 2016).
NPM1 mutations are almost invariably small insertions in the terminal exon that result in the loss of the nucleolar localization signal and the generation of a novel C-terminal nuclear export signal (NES) (Bolli et al., 2007; Falini et al., 2006). Consequently, in contrast with the nucleolar localization of the wild-type (WT) protein, the mutant protein is aberrantly localized in the cytoplasm of leukemic cells (NPM1-cytoplasmic or NPM1c). NPM1 mutations in AML are always heterozygous (Falini et al., 2007), and WT NPM1 is essential for cell survival (Grisendi et al., 2005).
Several studies have indicated the cytoplasmic dislocation of NPM1 in AML is critical to its oncogenicity (Falini et al., 2009). All NPM1 mutations act to maximize the export of the mutant to the cytoplasm, including rare mutations found outside of exon 12 (Falini et al., 2009), and in the infrequent NPM1 leukemic mutants with residual nucleolar targeting ability, stronger NESs are selected (Bolli et al., 2007). In spite of these findings, a functional requirement for NPM1c and its nuclear export for maintenance of the leukemic state has not been demonstrated.
While mutant NPM1 is an attractive therapeutic target as it is highly expressed, its similarity to the WT protein, and the cell survival requirement for WT NPM1, has thus far prevented the development of therapeutics directed against NPM1 itself. However, if NPM1mutant AML is actually dependent on the nuclear export of NPM1c, disruption of its export could offer an alternative therapeutic strategy for the large fraction of AML patients that harbor NPM1 mutations.
The downstream mechanisms through which NPM1c may act could also offer a point of intervention, but they are poorly understood. NPM1-mutant AML cells display a unique gene expression profile, characterized by high expression of multiple members of the HOXA and HOXB clusters (Alcalay et al., 2005; Spencer et al., 2015). HOX gene upregulation in AML is thought to reflect a stem cell-like state (Spencer et al., 2015), but may also contribute to pathogenesis. Thus, the degree to which HOX gene upregulation is directly dependent on NPM1c, or simply reflects the differentiation state, has been debated. In this work, we aimed to elucidate the role of HOX gene expression in AML using allele-specific gene editing of NPM1 and pharmacologic inhibition of nuclear export.
RESULTS
Allele-specific editing of NPM1c results in nuclear relocalization of mutant NPM1
We first sought to establish a strategy for specific manipulation of the mutant NPM1 allele (herein referred to as NPM1c), while leaving the WT allele intact. We reasoned that the specificity of CRISPR-Cas9 targeting, combined with the high efficiency of introducing Cas9sgRNA ribonucleoprotein complexes (RNPs) into hematopoietic cells (Gundry et al., 2016), would enable specific NPM1c targeting. Our initial goal was to introduce indels in the NPM1c allele that would disrupt the nuclear export signal, potentially relocalizing the mutant protein to the nucleus. We thus designed an sgRNA (sgNPM1c) spanning the C-terminal 4 bp insertion that characterizes NPM1 mutation A (herein NPM1mutA) (Figure 1A), found in both OCI-AML3 and IMS-M2 AML cell lines (Chi et al., 2010; Quentmeier et al., 2005).
Figure 1. Allele-specific targeting of NPM1c relocalizes mutant NPM1 to the nucleus.

(A) Schematic representation of the allele-specific editing strategy. An sgRNA spanning the 4 bp insertion of NPM1 mutant A (sgNPM1c) was designed to specifically target the mutant allele.
(B) The nucleotide sequence, C-terminal amino-acid sequence, and corresponding allele frequency (n=3; mean ± SEM) of the most represented mutant alleles observed following amplicon sequencing of OCI-AML3 cells transfected with sgNPM1c.
(C) Immunofluorescence with an antibody against the N-terminus of NPM1 (total NPM1) 4 days after transfection with the indicated sgRNA. An unedited cell with cytoplasmic protein is shown (white arrow). Scale bar: 20 μm.
(D) Immunoblot of total NPM1 (top) and NPM1c C-terminal epitope (middle) 4 days after transfection with the indicated sgRNA. See also Figure S1 and Table S1.
Electroporation of Cas9-sgNPM1c RNPs (referred to henceforth by indicating the guide RNA only (sgNPM1c)) into OCI-AML3 cells led to efficient indel generation at the mutant allele (86 ± 2% of sequenced alleles) with no evidence of indels at the WT allele (Figure 1B and Table S1). To examine the localization of the resulting edited alleles, we generated constructs in which the 3’ end of NPM1 was replaced with each of the four most frequently observed alleles (Figure 1B) along with an N-terminal GFP tag (Figure S1A), and expressed these constructs in 293T cells. All tested alleles resulted in mutant NPM1 proteins with nuclear localization (Figure S1B). In both OCI-AML3 and IMS-M2 cells transfected with sgNPM1c, immunofluorescence with an antibody against the N-terminus of NPM1 confirmed the loss of cytoplasmic NPM1 (Figure 1C). Western blot analysis showed no change in the level of total NPM1, but loss of the C-terminal mutant epitope (Figures 1D and S1C), confirming efficient disruption of the mutant allele, without affecting protein levels. Altogether, these results demonstrate that CRISPR-Cas9 can be used to specifically target the NPM1c allele, resulting in nuclear relocalization of mutant NPM1, while leaving the WT NPM1 allele intact.
Nuclear relocalization of NPM1c induces differentiation and cell growth arrest of AML cells
We next sought to study the phenotypic impact of NPM1c relocalization to the nucleus. To obtain clones with edited NPM1c, we plated 150 individual OCI-AML3 cells that had been transfected with sgNPM1c. Strikingly, only 4 clones were recovered, all of which were unedited (not shown), suggesting that nuclear relocalization of NPM1c may result in a proliferative defect.
We therefore assessed the impact of nuclear relocalization of NPM1c on cell growth using a pool of edited cells. As anticipated, NPM1c editing significantly impaired the growth of OCI-AML3 and IMS-M2 cells beginning respectively at day 9 and day 5 post-electroporation (Figures 2A and S2A). Because the majority of cells (~80%), but not all, were efficiently targeted by sgNPM1c (Table S1), we reasoned that the small residual fraction of unedited AML cells would outcompete edited cells over time. Indeed, sequencing of the NPM1c locus to assess the proportion of edited cells at day 3 versus day 12 post-transfection revealed a drop from nearly 80% to ~4%, indicating significant selection against cells with a disrupted Cterminal NES (Figure 2B). The selective growth advantage of cells lacking edited NPM1c was also observed in OCI-AML3 cells transplanted into NSG mice (Figures S2B and S2C).
Figure 2. Nuclear relocalization of NPM1c induces cell growth arrest and differentiation in AML cell lines.

(A) Viable cell counts by trypan blue exclusion of OCI-AML3 (O3; NPM1c+) and OCI-AML2 (O2; NPM1 WT) cells transfected with Cas9 only, a guide targeting CD19 (sgCD19), or sgNPM1c. Equal numbers of cells were plated 5 days after electroporation. Results are reported as ratio to Cas9 only control. (OCI-AML3 n=3, OCI-AML2 n=2; mean ± SEM).
(B) Indel frequencies at targeted loci (i.e. CD19, CD45 and NPM1c) calculated by highthroughput amplicon sequencing at days 3 and 12 after electroporation with indicated sgRNAs (n=3, mean ± SEM).
(C) May-Grünwald Giemsa staining of OCI-AML3 and IMS-M2 cells 9 and 6 days, respectively, after transfection with the indicated sgRNA. Arrows indicate azurophilic granules. Scale bar: 20 μm.
(D) Flow cytometry analysis of CD11b expression in OCI-AML3 cells 9 days after electroporation. Left panel shows distribution of CD11b signal in cells transfected with sgRNAs against the indicated genes (CD19 and CD45 serving as controls). Right panel shows the percentage of CD11b+ cells (n=6; mean ± SEM). The cut-off point for CD11b positivity was set at the last one percentile of the gaussian curve of Cas9 only controls.
(E) Flow cytometry analysis of myeloperoxidase (MPO) expression in IMS-M2 cells 6 days after electroporation. Left panel shows distribution of MPO signal for indicated sgRNA. Right panel shows the percentage of MPO+ cells (n=6; mean ± SEM). The cut-off point for MPO positivity was set at the last one percentile of the gaussian curve of Cas9 only controls.
(F) Cell cycle analysis by BrdU incorporation and 7-AAD 5 and 9 days following electroporation with sgNPM1c and controls (n=3, mean ± SEM). * p<0.05, ** p<0.01, *** p<0.001; unpaired t-test with Welch’s correction. See also Figure S2 and Table S2.
After evaluating cell growth, we asked whether nuclear relocalization of NPM1c was inducing differentiation in NPM1-mutant cells. Indeed, transfection with sgNPM1c, but not with control sgRNAs (targeting genes for CD19 or CD45), resulted in morphological differentiation of both OCI-AML3 and IMS-M2. Specifically, OCI-AML3 cells acquired mature monocytic morphology 9 days after electroporation, while IMS-M2 developed azurophilic granules, suggesting granulocytic differentiation, 6 days after electroporation (Figure 2C). Differentiation was confirmed by flow cytometry at the same timepoints. Transfection with sgNPM1c significantly increased CD11b and CD14 expression in OCI-AML3 cells (Figures 2D and S2D) and myeloperoxidase (MPO) expression in IMS-M2 cells (Figure 2E). To demonstrate that differentiation was induced only in cells with disrupted C-terminal NES, we FACS sorted undifferentiated and differentiated OCI-AML3 cells and confirmed that editing of the NPM1c allele was specific to differentiated cells (Figure S2E and Table S2). Finally, we analyzed the cell cycle with flow cytometry in OCI-AML3 cells transfected with sgNPM1c or controls. While no differences in G1, S and G2 phase were detected at day 5, cells transfected with sgNPM1c underwent significant G1 arrest at day 9 (Figures 2F and S2F) after electroporation. Importantly, the G1 arrest was nearly ubiquitous in differentiated cells (Figure S2G).
We next assessed the impact of nuclear relocalization of NPM1c in an NPM1c/FLT3ITD/ITD primary derived xenograft model (PDX2) and in primary patient AML samples. Both PDX2 and primary AML samples harboring NPM1mutA transfected with sgNPM1c displayed immunophenotypic (Figures 3A and 3B) and morphologic (Figure S3A) differentiation, most pronounced between day 9 and day 12 after electroporation. Of note, primary AML samples with mutated NPM1 underwent differentiation irrespective of cooccurring mutations (Table S3), while no differences in CD11b expression were seen in NPM1 WT samples transfected with sgNPM1c compared to controls (Figure 3B). To confirm that differentiation was induced only in edited cells, we performed high-throughput amplicon sequencing of FACS-sorted undifferentiated and differentiated primary cells (Pt. 004), confirming that only differentiated cells had a disrupted NPM1c C-terminus (Figure S3B and Table S4).
Figure 3. Nuclear relocalization of NPM1c induces cell growth arrest and differentiation in primary AML cells.

(A) Flow cytometry analysis of CD11b expression in PDX2 cells 9 days after electroporation. Left panel shows distribution of CD11b signal after treatment with the indicated sgRNA. Right panel shows the percentage of CD11b+ cells (n=4; mean ± SEM). The cut-off point for CD11b positivity was set at the last percentile of the gaussian curve of Cas9 only controls.
(B) CD11b expression analysis by flow cytometry in 3 NPM1-mutant primary AML samples (top) and 3 NPM1 WT samples (bottom) transfected with sgNPM1c or control sgRNA targeting CD19 (sgCD19), analyzed at day 12 following electroporation. A table with the genetic characteristics of the primary samples is provided in Table S3.
(C) Schematic representation of the in vivo experiment with PDX2 cells. Cells were harvested from subcutaneous masses and cultured for 48 hr. For each replicate 6×10⁵ cells were electroporated with sgCD19, sgCD45 or sgNPM1c and left in culture for additional 24 hr. Each one of replicates was subcutaneously injected into NSG recipients. Resulting masses were allowed to grow for 6 weeks and then harvested for DNA purification.
(D) Indel frequencies at targeted loci (i.e. CD19, CD45 and NPM1c) calculated by highthroughput amplicon sequencing at the time of transplant and on leukemic cells harvested from masses (purple circles in Figure 3C) (n=3; mean ± SEM). * p<0.05, ** p<0.01, *** p<0.001; unpaired t-test with Welch’s correction. See also Figure S3 and Tables S3 and S4.
To demonstrate that nuclear relocalization of NPM1c imparts a cell growth defect in vivo, we transfected cells with sgNPM1c or control sgRNAs and performed subcutaneous injections into NSG mice (Figure 3C). Consistent with the OCI-AML3 data, even though we injected PDX2 cells that had a ~40% indel frequency (Table S4), we observed almost complete loss of edited NPM1c alleles (0.1 ± 0.1%) 6 weeks following injection (Figure 3D). PDX2 cells transfected with control sgRNAs showed no evidence of in vivo selection (Figure 3D). Taken together, cell line and primary sample data support the conclusion that the maintenance of the leukemic phenotype, defined by proliferation and lack of differentiation, is dependent on an intact NPM1c C-terminal nuclear export signal.
NPM1-mutant AML cell differentiation and growth arrest are dependent on the nuclear/cytoplasmic ratio of NPM1c
The indels created above disrupted the C-terminal NES, but did not regenerate the nucleolar localization signal of the WT NPM1 allele. Therefore, we considered whether different levels of nuclear, or nucleolar, localization would have different biological effects. We sought to introduce specific test alleles into the endogenous locus to ensure normal expression levels relative to the remaining WT protein.
We optimized conditions to introduce into the mutant NPM1 allele via homology-directed repair (HDR) particular variants along with a GFP fusion to track edited cells over time (Figure 4A). This knock-in strategy resulted in up to ~2% GFP-tagged cells (Figure 4B), the vast majority of which exhibited precise editing, as confirmed by PCR and Sanger sequencing of the NPM1 endogenous locus (Figures S4A and S4B). Thus, we generated OCI-AML3 and IMS-M2 cells with full correction of the NPM1c to a WT allele (fused to GFP; NPM1WT/WT-GFP cells) resulting in complete nucleolar localization of GFP, immunophenotypic differentiation (analyzed at day 9 in OCI-AML3 and day 6 in IMS-M2) and loss of the edited cells due to competition with unedited cells over the course of 15 days (Figure 4B and 4C).
Figure 4. Leukemic phenotype of AML with mutated NPM1 is dependent on the nuclear/cytoplasmic ratio of NPM1c.

(A) Schematic representation of precise editing strategy of the C-terminus of the NPM1c allele through homology-directed repair (HDR).
(B) Flow cytometry plots showing precisely edited OCI-AML3 and IMS-M2 cells (GFP+) at days 6 and15 following correction of the NPM1 mutant allele to the WT sequence.
(C) HDR templates used for precise editing of the NPM1c allele (left). Fluorescence microscopy showing sub-cellular localization (middle) and flow cytometry showing immunophenotypic differentiation features including CD11b (OCI-AML3) and MPO (IMS-M2) (right). MFI=median fluorescence intensity. Scale bar: 25 μm.
(D) Percentages of edited cells (GFP+) over 15 days. The cut-off point for GFP positivity was set at the last percentile of the gaussian curve of sgNPM1c-only transfected cells (n=7 for OCIAML3, n=5 for IMS-M2; mean ± SEM). See also Figure S4.
Using the same strategy, we knocked-in four alleles with a disrupted C-terminal NES (AlleleX-GFP; Alleles 1–4 in Figure 1B). Each of these displayed nuclear localization of GFP and similar patterns of differentiation and cell growth as NPM1WT/WT-GFP cells (Figure 4C and4D). To verify that differentiation and growth arrest were secondary to the loss of the NES and not to the presence of the GFP at the C-terminus, we repeated the experiment using the same four alleles, adding the auto-cleaving peptide P2A between the C-terminus of NPM1 and GFP (Figure S4C) and confirmed similar patterns of differentiation and cell growth (Figure S4C and S4D).
We then generated a simple GFP knock-in retaining NPM1 mutation A (MutA-GFP), as well as an additional allele with a second NES (MutA-GFP-NES) to enforce cytoplasmic localization of mutant NPM1. Strikingly, NPM1WT/MutA-GFP cells showed both cytoplasmic and nuclear localization of NPM1-GFP, whereas NPM1WT/MutA-GFP-NES cells exhibited nearly complete cytoplasmic localization (Figure 4C). Their differentiation behavior was proportional to the nuclear/cytoplasmic ratio of NPM1-GFP. Cells with the NPM1WT/MutA-GFP-NES genotype remained completely undifferentiated and were not outcompeted in either cell line, whereas NPM1WT/MutA-GFP cells underwent intermediate differentiation and were outcompeted, albeit at a slower rate than cells with fully nuclear NPM1-GFP (Figures 4C, 4D and S4E). The differentiation behavior of the NPM1WT/MutA-GFP cells compared to those with two NESs indicates that even slight perturbation of the C-terminal NES, caused by the GFP fusion, confers a diminution of the leukemic phenotype.
Together, these experiments unequivocally establish that cell proliferation and maintenance of an undifferentiated state in NPM1-mutant cells is tightly associated with the nuclear/cytoplasmic ratio of NPM1. Furthermore, the data confirm that differentiation and cell growth cessation in leukemic NPM1c+ cells observed upon nuclear relocalization of mutant NPM1 is indistinguishable from that obtained through correction of the mutant to the wild-type allele.
Addition of the second NES allowed us to create a stable GFP-tagged OCI-AML3 cell line (NPM1WT/MutA-GFP-NES) that could be propagated indefinitely. These cells remained sensitive to NPM1c disruption, as an sgRNA (sgNPM1c‡) targeting the same region as sgNPM1c (Figure S4F) resulted in disruption of the reading frame, loss of GFP signal, differentiation and growth arrest of cells beginning at day 9 after electroporation (Figure S4G and S4H). The GFP marker allowed us to screen and sort for pure populations of unedited (GFP positive) and edited (GFP negative) cells, prior to immunophenotypic differentiation (Figure S4I), and to assess the impact of NPM1c editing on AML progression in vivo. As expected, disruption of the C-terminus led to a significant survival advantage (Figure S4J) confirming that cytoplasmic NPM1c is necessary for maintenance of the leukemic phenotype in vivo.
Nuclear relocalization of NPM1c results in disruption of the HOX/MEIS1 program
The rapid loss of the leukemic phenotype upon nuclear relocalization of mutant NPM1 prompted us to use this system to probe the molecular changes that follow elimination of cytoplasmic NPM1c. We examined the transcriptome of OCI-AML3 and IMS-M2 cells 3 days after transfection with sgNPM1c. Differential expression analysis revealed loss of the transcriptional signature (Alcalay et al., 2005) that characterizes NPM1c+ AML (Figure S5A). We identified 16 genes with at least two-fold downregulation (p<0.01) in common with both cell types (Figure 5A and Table S5). Half of the downregulated genes belonged to the HOXA cluster, HOXB cluster, or MEIS1 (hereafter referred to as HOX/MEIS1) (Figures 5A–5C).
Figure 5. Nuclear relocalization of NPM1c induces HOX/MEIS1 downregulation.

(A) Heatmaps and Venn diagram showing genes downregulated >2 fold (p<0.01) in OCI-AML3 and IMS-M2 cells 3 days after transfection with sgNPM1c, compared to control sgRNAs (sgCD19 and sgCD45). The 16 genes downregulated in both cell lines are listed. Size of text corresponds to significance of downregulation. (n=2 for OCI-AML3, n=3 for IMS-M2; p value derived from two-tailed Student’s t-test).
(B) Volcano plots depicting differentially expressed genes in OCI-AML3 cells transfected with sgNPM1c compared with control sgRNAs. (n=2; p value derived from two-tailed Student’s ttest).
(C) Volcano plot depicting differentially expressed genes in IMS-M2 cells transfected with sgNPM1c compared with control sgRNAs. (n=3; p value derived from two-tailed Student’s ttest).
(D) Gene track view of H3K27me3, H3K4me3, and H3K27ac ChIP-seq signal at distal HOXA locus 3 days after transfection of sgCD45 (black) or sgNPM1c (red) into OCI-AML3 cells.
(E) Enhancers in OCI-AML3 or IMS-M2 cells ranked by increasing H3K27ac signal. The cut-off discriminating typical enhancers (grey) from super-enhancers (red) is depicted with vertical and horizontal dashed lines.
(F) Waterfall plot depicting change in H3K27ac ChIP-seq signal at super-enhancers 3 days after transfection of sgNPM1c or sgCD45 control in OCI-AML3 and IMS-M2 cells. Genes associated with myeloid differentiation are depicted in grey. See also Figure S5 and Table S5.
Since recent data suggest that HOX/MEIS1 are regulated at the chromatin level in NPM1-mutant leukemias (Kuhn et al., 2016), we assessed the effect of nuclear relocalization of NPM1c on the epigenetic state at HOX/MEIS1 loci. We performed ChIP sequencing for histone marks associated with active (H3K4me3 and H3K27ac) or repressive (H3K27me3) chromatin in OCI-AML3 cells 3 days after electroporation. While minimal H3K27me3 changes were observed, substantial loss of H3K4me3 and H3K27ac was found at HOX/MEIS1 (Figure 5D and S5B).
The striking reduction of the enhancer mark, H3K27ac, prompted us to assess the genome-wide distribution of enhancer activity following nuclear relocalization of NPM1c. We characterized and compared the H3K27ac-defined enhancer landscape in sgNPM1c or control (sgCD45) transfected OCI-AML3 and IMS-M2 cells. We found that HOXA and HOXB clusters as well as MEIS1 could be classified as super-enhancers by the ROSE2 (Rank Ordering of Super-Enhancers 2) algorithm (Brown et al., 2014) (Figure 5E). Moreover, the HOX/MEIS1 super-enhancers were among those enhancers with the highest loss of signal following transfection with sgNPM1c (Figure 5F). The magnitude of the transcriptional and epigenetic changes at HOX/MEIS1 loci suggested that HOX proteins might act as master transcription factors (TFs) in NPM1-mutant AML cells.
HOXA and HOXB cluster genes are highly expressed in HSCs and are critical for their self-renewal (Argiropoulos and Humphries, 2007; Sauvageau et al., 1994). Furthermore, ectopic expression of HOX family members promotes generation of HSCs from pluripotent cells, implicating them as master regulators of the hematopoietic lineage (Doulatov et al., 2013; Kyba et al., 2002; Wang et al., 2005). A hallmark of such master TFs is that they are expressed in a cell-type specific manner, co-occupy super-enhancers, and regulate their own expression through autoregulatory loops. Master TFs have also been shown to control the differentiated cell states (Whyte et al., 2013). To determine whether the altered superenhancer landscape observed upon nuclear relocalization of NPM1c could be explained by disruption of one or more master TFs, we modeled the core regulatory circuitry (Lin et al., 2016) of OCI-AML3 cells and IMS-M2 cells transfected with sgNPM1c or controls (sgCD45). Multiple HOXA and HOXB cluster genes were present in the core regulatory circuitries of OCIAML3 (Figure S5C) and IMS-M2 cells (Figure S5D), and HOX were the only TFs that displayed dynamic changes in their core circuitry connectivity scores following nuclear relocalization of NPM1c (Figures S5C-S5E). Specifically, HOX-driven connectivity was markedly reduced, suggesting downregulation of their targets in concert with reduction in HOX/MEIS1 expression and enhancer activity. Altogether, these results indicate that nuclear relocalization of NPM1c disrupts the HOX transcriptional program, strongly correlating with the loss of the leukemic phenotype.
Targeted degradation of endogenous NPM1c links HOX/MEIS1 expression to cytoplasmic NPM1
While the data above implicate NPM1c in maintaining high expression of the HOX/MEIS1 program, the 3 day time-lag between NPM1c editing, nuclear relocalization, and molecular analysis prevented a direct causal link from being established. Thus, we sought to establish a framework in which we could rapidly eliminate cytoplasmic NPM1c and examine the consequences for HOX/MEIS1 expression. To this end, we used our CRISPR-knock-in strategy to tag endogenous NPM1c with an FKBP-based degron (Nabet et al., 2018), to enable inducible NPM1c degradation.
Specifically, we knocked-in an FKBP12 (F36V) fragment fused to GFP (NPM1c-dTagGFP-NES, or Degron 1) into the endogenous NPM1 mutant allele in OCI-AML3 and IMS-M2 cells (Figure 6A). To avoid potential confounding effects of the bulky GFP tag, we also generated an additional degron knock-in allele in which NPM1c-FKBP12 (F36V) and GFP are separated by the sequence of a P2A self-cleaving peptide (NPM1c-dTag-P2A-GFP or Degron 2) (Figure 6A). Amplicon sequencing verified the structures (not shown), and fluorescence microscopy of NPM1WT/Degron1 OCI-AML3 cells confirmed almost complete cytoplasmic localization of the fusion protein (Figure S6A). These cell lines could be maintained indefinitely. Due to impaired growth of IMS-M2 cells at low cell concentrations, experiments were performed on GFP-positive pooled cells, while OCI-AML3 experiments were performed on GFP-positive single cell-derived clones.
Figure 6. Targeted degradation of NPM1c induces cell growth arrest, differentiation and rapid downregulation of HOX/MEIS1.

(A) Homology recombination templates used for targeted degradation of mutant NPM1.
(B) Kinetics of Degron1 fusion protein degradation in NPM1WT/Degron1 OCI-AML3 (Clone 2) and IMS-M2 cells (bulk) following treatment with 500 nM dTAG-47 or DMSO as assessed by flow cytometry at multiple time points. Fold changes were calculated as ratio of GFP median fluorescence intensity (MFI) of dTAG-47-treated and DMSO-treated cells. (n=3; mean ± SEM).
(C) Scatter plot showing differentially expressed genes in NPM1WT/Degron1 OCI-AML3 (Clone 2) and NPM1WT/Degron1 IMS-M2 (bulk) cells after 6 hr treatment with 500 nM dTAG-47 or DMSO. Black dots indicate genes with significant (p<0.01) differential expression (n=3; p value derived from two-tailed Student’s t-test).
(D) Viable cell counts by trypan blue exclusion of NPM1WT/Degron1 and NPM1WT/Degron2 OCIAML3 (clones) and IMS-M2 (bulk) cells treated with 500 nM dTAG-47 for up to 12 days. Results are reported as ratio to DMSO-treated cells (n=3; mean ± SEM).
(E) Distribution of CD11b signal in untransduced and HOXA9/MEIS1-transduced NPM1WT/Degron1 OCI-AML3 (Clone 2) cells after 9 days of treatment with 500 nM dTAG-47 or DMSO (top). Distribution of MPO signal in untransduced and HOXA9/MEIS1-transduced NPM1WT/Degron1 IMS-M2 (bulk) cells after 6 days of treatment with 500 nM dTAG-47 or DMSO (bottom).
(F) CD11b levels expressed as MFI in untransduced (Untr.) and HOXA9/MEIS1-transduced (H9/M1) NPM1WT/Degron1 OCI-AML3 (Clone 2) cells after 9 days of treatment with 500 nM dTAG-47 or DMSO (left). MPO levels expressed as MFI in NPM1WT/Degron1 IMS-M2 cells (bulk) transduced as above after 6 days of treatment with 500 nM dTAG-47 or DMSO (right) (n=3 for OCI-AML3, n=6 for IMS-M2; mean ± SEM). HA=homology arm; O3=OCI-AML3; IMS=IMS-M2; C1=Clone 1; C2=Clone 2. * p<0.05, ** p<0.01, *** p<0.001; unpaired t-test with Welch’s correction. See also Figure S6.
We optimized induction of degradation using the small molecule dTAG-47 (Huang et al., 2017) by treating NPM1WT/Degron1 OCI-AML3 Clone 2 and IMS-M2 cells with increasing concentrations of the compound for 24 hr. These experiments established 500 nM as the lowest dose for maximal degradation (Figure S6B and S6C). Flow cytometry revealed that treatment with dTAG-47 at 500 nM induced more than 85% loss of the fusion protein within 4 hr (Figure 6B and S6D). Western blot analysis confirmed loss of Degron1 and Degron2 proteins with no change in WT NPM1 (Figure S6E).
We then induced degradation of the fusion protein and collected RNA for transcriptome analysis 6 hr following addition of dTAG-47 to NPM1WT/Degron1 OCI-AML3 and IMS-M2 cells. Acute loss of NPM1c resulted in very few significant transcriptional changes (p<0.01) with HOXA9, HOXA11, HOXB3, HOXB8, MEIS1 and CDKN2C emerging as the only genes with more than 40% downregulation in both cell lines (Figures 6C, S6F-S6H). These results establish a direct link between the transcriptional regulation of HOX/MEIS1 and the presence of cytoplasmic NPM1 in AML cells.
We next investigated the phenotype of AML cells following NPM1c degradation for up to 12 days. Loss of cytoplasmic NPM1 induced a significant cell growth defect beginning at day 6 and immunophenotypic differentiation analyzed at day 7 of dTAG-47 treatment in NPM1WT/Degron1 OCI-AML3 and IMS-M2 cells (Figures 6D–6F). Importantly, NPM1WT/Degron2 OCIAML3 and IMS-M2 cells also differentiated and underwent cell growth inhibition upon addition of dTAG-47, reproducing what was observed in NPM1WT/Degron1 cells (Figures 6D and S6I).
Since all-trans retinoic acid (ATRA) and arsenic trioxide (ATO) have been shown to induce partial proteasome-mediated degradation of NPM1c (Martelli et al., 2015), we tested the ability of ATRA and ATO to induce HOX downregulation. As expected, treatment of OCI-AML3 cells with ATRA/ATO led to a significant reduction of HOXA9 mRNA levels (Figure S6J).
Finally, to further establish that HOX/MEIS1 overexpression, as a direct consequence of NPM1 cytoplasmic localization, drives the leukemic phenotype, we asked whether exogenous expression of HOX genes could prevent the differentiation observed upon NPM1c degradation. Indeed, transduction of NPM1WT/Degron1 OCI-AML3 and IMS-M2 cells with a lentiviral construct encoding HOXA9 along with MEIS1 significantly inhibited differentiation despite treatment with dTAG-47 (Figure 6E and6F). To demonstrate that the ability of HOXA9/MEIS1 to prevent differentiation is not restricted to our degron model, we ectopically expressed HOXA9/MEIS1 in NPM1WT/MutA-GFP-NES OCI-AML3 cells. We then used sgNPM1c‡ to disrupt the MutA-GFP-NES allele resulting in loss of GFP signal (Figure S6K). As expected, nuclear relocalization of mutant NPM1 resulted in remarkable differentiation in untransduced controls, while edited HOXA9/MEIS1-transduced cells displayed significantly lower expression levels of CD11b (Figure S6L and S6M).
Altogether these results demonstrate that expression of HOX/MEIS1 genes declines immediately following loss of cytoplasmic NPM1 and that mutant NPM1 must directly facilitate or maintain the activation state of these master regulatory genes. Additionally, ectopic expression of HOXA9 and MEIS1 could overcome the loss of cytoplasmic NPM1, reinforcing the view that the HOX program acts downstream from NPM1c to maintain an undifferentiated state.
Nuclear export inhibitor KPT-330 induces nuclear relocalization of NPM1c, loss of HOX expression and differentiation
The demonstration that cytoplasmic NPM1 is essential for the leukemic phenotype opens the possibility of using nuclear export inhibitors as therapeutic agents in NPM1-mutated AML. Exportin 1 (XPO1) is the major nucleo-cytoplasmic transport protein in mammalian cells (Fornerod et al., 1997). Inhibition of XPO1 leads to nuclear retention of multiple tumor suppressors, including p53, p21, APC and Rb, subsequently triggering an apoptotic response in neoplastic cells (Gravina et al., 2014). KPT-330 (Selinexor) is a selective inhibitor of XPO1 that was developed as a pan-cancer agent and has been successfully tested in pre-clinical (Chen et al., 2017; Etchin et al., 2013a; Etchin et al., 2013b; Nakayama et al., 2016) and phase I clinical studies in both solid and hematologic cancers (Abdul Razak et al., 2016; Chen et al., 2018; Garzon et al., 2017; Gounder et al., 2016). Importantly, along with tumor suppressors, XPO1 also mediates the cytoplasmic transport of NPM1, and its inhibition results in nuclear relocalization of NPM1c (Bolli et al., 2007; Falini et al., 2006; Ranganathan et al., 2012).
Thus, we tested Selinexor in different AML models to assess whether nuclear relocalization of NPM1c through XPO1 inhibition could reproduce the phenotype observed by genetic disruption of the C-terminal NES. We first optimized Selinexor dosing using our GFPtagged NPM1c allele. We treated GFP-positive OCI-AML3 cells (NPM1WT/MutA-GFP-NES) with increasing doses of Selinexor for 12 hr, finding that 50 nM was the lowest dose that fully relocalized GFP to the nucleus; lower doses induced partial inhibition of NPM1 nuclear export (Figure 7A).
Figure 7. XPO1 inhibition recapitulates genetic disruption of mutant NPM1 nuclear export signal.

(A) Fluorescence microscopy of NPM1WT/MutA-GFP-NES OCI-AML3 cells treated with increasing concentrations of Selinexor for 12 hr. Scale bar 20 μM
(B) Cell counts of indicated NPM1 WT and NPM1c+ cell lines treated with either 50 nM Selinexor or DMSO for 12 days. Cells were counted and replated at equal concentrations with fresh drugs every 3 days. (n=6 for OCI-AML3, n=2 for MOLM-13, n=4 for all other cell lines; mean ± SEM)
(C) Flow cytometry analysis of CD11b expression in OCI-AML3 (NPM1c+) and HL-60 (NPM1 WT) cells after 6 and 12 days of treatment with 50 nM Selinexor or DMSO.
(D) Percentage of CD11b+ cells by flow cytometry analysis in OCI-AML3, HL-60, THP-1 and MV 4–11 cells after 6 and 12 days of treatment with 50 nM Selinexor. The cut-off point for CD11b positivity was set at the last one percentile of the Gaussian curve of DMSO-treated cells.
(E) Flow cytometry contour plot showing CD14 and CD11b expression levels in a primary AML sample (Pt. 004) treated for 12 days with 50 nM Selinexor or DMSO.
(F) RNA-sequencing data showing distal HOXA and MEIS1 locus in 3 primary AML samples treated with 100 nM Selinexor or DMSO for 24 hr.
(G) Kaplan-Meier survival curves of Npm1c/Flt3-ITD leukemic mice treated with Selinexor or vehicle. Selinexor was administered every 3 days at 25 mg/kg for the first two doses (blue arrows) and at 20 mg/kg for the following six doses (black arrows) for a total of eight administrations over 21 days (n=7 for vehicle, n=4 for Selinexor; log-rank test).
(H) White blood cell counts of Npm1c/Flt3-ITD leukemic mice analyzed at the time of the last administration of Selinexor or vehicle (n=14 for vehicle, n=17 for Selinexor; mean ± SEM).
(I) Spleen weight of Npm1c/Flt3-ITD leukemic mice analyzed at the time of the last administration of Selinexor or vehicle. Horizontal line depicts mean. * p<0.05, ** p<0.01, *** p<0.001; unpaired t-test with Welch’s correction. See also Figure S7.
We treated multiple AML cell lines with 50 nM Selinexor for up to 12 days and found that cell growth of NPM1c+ cell lines was significantly inhibited compared to WT NPM1 cell lines (Figure 7B). Importantly, XPO1 inhibition led to immunophenotypic differentiation of OCIAML3 cells (Figures 7C and 7D) and NPM1-mutated fresh primary AML samples (Figures 7E and S7A). Furthermore, treatment of cell lines and PDX2 cells with Selinexor for 24 hr resulted in rapid loss of H3K27ac at HOX/MEIS1 loci (Figures S7B and S7C). RNA sequencing performed on 3 primary AML samples with mutated NPM1 showed significant downregulation of HOX/MEIS1 following 24 hour treatment with Selinexor (Figures 7F, S7D and S7E).
Together, these results indicate that nuclear relocalization of NPM1c via XPO1 inhibition results in downregulation of the HOX/MEIS1 program and induction of differentiation, similar to the effects of nuclear relocalization of NPM1c driven by allele-specific CRISPR editing.
Selinexor prolongs survival of Npm1c/Flt3-ITD leukemic mice
Finally, we tested whether Selinexor could have in vivo anti-leukemic effects in a mouse model harboring a conditional Npm1c allele (Sportoletti et al., 2013). NPM1 and FLT3 mutations are commonly found together in human AMLs (Papaemmanuil et al., 2016). We therefore crossed the conditional Npm1c mouse with a line harboring an internal tandem duplication (ITD) of Flt3 (Flt3-ITD) knocked-in to the murine Flt3 locus (Lee et al., 2007). In this model, NPM1c and FLT3-ITD strongly synergize in promoting leukemogenesis, as doublemutant mice invariably succumb to a fully penetrant AML within about 12 months (Mallardo et al., 2013; Mupo et al., 2013)
To test the in vivo effects of Selinexor on leukemias, we waited until mice developed evidence of disease defined as white blood cell (WBC) count higher than 40 × 103/μL, hemoglobin level lower than 10 g/dL and platelet count lower than 100 × 103/μL We then treated Npm1c/Flt3-ITD leukemic mice with either Selinexor or vehicle using previously reported doses (Etchin et al., 2013a) for a total of 8 administrations over 21 days (Figure 7G).
Remarkably, Selinexor treatment significantly prolonged the survival of leukemic mice (Figure 7G). WBC counts and spleen weights analyzed at the time of the last administration were significantly reduced in mice treated with Selinexor, compared to vehicle (Figure 7H, 7I and S7F). Platelet counts were higher in treated mice, as compared with controls, suggesting restoration of efficient megakaryopoiesis (Figure S7G). Leukemic infiltration of the liver was also markedly reduced (Figure S7H). These data establish the efficacy of Selinexor in a mouse model of NPM1-mutant AML, supporting the possibility of its potential use, alone or in combination with other agents, in patients with NPM1-mutant AML.
DISCUSSION
Here, CRISPR-Cas9 allele-specific editing allowed us to systematically uncover the exquisite dependency of NPM1-mutant AML on its nuclear localization and on sustained HOX gene expression. Demonstrating this dependency in NPM1-mutant AML cell lines of distinct genetic backgrounds, in primary AML samples, as well as in mice definitively demonstrates that differentiation upon loss of mutant NPM1 from the cytoplasm results is a programmed response independent of co-occurring mutations. Previous studies had suggested the relevance of NPM1c to AML maintenance (Balusu et al., 2011), but due to the inability to specifically target the mutant form of NPM1, the effects of reducing total NPM1 protein, as opposed to NPM1c alone, could not be dissociated.
Our study has also extended the use of CRISPR technology to knock in large and complex multicistronic DNA sequences bypassing vector construction, an approach that will be useful in other contexts. While off-target effects can be a concern, our consistent data from numerous experiments of pools and clones argue against this potential caveat.
Whether NPM1 mutations maintain leukemia through a gain-of-function in the cytoplasm or a reduced NPM1 dosage in the nucleus (loss-of-function) has been hotly contested (Grisendi et al., 2006; Heath et al., 2017). This is not resolved by our nuclear relocalization experiments, as NPM1c is simultaneously removed from the cytoplasm and nuclear levels are restored. However, our data showing that specific degradation of NPM1c leads to reduction, within hours, of key features of the leukemic program, definitively establish that mutant NPM1 acts in a gain-of-function manner to maintain AML.
These studies also have implications for views on the role of HOX/MEIS1 gene expression in AML. Overexpression of HOX/MEIS1 has repeatedly been shown to be associated with some sub-types of AML, particularly those with NPM1 mutations (Alcalay et al., 2005; Spencer et al., 2015), but whether their expression is functionally associated with AML, or simply a marker for their primitive state (Spencer et al., 2015), has not been clear. Overexpression of Hox genes in murine hematopoietic progenitors causes increased cell growth and leukemia development, which is accelerated by co-overexpression with Meis1 (Argiropoulos and Humphries, 2007; Sauvageau et al., 1997). In agreement, CRISPR dropout studies demonstrated that a functional HOX network is essential for growth of NPM1c+ AML cells (Dovey et al., 2017; Tzelepis et al., 2016; Wang et al., 2017). Additionally, epigenetic therapies targeting HOX/MEIS1 are effective in NPM1 mutant AML cells (Kuhn et al., 2016). Together, these studies suggest that HOX/MEIS1 genes could be necessary for the maintenance of the leukemic state in NPM1-mutated AML. Here, the nearly immediate plunge of HOX/MEIS1 expression after degradation of NPM1c suggests a close link to maintaining transcription of these key genes.
Mechanisms that link the cytoplasmic localization of NPM1c and HOX expression are not clear. An attractive hypothesis is that NPM1c could directly bind and displace from the nucleus putative factors required for differentiation, such as the myeloid transcription factor PU.1 (Gu et al., 2016) and the architectural protein CTCF (Wang et al., 2018). In this model, loss of mutant NPM1 from the cytoplasm would restore the normal activity of these factors; however, the very rapid down-regulation of HOX genes that we demonstrate makes this scenario unlikely.
An alternative mechanism could be related to a gain-of-function interaction between NPM1c and XPO1, mediated by the novel C-terminal NES of the mutant protein. Interestingly, XPO1 has also been shown to interact with NUP98, a member of the nuclear pore complex involved in transport of mRNAs and proteins to the cytoplasm and implicated in transcriptional activation (Gough et al., 2011). Intriguingly, fusions of NUP98 (often with chromatin remodelers) are frequently found in leukemia and are also associated with high HOX/MEIS expression (Gough et al., 2011; Xu et al., 2016). Moreover, XPO1 has been shown to be enriched at HOX loci, and to bring NUP98 fusion proteins to these loci (Oka et al., 2016). Together, these data link proteins involved in nuclear transport (XPO1 and NUP98) with chromatin remodeling and HOX expression. Therefore, we speculate that NPM1c, by binding to XPO1, could be coupling nuclear transport and the transcriptional machinery to somehow enforce HOX expression. Thus, we suggest it is not the cytoplasmic localization of NPM1c per se, but the act of nuclear transport itself, that is pathologic.
Regardless of the mechanism, our data strongly suggest that the further development of therapeutic agents that act through nuclear export inhibition in the context of AML with mutated NPM1 is warranted. Since XPO1 inhibition results in increased nuclear levels of multiple tumor suppressors (Gravina et al., 2014), its impact is unlikely to be attributed solely to NPM1c. Single agent Selinexor has been tested in a phase I trial in adult AML patients (Garzon et al., 2017) and cases with mutated NPM1 did not show a higher response rate. However, the small number and heterogeneity of the patients preclude conclusive subgroup analysis. Furthermore, the toxicity profile of Selinexor requires periodic dosing, which is likely ineffective to ensure sustained nuclear relocalization of mutant NPM1 and cellular differentiation. Nevertheless, further studies with XPO1 inhibitors should be pursued, ideally in the context of AML patients with mutated NPM1.
In summary, our studies define the dependency of NPM1-mutant AML on NPM1c and provide the rationale for the clinical use of XPO1 inhibitors. Although further experiments are needed to reveal the molecular mechanisms, we demonstrate that NPM1c facilitates HOX/MEIS1 expression and that HOX genes support the leukemic state in NPM1-mutant AML.
STAR METHODS
CONTACT FOR REAGENTS AND RESOURCE SHARING
Further information and requests for resources and reagents should be directed to and will be fulfilled by the Lead Contact, Margaret A. Goodell (goodell@bcm.edu).
EXPERIMENTAL MODEL AND SUBJECT DETAILS
Mice
NSG Mice were housed in AAALAC-accredited, specific-pathogen-free animal care facilities at Baylor College of Medicine (BCM). BCM Institutional Animal Care and Use Committees approved all procedures. Breeding pairs of NSG mice were purchased from the Jackson Laboratory. 6–10 weeks female NSG mice were used for our experiments and were fed autoclaved food and water. Npm1c/Flt3-ITD mice were generated and housed at the University of Perugia (UniPG) animal facility. UniPG Animal Care Committee approved all procedures. To generate Npm1c/Flt3-ITD double-mutants, mice with the NPM1 mutation A (Npm1TCTG/TCTG or Npm1c) (Sportoletti et al., 2013) were bred with Mx1-Cre transgenic mice (B6.Cg-Tg(Mx1cre)1Cgn/J) and with a line harboring an internal tandem duplication (ITD) of Flt3 (Flt3-ITD) knocked-in to the murine Flt3 locus (Flt3-ITD B6.129-Flt3tm1Dgg/J) (Lee et al., 2007), to generate Npm1TCTG/TCTG; Mx1-Cre; FLT3WT/ITD mice. Expression of Mx1-Cre and excision of PGK-Neo cassette were induced by polyinosinic-polycytidylic acid (pIpC) treatment in vivo. In brief, 8- to 12-week-old Npm1TCTG/TCTG; Mx1-Cre; FLT3WT/ITD mice were injected intraperitoneally with 250 mg/dose pIpC every other day for 3 injections.
Cell Lines
All human AML cell lines were cultured in RPMI supplemented with 10% FBS. Due to impaired cell growth at low concentrations, IMS-M2 cells were maintained at concentrations between 2×10⁵ and 2×10⁶/ml. NPM1 mutation A was confirmed at least once in every batch of OCIAML3 and IMS-M2 cells by Sanger sequencing. HS-5 (prior to co-culture with primary AML cells) and 293T cells were cultured in DMEM with 10% FBS. Penicillin/streptomycin were added to all cell cultures except from media used for electroporated cells.
Patient Derived Xenograft Model (PDX2)
Leukemic cells from a 66 years old female patient with newly diagnosed AML with mutated NPM1 were harvested and injected subcutaneously into NSG mice. UniPG hospital review board approved the procedure and the patient signed a written informed consent. Injected cells produced subcutaneous masses that were dissected, crushed and filtered to obtain a single cell suspension. Cells were subcutaneously injected into new NSG recipients, allowing for propagation. At each round of transplantation, an aliquot of cells can be used to perform experiments and leftovers are subcutaneously transplanted into new NSG recipients. Conventional cytogenetics performed on leukemic cells at diagnosis revealed a normal karyotype. Molecular analysis at diagnosis showed NPM1 mutation A and FLT3 internal tandem duplication (ITD) with a mutant allele frequency of 8.6%. The FLT3-ITD allele frequency, determined after the first engraftment following diagnosis, demonstrated the selection of an FLT3-ITD homozygous population (mutant allele frequency: 88%). For shortterm culture (up to 24 hr) PDX2 cells were cultured in IMDM supplemented with 10% FBS, 2% L-glutamine, 10ng/ml FLT3L, 10 ng/ml TPO and 10 ng/ml SCF at concentrations between 1 and 2.5×10⁶/ml. For longer culture times, PDX2 cells were co-cultured with stromal HS-5 cells using same medium and same concentrations.
Primary AML samples
Fresh primary AML samples were purchased from MD Anderson Cancer Center (Leukemia sample bank, MDACC, Houston, TX). All patients signed a written informed consent before sample acquisition. Sequencing results of a custom panel of 81 genes recurrently mutated in hematologic malignancies, as well as standard karyotyping results were provided by MDACC. Leukemic cells were isolated through Ficoll gradient. For short-term culture (up to 24 hr) primary AML cells were cultured in IMDM supplemented with 10% FBS, 2% L-glutamine, 10ng/ml FLT3L, 10 ng/ml TPO and 10 ng/ml SCF at concentrations between 1 and 2.5×10⁶/ml. For longer culture times, primary AML cells were co-cultured with stromal HS-5 cells using same medium and same concentrations.
METHODS DETAILS
sgRNA design and synthesis
Protospacer sequences for each target gene were identified using the CRISPRscan platform (Moreno-Mateos et al., 2015). For gene disruption experiments in cell lines, sgRNAs were synthetized as previously described (Brunetti et al., 2018; Gundry et al., 2016). In brief, primers containing a T7 promoter, the protospacer sequence, and a 21-nt sequence corresponding to the 5′ end of the sgRNA scaffold sequence were obtained from Integrated DNA Technologies (IDT). Full-length DNA templates were then produced by an overlap PCR between each custom forward primer and a universal reverse scaffold primer (Table S6). The PCR products were purified with the MinElute PCR purification kit and in vitro transcribed with the HiScribe T7 High Yield RNA Synthesis Kit following manufacturer instructions. In vitro transcription products were purified using the RNA Clean & Concentrator-25, according to manufacturer instructions and eluted in nuclease-free water. For gene disruption experiments in PDX2 and primary AML cells as well as for HDR experiments in OCI-AML3 and IMS-M2 cells, synthetic sgRNAs were directly purchased from Synthego. sgNPM1c‡ was manually designed based on the genomic sequence of the NPM1c-GFP-NES allele and purchased as a synthetic sgRNA from Synthego (Table S6).
Cas9-sgRNA pre-complexing and transfection
To obtain Cas9-sgRNA RNPs, 1 μg of either in vitro transcribed or synthetic sgRNA was incubated with 1.5 μg Cas9 for 30 min at room temperature. AML cell lines were electroporated in Buffer R (ThermoFisher), while primary AML samples in Buffer T (ThermoFisher). In each replicate, 1.5–2.5 × 10⁵ cells were electroporated. Electroporation was performed using the Neon Transfection System. Electroporation conditions used for both AML cell lines and primary AML samples were 1600 V, 10 ms, 3 pulses.
Cloning and transfection of GFP-NPM1 plasmids
OCI-AML3 cells were transfected with sgNPM1c. 3 days after electroporation, DNA was harvested and the targeted locus (NPM1 exon 12) was PCR amplified. PCR product was cloned into pCR2.1-TOPO vector using the TOPO-TA cloning kit following manufacturer’s instruction. Based on amplicon sequencing results, the 4 most represented alleles (allele 1, 2, 3 and 4) were identified (See Figure 1B) and pCR2.1-TOPO plasmids containing the desired alleles were selected. NPM1 Exon 12 from alleles 1, 2, 3 and 4 were subsequently cloned into the pEGFP-C1-NPM1 vector containing GFP fused at the N-terminus of the NPM1c coding sequence. Final products were transfected into HEK293T cells using Lipofectamine 2000, following manufacturer’s instruction. Images were collected 24 hr after transfection. Nuclear staining was obtained adding Hoechst 33342 (ThermoFisher) to the culture medium, 5 min prior to image acquisition.
Precise editing of NPM1c allele OCI-AML3 and IMS-M2 cells
Templates for homology directed repair (HDR) were ordered as linear DNA fragment pools from Twist Biosciences (Table S6). HDR templates were designed with 400bp homology arms, with the left homology arm designed from NPM1 intron 11 DNA sequence and the right homology arm from NPM1 3’ UTR DNA sequence. Templates were PCR amplified with KAPA HiFI HotStart ReadyMix and TWIST F and TWIST R primers (Table S6). PCR products were purified using the Qiagen MinElute PCR purification kit following manufacturer’s instructions.
To generate the alleles with different frameshift mutations (alleles 1, 2, 3 and 4 in Figure 1B), stop codons resulting from frameshifts were replaced with a GSG linker followed by the EGFP coding sequence and a stop codon.
To generate the templates for alleles 1, 2, 3 and 4 with the P2A cleavable linker (Figure S4C), the TWIST construct MutA-P2A-GFP was used as the DNA template in a KAPA HiFI HotStart PCR reaction with primers AlleleX P2A F and NPM1 ex12 R (Table S6).
For the alleles encoding for mutant NPM1 with partial (MutA-GFP) or near complete cytoplasmic localization (MutA-GFP-NES), nuclear export signal (NES) prediction analysis by NetNES (la Cour et al., 2004) performed on the MutA-GFP allele suggested that the addition of GFP to the C-terminus of mutant NPM1 could have an impact the strength of the C-terminal NES. We therefore designed an additional allele that contained a second copy of the Exon 12 NES at the 3’ of GFP (MutA-GFP-NES) (Table S6).
For the degron templates, we replaced the stop codon in the endogenous NPM1c allele with a GSG linker followed by the FKBP12 (F36V) (Nabet et al., 2018) coding sequence and either a second GSG linker followed by the EGFP coding sequence and second copy of the Exon 12 NES (Degron 1) or a second GSG linker, a P2A sequence, and the EGFP coding sequence (Degron 2). 400bp homology arms were used as in other templates (Table S6).
In each replicate 1.5 – 2.5 × 10⁶ cells were electroporated with 350 ng of each of the templates along with Cas9-sgNPM1c RNPs, pre-complexed as described above. GFP expression was first analyzed 3 days after electroporation both by fluorescence microscopy and flow cytometry. Correct integration of the templates was confirmed by PCR, using a 5’ primer outside of the HDR template and a 3’ primer within the EGFP sequence, followed by Sanger sequencing (See Figure S4).
Treatment with dTAG-47
The compound dTAG-47 was provided by Behnam Nabet and Dennis L. Buckley. Due to inability of growing single cell derived clones from IMS-M2 cell line, experiments on NPM1WT/Degron1 and NPM1WT/Degron2 IMS-M2 cells were performed on bulk GFP-positive cells, while experiments on NPM1WT/Degron1 and NPM1WT/Degron2 OCI-AML3 cells were performed on GFP-positive single cell derived clones. To determine the optimal concentration of dTAG-47 to obtain efficient degradation of NPM1c, we exposed NPM1WT/Degron1 to increasing concentrations of dTAG-47 and determined GFP-expression by flow cytometry after 24 hr. To study the dynamics of NPM1c degradation upon dTAG-47, we treated with NPM1WT/Degron1 OCI-AML3 and IMS-M2 cells for up to 24 hr 500 nM dTAG-47 and recorded GFP expression (Median Fluorescence Intensity) at multiple time points. DMSO was used as control in all experiments. Experiments to determine cell growth were performed using 500 nM dTAG-47 or 0.05% DMSO (control). Cells were split 1:5 every 3 days with new medium and fresh dTAG-47 or DMSO. Viable cell counts were determined using trypan-blue exclusion.
Transplant of AML cells
For in vivo experiments on edited PDX2, cells were harvested from subcutaneous masses and cultured for 48 hr. For each replicate 6×10⁵ cells were electroporated with sgCD19, sgCD45 or sgNPM1c and left in culture for additional 24 hr. Each one of replicates was subcutaneously injected into NSG recipients. Masses arising from edited cells were allowed to grow for 6 weeks and then harvested for DNA purification. Purified DNA was used for PCR amplification of targeted loci (Table S6) and high-throughput amplicon sequencing.
For in vivo experiments on edited OCI-AML3 cells, for each replicate 4×10⁵ cells were electroporated with sgCD19, sgCD45 or sgNPM1c and left in culture for 72 hr. Each one of the replicates was transplanted into non-irradiated NSG recipients through tail-vein injection. Mice were euthanized 6 weeks after transplant. At the time of sacrifice, leukemic cells had almost exclusively engrafted livers.
For in vivo experiments on edited NPM1WT/MutA-GFP-NES OCI-AML3, 4×10⁶ cells were electroporated with sgNPM1c‡ and left in culture for 72 hr. Edited (GFP negative) and unedited (GFP positive) cells were FACS sorted and aliquots of 2.5×10⁵ GFP positive or GFP negative cells were transplanted into sublethally irradiated (2.5 Gy) NSG mice.
HOXA9/MEIS1 lentivirus synthesis and transduction
Custom pLV-puro-EFS>HOXA9-T2A-MEIS1 lentiviral vector was purchased from VectorBuilder. pLV-puro-EFS>HOXA9-T2A-MEIS1 (lentiviral vector), pMD2.G and psPAX2 (packaging vectors) were co-transfected into two 10 cm plates with 70% confluent 293T cells using Lipofectamine 3000. Supernatant containing lentiviral particles was harvested at 48 h and 72 h after transfection. To concentrate the viral particles, 4X polyethylene glycol (PEG) (32% PEG6000, 0.4 M NaCl, and 0.04 M 4-(2-hydroxyethyl)-1-piperazineethanesulfonic acid (HEPES)) was added to the supernatant and incubated at 4°C overnight. Viral particles were then centrifuged at 1500 g for 45 min and finally resuspended in X-VIVO 15 medium (Lonza). OCI-AML3 and IMS-M2 cells were spin infected at 1100 rpm for 2 h at room temperature, in RPMI supplemented with polybrene (7 μg/ml) and subsequently incubated overnight. 48 hr after infection puromycin was added to the medium at a concentration of 1 μg/ml. Parental untransduced cells were used as control for puromycin selection efficiency.
Treatment of AML cells with Selinexor
GFP positive CRISPR-engineered OCI-AML3 cells with cytoplasmic mutant NPM1 (MutAGFP-NES) were treated for 12 hr with increasing concentrations of Selinexor (10 nM, 25 nM, 50 nM and 100 nM). Experiments to determine cell growth and differentiation of cell lines were performed with 50 nM Selinexor. Cells were re-plated every 3 days at equal concentrations and new fresh drug was added simultaneously. Viable cell counts were determined using trypan-blue exclusion. For experiments to study the impact of Selinexor on the differentiation of primary AML samples, cells were treated with 50 nM Selinexor or DMSO, while co-cultured with HS-5 cells. Medium with fresh drug was replaced every 3 days. For RNA-sequencing and ChIP-sequencing experiments, primary cells were treated with 100 nM Selinexor or DMSO for 24 hr without co-culturing with stromal cells.
Treatment of OCI-AML3 cells with arsenic trioxide and all-trans retinoic acid
To induce pharmacological degradation of NPM1c, OCI-AML3 cells were continuously treated with arsenic trioxide and/or all-trans retinoic acid for 48 hr at the concentrations indicated, as previously published (Martelli et al., 2015). Cells were collected at 16 hr and 48 hr for RNA purification and qPCR analysis of HOXA9 expression levels.
AML diagnostic criteria, Selinexor administration and mice survival
Complete blood counts were performed starting 1 month after the last pIpC injection. Criteria for the diagnosis of leukemia were defined following Kogan et al. (Kogan et al., 2002) Mice were defined leukemic when all 3 conditions were met: 1) leukocytosis (WBC > 40 × 103/μl), 2) anemia (HGB < 10 g/dl), 3), thrombocytopenia (PLT < 100 × 103/μl). After the onset of leukemia mice were divided in two groups and treated with either vehicle or Selinexor one administration every 3 days for 8 times (20 mg/kg for days 1, 4 and 25 mg/kg on the others administrations). Survival was defined as the time from the end of treatment to death or moribund state.
Blood collection and complete blood count
Blood was sampled from anesthetized mice from the retro-orbital plexus for blood count determination. Blood was taken into glass capillary tube. Complete blood count was performed using an XE-2100 hematology automated analyzer (Dasit).
Histology
Paraffin-embedded tissues were cut into 7-μm-thick sections and stained with hematoxylin eosin. Images were collected using an Olympus B61 microscope and a UPlan FI ×100/1.3 NA oil objective; Camedia 4040, Dp_soft Version 3.2, Magnification 10X and 20X.
Immunofluorescence
5–8 × 10⁴ cells were cytospinned on slides for 5 min at 300rpm (Cytocentrifuge Wescor Cytopro 7620) and fixed in 4% paraformaldehyde for 10 min at room temperature. Fixed cells were permeabilized with Triton X-100 0.1% for 6 min at room temperature. Permeabilized cells were incubated with BSA 1%/Tween 0.5% in PBS for 30 min at room temperature and then with a primary rabbit anti N-terminal NPM1 antibody overnight at 4°C. Anti-rabbit Alexa-Fluor 488 immunoglobulin G fluorescent antibody (Molecular Probes by Life Technologies) was used as secondary antibody. Nuclei were stained with 4,6-diamidino-2-phenylindole (DAPI) in Prolong Gold mounting reagent (Molecular Probes by Life Technologies). Immunofluorescence images were collected with the Axioplan 2 microscope (Zeiss) and processed with CellSens Digital Imaging Software (Olympus).
Live cell imaging
Images of GFP-NPM1 transfected HEK293T cells were collected using a Leica DM6000 microscope and processed with LAS X software (Leica). Deconvolution microscope DeltaVision Elite (GE Healthcare) was used to acquire images of GFP positive CRISPRengineered OCI-AML3 cells (60X magnification in immersion oil). Vital dye Hoechst 33342 (Thermo Fisher Scientific) was used to stain the nuclei of live cells. Images were processed with the SoftWorRx application (GE Healthcare)
Morphological analysis
For each slide 5–8×10⁴ cells were cytospinned for 5 min at 300rpm (Cytocentrifuge Wescor Cytopro 7620). Cells were subsequently stained with May-Grünwald for 3 min, washed with distilled water for 3 min and stained with Giemsa for 17 min. Images were acquired on the Axioplan 2 microscope (Zeiss) and processed with CellSens Digital Imaging Software.
Flow cytometry
In all samples cell debris were excluded based on FSC-A/SSC-A dot-plot and viable cells were gated as propidium idodide negative cells. To assess differentiation levels, PE-conjugated anti CD11b and APC-conjugated CD14 were used. Due to different differentiation patterns, in IMSM2 cells differentiation was evaluated using PE-conjugated anti-MPO following fixation/permeabilization with Cytofix/Cytoperm kit (BD Bioscience), according to manufacturer’s instructions. CD45 expression was assessed using a FITC-conjugated anti CD45 antibody. When needed, HS-5 stromal cells were excluded from analysis by gating out CD45 negative cells. Cell cycle analysis was performed using the FITC BrdU Flow Kit following manufacturer instructions. Singlets were gated using the FSC-A/FSC-H dot-plot. Flow cytometry and cell sorting were performed respectively with the LSR II cytometer (BD Biosciences) and FACSAriaI cell sorter (BD Biosciences).
Western blotting
20 micrograms of purified proteins were separated by SDS-polyacrylamide gel electrophoresis (SDS-PAGE) on either a 4–20% or a 4–15% gradient gel (BioRad) and transferred onto PVDF membranes (Thermo Fisher Scientific). For the blot in Figure 1D duplicate sets of samples were run for parallel blotting. Accurate loading was verified with Ponceau staining (Thermo Fisher Scientific) (Figure S1C). Membranes were incubated overnight at 4°C with the following primary antibodies: mouse anti beta-actin; rabbit anti N-teminal NPM1; homemade rabbit antimutant NPM1 (NPM1c) antibody. Anti-mouse or anti-rabbit horseradish peroxidase-conjugated antibodies (Santa Cruz) were used as secondary antibodies.
High throughput amplicon sequencing
Sequencing libraries were prepared using Illumina Nextera XT Kit and sequenced on an Illumina NextSeq 500 instrument (single end 75 bp reads). Indel frequencies were computed by using a custom aligner/script.
RNA isolation, reverse transcription and real-time PCR
Total cellular RNA was isolated using an RNeasy micro kit and eluted in 15μl. Following isolation, 500ng-1μg of RNA was reverse transcribed using SuperScript III following manufacturer instructions. RealTime PCR (RT-PCR) was performed using the BioRad CFX96 Touch using TaqMan universal master mix and FAM probes. For HOXA9 qPCR following ATRA/ATO, SYBR Green PCR master mix and custom primers were used instead of FAM probes. The mRNA levels of test genes were normalized to GAPDH fold change calculated by the ΔΔCt method.
RNA-seq libraries
Total RNA was extracted from cells using the Qiagen RNeasy Micro kit. Purified total RNA was quantified using a Qubit and 200–500ng of total RNA was used as input into the Illumina TruSeq Stranded mRNA LT Sample Prep Kit according to kit protocols. Amplified libraries were purified and quantified using the KAPA quantification kit. RNA-seq libraries were run on an Illumina NextSeq 500 instrument (single end 75 bp reads).
RNA-seq data analysis
Data was demultiplexed using bcl2fastq and aligned to the NCBI RefSeq build hg19 using hisat2 (Kim et al., 2015). Aligned SAM files were converted to .bam files for post-processing using samtools (Li et al., 2009). For genome visualization, aligned files were normalized and convered to bigWig files using Deeptools. Transcript abundances were calculated using the cuffquant module of Cufflinks. FPKM values were calculated and normalized using cuffnorm. To identify conserved modules across both cell lines, we defined significantly downregulated genes as those with a p value < 0.01 and log2 fold change (control sgRNAs/sgNPM1c) less than −1. Comparisons between control sgRNAs and sgNPM1c were assessed by the student’s t-test (2 tail). GSEA was performed using default parameters. Heatmap in figure S7 was generated using Morpheus.
ChIPmentation
ChIPmentation was carried out as previously described (Schmidl et al., 2015), with minor adaptions. Cells were washed once with PBS and fixed with 1% paraformaldehyde in up to 1 ml PBS for 10 min at room temperature. Glycine was added at a final concentration of 0.125M to stop the reaction. Cells were collected at 500 g for 10 min at 4 °C (subsequent work was performed on ice and used cool buffers and solutions unless otherwise specified) and washed twice with up to 0.5 ml ice-cold PBS supplemented with 1X Xpert Protease Inhibitor Cocktail Solution. The pellet was lysed in sonication buffer (10 mM Tris-HCl pH 8.0, 1 mM EDTA pH 8.0, 0.25% SDS, 1X protease inhibitors) and sonicated with a Covaris S220 sonicator for 9 min in a microTUBE until the size of fragments was in the range of 200–700 bp. Lysates were transferred to new tube and diluted 1:1.5 with equilibration buffer (10mM Tris, 233mM NaCl, 1.66% Triton X-100, 0.166% sodium deoxycholate, 1 mM EDTA, 1X protease inhibitors). Lysates were centrifuged at full speed for 10 min at 4 °C and the supernatant containing the sonicated chromatin was transferred to a new tube. The lysate was then brought to RIPA buffer conditions (final concentration: 10 mM Tris-HCl pH 8.0, 1 mM EDTA pH 8.0, 140 mM NaCl, 1% Triton X-100, 0.1% SDS, 0.1% sodium deoxycholate, 1X protease inhibitors) to a volume of 100 μl per immunoprecipitation. The antibody was added to the lysates and incubated on a rotator overnight at 4 °C. Used antibodies were H3K4me3 (1 μg per immunoprecipitation), H3K27ac (1 μg per immunoprecipitation) and H3K27me3 (1 μg per immunoprecipitation). 5μl magnetic Protein A beads (Life Technologies) were washed twice and resuspended in 10μl of RIPA-LS supplemented with 0.1% BSA. Blocked beads were added to immunopreciptated lysates and incubated for 2 hr on a rotator at 4 °C. Beads were washed subsequently with RIPA-LS (10 mM Tris-HCl pH 8.0, 1 mM EDTA pH 8.0, 140 mM NaCl, 1% Triton X-100, 0.1% SDS, 0.1% sodium deoxycholate and 1X protease inhibitors) (twice), RIPA-HS (10 mM Tris-HCl pH 8.0, 1 mM EDTA pH 8.0, 500 mM NaCl, 1% Triton X100, 0.1% SDS, 0.1% sodium deoxycholate and 1X protease inhibitors) (twice) and RIPA-LiCl (10 mM Tris-HCl pH 8.0, 1 mM EDTA pH 8.0, 250 mM LiCl, 1% Triton X-100, 0.5% sodium deoxycholate, 0.5% NP40 and 1X protease inhibitors) (twice). Beads were washed with cold Tris-Cl pH 8.0, to remove detergent, salts and EDTA. Beads were washed once more with cold Tris-Cl pH 8.0 but the reaction was not placed on a magnet to discard supernatant immediately. Instead, the whole reaction including beads was transferred to a new tube and then placed on a magnet to remove supernatant to decrease background. Beads were then resuspended in 25 μl of the tagmentation reaction mix (10 mM Tris pH 8.0, 5 mM MgCl2, 10% v/v dimethylformamide) containing 1 μl Tagment DNA Enzyme from the Nextera DNA Sample Prep Kit and incubated at 37 °C for 2 min in a thermocycler. The beads were washed with
RIPA-LS (twice) and once with cold Tris-HCl pH 8. Beads were washed once more with cold Tris-HCl pH 8.0 but the reaction was not placed on a magnet to discard supernatant immediately. Instead, the whole reaction including beads was again transferred to a new tube and then placed on a magnet to remove supernatant. Beads were then incubated with 50 μl elution buffer (0.5% SDS, 300 mM NaCl, 5 mM EDTA and 10 mM Tris-HCl pH 8.0) containing 2 μl of Proteinase K for 1 h at 55 °C and 8 h at 65 °C, to revert formaldehyde cross-linking, and supernatant was transferred to a new tube. Finally, DNA was purified with Qiagen MinElute columns and eluted in 22μl of elution buffer (10mM Tris-HCl pH 8.0).
Enrichment of the libraries was performed in a 50-μl reaction using 0.75 μM primers, 25μl NEBNext High-Fidelity 2X PCR Master Mix and 20μl of the purified library. Libraries were amplified for N+1 cycles, where N is equal to the rounded-up Cq value determined in a test qPCR reaction with 1μl of the library. Enriched libraries were purified using SPRI AMPure XP beads at a beads-to-sample ratio of 1:1, followed by a size selection using AMPure XP beads to recover libraries with a fragment length of 200–400 bp. Library preparation was performed using custom Nextera primers as described for ATAC-seq (Buenrostro et al., 2013). ChIP-seq libraries were run on an Illumina NextSeq 500 instrument (single end 75 bp reads).
ChIP-Seq analysis
75bp single-end sequencing reads were mapped to the hg19 genome using Bowtie2 (Langmead et al., 2009) with default paramaters. MACS version 1.4.2 peak finding algorithm was used to identify regions of ChIP-Seq enrichment with -p 1e-9 -w -S --space=50 -nolambda parameters specified.
Calculating read density
We calculated the normalized read density of ChIP-seq datasets using bamliquidator. Briefly, ChIP-seq reads aligning to the region were extended by 200 bp and the density of reads per base pair (bp) was calculated. The density of reads in each region was normalized to the total number of million mapped reads producing read density in units of reads per million mapped reads per bp (rpm per bp).
Mapping typical enhancers and super-enhancers using H3K27ac enhancer definitions
H3K27ac super-enhancers (SEs) and typical enhancers (TEs) were mapped using the ROSE2 software package. Default parameters, including exclusion of TSS-proximal signal (within 2.5 kb), were used and a stitching parameter was determined that consolidated proximal peaks while optimizing the enriched fraction of stitched peaks (as per default settings of ROSE2 software package).
Identifying gained/lost super-enhancers
In order to quantify changes in super-enhancers between two conditions, ChIP-Seq signal was calculated at the set of all enhancer regions considered super in at least one condition. Superenhancers were ranked and median normalized for each condition and compared between the two conditions to determine fold change in signal. For waterfall plots, super-enhancers were ranked by fold change in signal.
Core regulator circuitry (CRC)
Core regulatory circuitry analysis was performed using H3K27ac ChIP-seq data as previously described (Lin et al., 2016)(Lin et al., 2016)(Lin et al., 2016)(Lin et al., 2016)(Lin et al., 2016)(Lin et al., 2016)(Lin et al., 2016)(Lin et al., 2016)(Lin et al., 2016)(Lin et al., 2016)(Lin et al., 2016)(Lin et al., 2016)(Lin et al., 2016)(Lin et al., 2016)(Lin et al., 2016)(Lin et al., 2016)(Lin et al., 2016) (https://github.com/linlabcode/pipeline/tree/master/crc). In brief, SEs identified with ROSE2 are assigned to the closest transcript predicted to be expressed. For each SE, enriched TF binding sites are determined using FIMO (Grant et al., 2011) at putative nucleosome free regions (valleys) flanked by high levels of H3K27ac. Valleys are calculated using an algorithm adapted from (Ramsey et al., 2010). SE-assigned TFs with SEs that contain at least 3 DNA sequence motif instances for their own protein products are defined as auto-regulated TFs. From the set of auto-regulated TFs, the TFs predicted to bind to the SEs of other auto-regulated TFs are identified. All possible fully interconnected auto-regulatory loops of TFs are then constructed and ranked through recursive identification. The highest scoring (by clique score metric) fully interconnected auto-regulatory loop of TFs is selected as the CRC model. For the core regulatory circuitry analysis of OCI-AML3 (Figure S5C) and IMSM2 (Figure S5D) H3K27ac data from cells transfected with sgCD45 control was used.
Calculating CRC IN and OUT ratios for all SE associated TFs
To calculate dynamic changes in the CRC upon nuclear relocalization of NPM1c, we applied the CRC code to the combined H3K27ac landscape (sgCD45 and sgNPM1c). For each predicted TF binding site (edge) present in SE DNA sequences assigned to that TF (“IN” edges) and to all other SEs in the CRC (“OUT” edges), the H3K27ac signal is recorded from both conditions (sgCD45 and sgNPM1c). Because the edges are identified in valleys (H3K27ac-depleted regions), the H3K27ac signal from a 200bp flanking region is also recorded. For each SE-associated TF, the sum of signal for the IN and OUT edges are used to calculate ratios between sgCD45 and sgNPM1c. Together the IN and OUT ratios provide information on the degree to which individual TFs are gaining (higher IN and OUT ratios) or losing (lower IN and OUT ratios) strength in the CRC (Figure S5E).
QUANTIFICATION AND STATISTICAL ANALYSIS
GraphPad Prism 7.0 was used for statistical analysis. If not specified otherwise, all comparisons between two groups were performed using a parametric t-test without assuming equal standard deviations (Welch’s correction). For comparing survival curves, p value was calculated by Log-rank (Mantel-Cox) test. See also figure legends for more details.
DATA AND SOFTWARE AVAILABILITY
Raw and processed RNA-seq and ChIP-seq data have been deposited to GEO with the following accession number: GSE111180.
Supplementary Material
Allele frequencies of NPM1c locus in AML cell lines transfected with sgNPM1c (Related to Figure 1).
Allele frequencies of NPM1c locus in sorted OCI-AML3 cells transfected with sgNPM1c (Related to Figure 2).
Allele frequencies of NPM1c locus in primary AML samples transfected with sgNPM1c (Related to Figure 3).
Significantly downregulated genes following nuclear relocalization of NPM1c in OCI-AML3 and IMS-M2 cells (Related to Figure 5).
Complete sequences of custom oligonucleotides and HDR templates (Related to STAR Methods).
Relocalization or degradation of mutant NPM1 induces differentiation of AML cells
High HOX expression maintains the leukemic state in NPM1-mutant AML
HOX overexpression is directly dependent on mutant NPM1
AML dependency on mutant NPM1 can be exploited therapeutically
Significance.
The treatment of acute myeloid leukemia (AML) is still a challenge. This is partly due to an insufficient understanding of the molecular mechanisms that promote and maintain the leukemic state of AML cells. NPM1 mutations are among the most common genetic events in AML and their role in leukemogenesis is still obscure. Here, we show that HOX expression, differentiation levels and cell growth of AML cells are dependent on mutant NPM1 and its aberrant cytoplasmic localization. Additionally, we demonstrate that nuclear relocalization of NPM1c through inhibition of XPO1 results in differentiation of AML cells and in vivo antileukemic activity. This work provides a rationale for the use of nuclear export inhibitors in a large fraction of patients with AML.
Acknowledgments
This work was supported by DK092883, CA183252, CA222736, DK113705, CA125123, CA215452 and the Cancer Prevention Research Institute of Texas (RP140001 and RP160283). C.Y.L is a Cancer Prevention Research Institute of Texas Scholar (RR150093) and a Pew-Stewart Scholar for Cancer Research (Alexander and Margaret Stewart Trust). M.C.G. is supported by Baylor Research Advocates for Student Scientists and the Baylor College of Medicine Medical Scientist Training Program. This work was also supported by the Associazione Italiana per la Ricerca sul Cancro (AIRC IG 2016 n.18568), the European Research Council (ERC Adv Grant 2016 n.740230), the Leukemia and Lymphoma Society, CPRIT RP160693, MDACC MDS-AML Moonshot program, CA016672, the American Cancer Society (PF-17–010-01-CDD), the Claudia Adams Barr Program in Innovative Basic Cancer Research and the Damon Runyon Cancer Research Foundation DRG-2196–14.
Footnotes
Declaration of interests
D.L.B. is now an employee at Novartis.
Publisher's Disclaimer: This is a PDF file of an unedited manuscript that has been accepted for publication. As a service to our customers we are providing this early version of the manuscript. The manuscript will undergo copyediting, typesetting, and review of the resulting proof before it is published in its final citable form. Please note that during the production process errors may be discovered which could affect the content, and all legal disclaimers that apply to the journal pertain.
References
- Abdul Razak AR, Mau-Soerensen M, Gabrail NY, Gerecitano JF, Shields AF, Unger TJ, Saint-Martin JR, Carlson R, Landesman Y, McCauley D, et al. (2016). First-in-Class, First-in-Human Phase I Study of Selinexor, a Selective Inhibitor of Nuclear Export, in Patients With Advanced Solid Tumors. J Clin Oncol 34, 4142–4150. [DOI] [PMC free article] [PubMed] [Google Scholar]
- Alcalay M, Tiacci E, Bergomas R, Bigerna B, Venturini E, Minardi SP, Meani N, Diverio D, Bernard L, Tizzoni L, et al. (2005). Acute myeloid leukemia bearing cytoplasmic nucleophosmin (NPMc+ AML) shows a distinct gene expression profile characterized by upregulation of genes involved in stem-cell maintenance. Blood 106, 899–902. [DOI] [PubMed] [Google Scholar]
- Argiropoulos B, and Humphries RK (2007). Hox genes in hematopoiesis and leukemogenesis. Oncogene 26, 6766–6776. [DOI] [PubMed] [Google Scholar]
- Balusu R, Fiskus W, Rao R, Chong DG, Nalluri S, Mudunuru U, Ma H, Chen L, Venkannagari S, Ha K, et al. (2011). Targeting levels or oligomerization of nucleophosmin 1 induces differentiation and loss of survival of human AML cells with mutant NPM1. Blood 118, 3096–3106. [DOI] [PMC free article] [PubMed] [Google Scholar]
- Bolli N, Nicoletti I, De Marco MF, Bigerna B, Pucciarini A, Mannucci R, Martelli MP, Liso A, Mecucci C, Fabbiano F, et al. (2007). Born to be exported: COOH-terminal nuclear export signals of different strength ensure cytoplasmic accumulation of nucleophosmin leukemic mutants. Cancer Res 67, 6230–6237. [DOI] [PubMed] [Google Scholar]
- Brown JD, Lin CY, Duan Q, Griffin G, Federation A, Paranal RM, Bair S, Newton G, Lichtman A, Kung A, et al. (2014). NF-kappaB directs dynamic super enhancer formation in inflammation and atherogenesis. Mol Cell 56, 219–231. [DOI] [PMC free article] [PubMed] [Google Scholar]
- Brunetti L, Gundry MC, Kitano A, Nakada D, and Goodell MA (2018). H ighly Efficient Gene Disruption of Murine and Human Hematopoietic Progenitor Cells by CRISPR/Cas9. Journal of visualized experiments: JoVE. [DOI] [PMC free article] [PubMed] [Google Scholar]
- Buenrostro JD, Giresi PG, Zaba LC, Chang HY, and Greenleaf WJ (2013). Transposition of native chromatin for fast and sensitive epigenomic profiling of open chromatin, DNA-binding proteins and nucleosome position. Nat Methods 10, 1213–1218. [DOI] [PMC free article] [PubMed] [Google Scholar]
- Chen C, Siegel D, Gutierrez M, Jacoby M, Hofmeister CC, Gabrail N, Baz R, MauSorensen M, Berdeja JG, Savona M, et al. (2018). Safety and efficacy of selinexor in relapsed or refractory multiple myeloma and Waldenstrom macroglobulinemia. Blood 131, 855863. [DOI] [PubMed] [Google Scholar]
- Chen Y, Camacho SC, Silvers TR, Razak AR, Gabrail NY, Gerecitano JF, Kalir E, Pereira E, Evans BR, Ramus SJ, et al. (2017). Inhibition of the Nuclear Export Receptor XPO1 as a Therapeutic Target for Platinum-Resistant Ovarian Cancer. Clin Cancer Res 23, 1552–1563. [DOI] [PubMed] [Google Scholar]
- Chi HT, Vu HA, Iwasaki R, Nagamura F, Tojo A, Watanabe T, and Sato Y (2010). Detection of exon 12 type A mutation of NPM1 gene in IMS-M2 cell line. Leuk Res 34, 261262. [DOI] [PubMed] [Google Scholar]
- Doulatov S, Vo LT, Chou SS, Kim PG, Arora N, Li H, Hadland BK, Bernstein ID, Collins JJ, Zon LI, et al. (2013). Induction of multipotential hematopoietic progenitors from human pluripotent stem cells via respecification of lineage-restricted precursors. Cell Stem Cell 13, 459–470. [DOI] [PMC free article] [PubMed] [Google Scholar]
- Dovey OM, Cooper JL, Mupo A, Grove CS, Lynn C, Conte N, Andrews RM, Pacharne S, Tzelepis K, Vijayabaskar MS, et al. (2017). Molecular synergy underlies the co-occurrence patterns and phenotype of NPM1-mutant acute myeloid leukemia. Blood. [DOI] [PMC free article] [PubMed] [Google Scholar]
- Etchin J, Sanda T, Mansour MR, Kentsis A, Montero J, Le BT, Christie AL, McCauley D, Rodig SJ, Kauffman M, et al. (2013a). KPT-330 inhibitor of CRM1 (XPO1)mediated nuclear export has selective anti-leukaemic activity in preclinical models of T-cell acute lymphoblastic leukaemia and acute myeloid leukaemia. Br J Haematol 161, 117–127. [DOI] [PMC free article] [PubMed] [Google Scholar]
- Etchin J, Sun Q, Kentsis A, Farmer A, Zhang ZC, Sanda T, Mansour MR, Barcelo C, McCauley D, Kauffman M, et al. (2013b). Antileukemic activity of nuclear export inhibitors that spare normal hematopoietic cells. Leukemia 27, 66–74. [DOI] [PMC free article] [PubMed] [Google Scholar]
- Falini B, Bolli N, Liso A, Martelli MP, Mannucci R, Pileri S, and Nicoletti I (2009). Altered nucleophosmin transport in acute myeloid leukaemia with mutated NPM1: molecular basis and clinical implications. Leukemia 23, 1731–1743. [DOI] [PubMed] [Google Scholar]
- Falini B, Bolli N, Shan J, Martelli MP, Liso A, Pucciarini A, Bigerna B, Pasqualucci L, Mannucci R, Rosati R, et al. (2006). Both carboxy-terminus NES motif and mutated tryptophan(s) are crucial for aberrant nuclear export of nucleophosmin leukemic mutants in NPMc+ AML. Blood 107, 4514–4523. [DOI] [PubMed] [Google Scholar]
- Falini B, Mecucci C, Tiacci E, Alcalay M, Rosati R, Pasqualucci L, La Starza R, Diverio D, Colombo E, Santucci A, et al. (2005). Cytoplasmic nucleophosmin in acute myelogenous leukemia with a normal karyotype. The New England journal of medicine 352, 254–266. [DOI] [PubMed] [Google Scholar]
- Falini B, Nicoletti I, Martelli MF, and Mecucci C (2007). Acute myeloid leukemia carrying cytoplasmic/mutated nucleophosmin (NPMc+ AML): biologic and clinical features. Blood 109, 874–885. [DOI] [PubMed] [Google Scholar]
- Falini B, Sportoletti P, Brunetti L, and Martelli MP (2015). Perspectives for therapeutic targeting of gene mutations in acute myeloid leukaemia with normal cytogenetics. British journal of haematology 170, 305–322. [DOI] [PubMed] [Google Scholar]
- Feng J, Liu T, Qin B, Zhang Y, and Liu XS (2012). Identifying ChIP-seq enrichment using MACS. Nat Protoc 7, 1728–1740. [DOI] [PMC free article] [PubMed] [Google Scholar]
- Fornerod M, Ohno M, Yoshida M, and Mattaj IW (1997). CRM1 is an export receptor for leucine-rich nuclear export signals. Cell 90, 1051–1060. [DOI] [PubMed] [Google Scholar]
- Garzon R, Savona M, Baz R, Andreeff M, Gabrail N, Gutierrez M, Savoie L, MauSorensen PM, Wagner-Johnston N, Yee K, et al. (2017). A phase 1 clinical trial of singleagent selinexor in acute myeloid leukemia. Blood 129, 3165–3174. [DOI] [PMC free article] [PubMed] [Google Scholar]
- Gough SM, Slape CI, and Aplan PD (2011). NUP98 gene fusions and hematopoietic malignancies: common themes and new biologic insights. Blood 118, 6247–6257. [DOI] [PMC free article] [PubMed] [Google Scholar]
- Gounder MM, Zer A, Tap WD, Salah S, Dickson MA, Gupta AA, Keohan ML, Loong HH, D’Angelo SP, Baker S, et al. (2016). Phase IB Study of Selinexor, a First-inClass Inhibitor of Nuclear Export, in Patients With Advanced Refractory Bone or Soft Tissue Sarcoma. J Clin Oncol 34, 3166–3174. [DOI] [PMC free article] [PubMed] [Google Scholar]
- Grant CE, Bailey TL, and Noble WS (2011). FIMO: scanning for occurrences of a given motif. Bioinformatics 27, 1017–1018. [DOI] [PMC free article] [PubMed] [Google Scholar]
- Gravina GL, Senapedis W, McCauley D, Baloglu E, Shacham S, and Festuccia C (2014). Nucleo-cytoplasmic transport as a therapeutic target of cancer. J Hematol Oncol 7, 85. [DOI] [PMC free article] [PubMed] [Google Scholar]
- Grimwade D, Ivey A, and Huntly BJ (2016). Molecular landscape of acute myeloid leukemia in younger adults and its clinical relevance. Blood 127, 29–41. [DOI] [PMC free article] [PubMed] [Google Scholar]
- Grisendi S, Bernardi R, Rossi M, Cheng K, Khandker L, Manova K, and Pandolfi PP (2005). Role of nucleophosmin in embryonic development and tumorigenesis. Nature 437, 147–153. [DOI] [PubMed] [Google Scholar]
- Grisendi S, Mecucci C, Falini B, and Pandolfi PP (2006). Nucleophosmin and cancer. Nature reviews Cancer 6, 493–505. [DOI] [PubMed] [Google Scholar]
- Gu X, Mahfouz R, Ebrahem Q, Enane F, Radivoyevitch T, Clemente MJ, Pryzchodzen BP, Hu Z, Balusu R, Cotta CV, et al. (2016). The Mechanism By Which Mutant Nucleophosmin (NPM1) Creates Leukemic Self-Renewal Is Readily Reversed. In 60th American Society of Hematology Annual Meeting (San Diego, CA: American Society of Hematology), pp. 444. [Google Scholar]
- Gundry MC, Brunetti L, Lin A, Mayle AE, Kitano A, Wagner D, Hsu JI, Hoegenauer KA, Rooney CM, Goodell MA, et al. (2016). Highly Efficient Genome Editing of Murine and Human Hematopoietic Progenitor Cells by CRISPR/Cas9. Cell Rep 17, 1453–1461. [DOI] [PMC free article] [PubMed] [Google Scholar]
- Heath EM, Chan SM, Minden MD, Murphy T, Shlush LI, and Schimmer AD (2017). Biological and clinical consequences of NPM1 mutations in AML. Leukemia 31, 798–807. [DOI] [PubMed] [Google Scholar]
- Huang HT, Seo HS, Zhang T, Wang Y, Jiang B, Li Q, Buckley DL, Nabet B, Roberts JM, Paulk J, et al. (2017). MELK is not necessary for the proliferation of basal-like breast cancer cells. Elife 6. [DOI] [PMC free article] [PubMed] [Google Scholar]
- Ivey A, Hills RK, Simpson MA, Jovanovic JV, Gilkes A, Grech A, Patel Y, Bhudia N, Farah H, Mason J, et al. (2016). Assessment of Minimal Residual Disease in StandardRisk AML. N Engl J Med. [DOI] [PubMed] [Google Scholar]
- Kim D, Langmead B, and Salzberg SL (2015). HISAT: a fast spliced aligner with low memory requirements. Nat Methods 12, 357–360. [DOI] [PMC free article] [PubMed] [Google Scholar]
- Kogan SC, Ward JM, Anver MR, Berman JJ, Brayton C, Cardiff RD, Carter JS, de Coronado S, Downing JR, Fredrickson TN, et al. (2002). Bethesda proposals for classification of nonlymphoid hematopoietic neoplasms in mice. Blood 100, 238–245. [DOI] [PubMed] [Google Scholar]
- Kuhn MW, Song E, Feng Z, Sinha A, Chen CW, Deshpande AJ, Cusan M, Farnoud N, Mupo A, Grove C, et al. (2016). Targeting Chromatin Regulators Inhibits Leukemogenic Gene Expression in NPM1 Mutant Leukemia. Cancer Discov 6, 1166–1181. [DOI] [PMC free article] [PubMed] [Google Scholar]
- Kyba M, Perlingeiro RC, and Daley GQ (2002). HoxB4 confers definitive lymphoidmyeloid engraftment potential on embryonic stem cell and yolk sac hematopoietic progenitors. Cell 109, 29–37. [DOI] [PubMed] [Google Scholar]
- la Cour T, Kiemer L, Molgaard A, Gupta R, Skriver K, and Brunak S (2004). Analysis and prediction of leucine-rich nuclear export signals. Protein engineering, design & selection: PEDS 17, 527–536. [DOI] [PubMed] [Google Scholar]
- Langmead B, Trapnell C, Pop M, and Salzberg SL (2009). Ultrafast and memory-efficient alignment of short DNA sequences to the human genome. Genome biology 10, R25. [DOI] [PMC free article] [PubMed] [Google Scholar]
- Lee BH, Tothova Z, Levine RL, Anderson K, Buza-Vidas N, Cullen DE, McDowell EP, Adelsperger J, Frohling S, Huntly BJ, et al. (2007). FLT3 mutations confer enhanced proliferation and survival properties to multipotent progenitors in a murine model of chronic myelomonocytic leukemia. Cancer Cell 12, 367–380. [DOI] [PMC free article] [PubMed] [Google Scholar]
- Li H, Handsaker B, Wysoker A, Fennell T, Ruan J, Homer N, Marth G, Abecasis G, Durbin R, and Genome Project Data Processing, S. (2009). The Sequence Alignment/Map format and SAMtools. Bioinformatics 25, 2078–2079. [DOI] [PMC free article] [PubMed] [Google Scholar]
- Lin CY, Erkek S, Tong Y, Yin L, Federation AJ, Zapatka M, Haldipur P, Kawauchi D, Risch T, Warnatz HJ, et al. (2016). Active medulloblastoma enhancers reveal subgroupspecific cellular origins. Nature 530, 57–62. [DOI] [PMC free article] [PubMed] [Google Scholar]
- Mallardo M, Caronno A, Pruneri G, Raviele PR, Viale A, Pelicci PG, and Colombo E (2013). NPMc+ and FLT3_ITD mutations cooperate in inducing acute leukaemia in a novel mouse model. Leukemia 27, 2248–2251. [DOI] [PubMed] [Google Scholar]
- Martelli MP, Gionfriddo I, Mezzasoma F, Milano F, Pierangeli S, Mulas F, Pacini R, Tabarrini A, Pettirossi V, Rossi R, et al. (2015). Arsenic trioxide and all-trans retinoic acid target NPM1 mutant oncoprotein levels and induce apoptosis in NPM1-mutated AML cells. Blood 125, 3455–3465. [DOI] [PubMed] [Google Scholar]
- Martelli MP, Manes N, Liso A, Pettirossi V, Verducci Galletti B, Bigerna B, Pucciarini A, De Marco MF, Pallotta MT, Bolli N, et al. (2008). A western blot assay for detecting mutant nucleophosmin (NPM1) proteins in acute myeloid leukaemia. Leukemia 22, 2285–2288. [DOI] [PubMed] [Google Scholar]
- Moreno-Mateos MA, Vejnar CE, Beaudoin J-DD, Fernandez JP, Mis EK, Khokha MK, and Giraldez AJ (2015). CRISPRscan: designing highly efficient sgRNAs for CRISPRCas9 targeting in vivo. Nature methods 12, 982–988. [DOI] [PMC free article] [PubMed] [Google Scholar]
- Mupo A, Celani L, Dovey O, Cooper JL, Grove C, Rad R, Sportoletti P, Falini B, Bradley A, and Vassiliou GS (2013). A powerful molecular synergy between mutant Nucleophosmin and Flt3-ITD drives acute myeloid leukemia in mice. Leukemia 27, 1917–1920. [DOI] [PMC free article] [PubMed] [Google Scholar]
- Nabet B, Roberts JM, Buckley DL, Paulk J, Dastjerdi S, Yang A, Leggett AL, Erb MA, Lawlor MA, Souza A, et al. (2018). The dTAG system for immediate and targetspecific protein degradation. Nat Chem Biol 14, 431–441. [DOI] [PMC free article] [PubMed] [Google Scholar]
- Nakayama R, Zhang YX, Czaplinski JT, Anatone AJ, Sicinska ET, Fletcher JA, Demetri GD, and Wagner AJ (2016). Preclinical activity of selinexor, an inhibitor of XPO1, in sarcoma. Oncotarget 7, 16581–16592. [DOI] [PMC free article] [PubMed] [Google Scholar]
- Oka M, Mura S, Yamada K, Sangel P, Hirata S, Maehara K, Kawakami K, Tachibana T, Ohkawa Y, Kimura H, et al. (2016). Chromatin-prebound Crm1 recruits Nup98-HoxA9 fusion to induce aberrant expression of Hox cluster genes. eLife 5. [DOI] [PMC free article] [PubMed] [Google Scholar]
- Papaemmanuil E, Gerstung M, Bullinger L, Gaidzik VI, Paschka P, Roberts ND, Potter NE, Heuser M, Thol F, Bolli N, et al. (2016). Genomic Classification and Prognosis in Acute Myeloid Leukemia. N Engl J Med 374, 2209–2221. [DOI] [PMC free article] [PubMed] [Google Scholar]
- Quentmeier H, Martelli MP, Dirks WG, Bolli N, Liso A, Macleod RA, Nicoletti I, Mannucci R, Pucciarini A, Bigerna B, et al. (2005). Cell line OCI/AML3 bears exon-12 NPM gene mutation-A and cytoplasmic expression of nucleophosmin. Leukemia 19, 1760–1767. [DOI] [PubMed] [Google Scholar]
- Ramirez F, Dundar F, Diehl S, Gruning BA, and Manke T (2014). deepTools: a flexible platform for exploring deep-sequencing data. Nucleic Acids Res 42, W187–191. [DOI] [PMC free article] [PubMed] [Google Scholar]
- Ramsey SA, Knijnenburg TA, Kennedy KA, Zak DE, Gilchrist M, Gold ES, Johnson CD, Lampano AE, Litvak V, Navarro G, et al. (2010). Genome-wide histone acetylation data improve prediction of mammalian transcription factor binding sites. Bioinformatics 26, 2071–2075. [DOI] [PMC free article] [PubMed] [Google Scholar]
- Ranganathan P, Yu X, Na C, Santhanam R, Shacham S, Kauffman M, Walker A, Klisovic R, Blum W, Caligiuri M, et al. (2012). Preclinical activity of a novel CRM1 inhibitor in acute myeloid leukemia. Blood 120, 1765–1773. [DOI] [PMC free article] [PubMed] [Google Scholar]
- Robinson JT, Thorvaldsdottir H, Winckler W, Guttman M, Lander ES, Getz G, and Mesirov JP (2011). Integrative genomics viewer. Nat Biotechnol 29, 24–26. [DOI] [PMC free article] [PubMed] [Google Scholar]
- Sauvageau G, Lansdorp PM, Eaves CJ, Hogge DE, Dragowska WH, Reid DS, Largman C, Lawrence HJ, and Humphries RK (1994). Differential expression of homeobox genes in functionally distinct CD34+ subpopulations of human bone marrow cells. Proc Natl Acad Sci U S A 91, 12223–12227. [DOI] [PMC free article] [PubMed] [Google Scholar]
- Sauvageau G, Thorsteinsdottir U, Hough MR, Hugo P, Lawrence HJ, Largman C, and Humphries RK (1997). Overexpression of HOXB3 in hematopoietic cells causes defective lymphoid development and progressive myeloproliferation. Immunity 6, 13–22. [DOI] [PubMed] [Google Scholar]
- Schlenk RF, Döhner K, Krauter J, Fröhling S, Corbacioglu A, Bullinger L, Habdank M, Späth D, Morgan M, Benner A, et al. (2008). Mutations and treatment outcome in cytogenetically normal acute myeloid leukemia. The New England journal of medicine 358, 1909–1918. [DOI] [PubMed] [Google Scholar]
- Schmidl C, Rendeiro AF, Sheffield NC, and Bock C (2015). ChIPmentation: fast, robust, low-input ChIP-seq for histones and transcription factors. Nat Methods 12, 963–965. [DOI] [PMC free article] [PubMed] [Google Scholar]
- Spencer DH, Young MA, Lamprecht TL, Helton NM, Fulton R, O’Laughlin M, Fronick C, Magrini V, Demeter RT, Miller CA, et al. (2015). Epigenomic analysis of the HOX gene loci reveals mechanisms that may control canonical expression patterns in AML and normal hematopoietic cells. Leukemia 29, 1279–1289. [DOI] [PMC free article] [PubMed] [Google Scholar]
- Sportoletti P, Varasano E, Rossi R, Bereshchenko O, Cecchini D, Gionfriddo I, Bolli N, Tiacci E, Intermesoli T, Zanghì P, et al. (2013). The human NPM1 mutation A perturbs megakaryopoiesis in a conditional mouse model. Blood 121, 3447–3458. [DOI] [PubMed] [Google Scholar]
- Subramanian A, Tamayo P, Mootha VK, Mukherjee S, Ebert BL, Gillette MA, Paulovich A, Pomeroy SL, Golub TR, Lander ES, et al. (2005). Gene set enrichment analysis: a knowledge-based approach for interpreting genome-wide expression profiles. Proc Natl Acad Sci U S A 102, 15545–15550. [DOI] [PMC free article] [PubMed] [Google Scholar]
- Trapnell C, Roberts A, Goff L, Pertea G, Kim D, Kelley DR, Pimentel H, Salzberg SL, Rinn JL, and Pachter L (2012). Differential gene and transcript expression analysis of RNA-seq experiments with TopHat and Cufflinks. Nat Protoc 7, 562–578. [DOI] [PMC free article] [PubMed] [Google Scholar]
- Tzelepis K, Koike-Yusa H, De Braekeleer E, Li Y, Metzakopian E, Dovey OM, Mupo A, Grinkevich V, Li M, Mazan M, et al. (2016). A CRISPR Dropout Screen Identifies Genetic Vulnerabilities and Therapeutic Targets in Acute Myeloid Leukemia. Cell Rep 17, 1193–1205. [DOI] [PMC free article] [PubMed] [Google Scholar]
- Wang A, Han Y, Chen P, Jia N, and Minden MD (2018). Cytoplasmic mislocalization of CTCF by NPM1c in acute myeloid leukemia resulting in inhibited CTCF regulatory functions generating aberrant genetic and epigenetic profiles. In AACR Annual Meeting 2018 (Chicago, IL: American Association for Cancer Research), pp. Abstract #2991. [Google Scholar]
- Wang T, Yu H, Hughes NW, Liu B, Kendirli A, Klein K, Chen WW, Lander ES, and Sabatini DM (2017). Gene Essentiality Profiling Reveals Gene Networks and Synthetic Lethal Interactions with Oncogenic Ras. Cell 168, 890–903 e815. [DOI] [PMC free article] [PubMed] [Google Scholar]
- Wang Y, Yates F, Naveiras O, Ernst P, and Daley GQ (2005). Embryonic stem cellderived hematopoietic stem cells. Proc Natl Acad Sci U S A 102, 19081–19086. [DOI] [PMC free article] [PubMed] [Google Scholar]
- Whyte WA, Orlando DA, Hnisz D, Abraham BJ, Lin CY, Kagey MH, Rahl PB, Lee TI, and Young RA (2013). Master transcription factors and mediator establish superenhancers at key cell identity genes. Cell 153, 307–319. [DOI] [PMC free article] [PubMed] [Google Scholar]
- Xu H, Valerio DG, Eisold ME, Sinha A, Koche RP, Hu W, Chen CW, Chu SH, Brien GL, Park CY, et al. (2016). NUP98 Fusion Proteins Interact with the NSL and MLL1 Complexes to Drive Leukemogenesis. Cancer Cell 30, 863–878. [DOI] [PMC free article] [PubMed] [Google Scholar]
Associated Data
This section collects any data citations, data availability statements, or supplementary materials included in this article.
Supplementary Materials
Allele frequencies of NPM1c locus in AML cell lines transfected with sgNPM1c (Related to Figure 1).
Allele frequencies of NPM1c locus in sorted OCI-AML3 cells transfected with sgNPM1c (Related to Figure 2).
Allele frequencies of NPM1c locus in primary AML samples transfected with sgNPM1c (Related to Figure 3).
Significantly downregulated genes following nuclear relocalization of NPM1c in OCI-AML3 and IMS-M2 cells (Related to Figure 5).
Complete sequences of custom oligonucleotides and HDR templates (Related to STAR Methods).