Abstract
We derive a volumetric source term for the Euler and Navier-Stokes equations that mimics the generation of unidirectional acoustic waves from an arbitrary smooth surface in three-dimensional space. The model is constructed as a linear combination of monopole and dipole sources in the mass, momentum, and energy equations. The singular source distribution on the surface is regularized on a computational grid by convolution with a smeared Dirac delta function. The source is implemented in the Euler equations using a Cartesian-grid finite-volume WENO scheme, and validated by comparing with analytical solution for unidirectional planar and spherical acoustic waves. Using the scheme, we emulate a spherical piezoelectric transducer and a multi-array transducer to simulate focused ultrasound fields in water. The simulated ultrasound fields show favorable agreement with previous experiments.
Keywords: Directional source modeling, Euler and Navier-Stokes equation, Direct numerical simulation, Transducer modeling
1. Introduction
Simulation of linear and nonlinear acoustic fields using the Euler or Navier-Stokes equations is of use in diverse applications such as medical ultrasound and shockwave therapy[1], aeroacoustics [2], and underwater acoustics[3]. For many applications, a source of acoustic waves is modeled as an oscillating surface. Treating the source surface as a real oscillating surface requires either body-fitted grids or immersed boundary/surface techniques, see for example [4, 5, 6]. In many cases, however, the surface itself is irrelevant to the ensuing dynamics, and we therefore seek an immersed, volumetric representation of acoustic waves produced at such an immersed surface, but without explicitly modeling the surface as a boundary condition. It is desirable in such a source to suppress generation of waves from the “back” of the surface; even if the presence of the direct waves generated can be tolerated, their reflection from open computational boundaries (with imperfectly non-reflecting boundary conditions) can lead to undesirable contamination of the solution. Improving the boundary conditions and/or enlarging the domain can be a cumbersome [7], and we therefore further seek to require that the source generate a set of unidirectional waves to the surface normal.
A related problem is parabolization[8, 9], which seeks to derive well-posed equations that support only waves propagating in a single direction (or over a limited range of angles). This is distinct from the simpler goal of the present paper, which is to obtain one-way sources for use in the full governing equations. To do so, we use a concept from active noise reduction[10, 11], which is that by placing sound sources of controlled phase delay at proper locations, resulting sound waves propagating in a particular direction can be actively canceled[12]. To do this, we distribute singular sources of mass, momentum, and energy on a three-dimensional surface and use a smeared Dirac delta function to regularize the singular distribution to a volume surrounding the surface. The Green’s function solution for locally planar waves is then used to construct an anti-sound source for waves propagating in one direction. The superposition of these sources gives the desired one-way source.
The model is validated with analytical solutions for spherical and planar waves, and then used to model a single element, high-intensity focused ultrasound (HIFU) transducer and a multi-array medical transducer on a portion of a spherical surface. We compare the acoustic field produced by the one-way source for the single-element transducer with experimental measurements reported by Canney et al[13] in both linear and nonlinear regimes, and that of the multi-array transducer with measurements reported by Maxwell [14] in a linear regime. The proposed model can in principle be combined with any discretization of the Euler or Navier-Stokes equations.
2. Model
2.1. Inhomogeneous Euler equations
To model acoustic generation in a fluid by forcing, we consider the compressible, inhomogeneous Euler equations,
| (1) |
| (2) |
| (3) |
where S1, S2 and S3 represent scalar mass, vector momentum, and scalar energy sources, respectively. We close the equation by stiffened gas equation of state:
| (4) |
where ε is the specific internal energy, with , and γ and π∞ are parameters. Ideal gas equation of state is recovered with π∞ = 0. In the present study we use (γ, π∞) = (1.4, 0) for air and (γ, π∞) = (7.1, 3.06 × 10⁹) for water, respectively.
Our goal is to find a combination of S1, S2 and S3 that generates one-way waves. To this aim, in the following we will compute general solutions of the equation in terms of arbitrary S1, S2 and S3. First we rewrite the equation in terms of linear perturbation about a quiescent state:
| (5) |
| (6) |
| (7) |
where scripts ()′ and ()0 denote variables at perturbed and stationary states, respectively. The linearized equations may be further manipulated to obtain
| (8) |
| (9) |
| (10) |
where ω′ = ∇ × u′ is the vorticity perturbation, s′ is the entropy perturbation and T0 is the backgrounds temperature. In general, with a presence of entropy source at the source surface (e.g. heat injection), the right hand side of equation (10) is non-zero. In the present study, to avoid generating entropy at the surface, we therefore set . The curl of the source distribution S2 will, unavoidably, create vorticity perturbations near an arbitrarily shaped surface. For some simple geometries, including plane waves, the curl will be identically zero, but, in any case, the vorticity generated will remain confined to a small Stokes layer near the surface in an otherwise quiescent media.
Using a Green’s function, the solution of the equation (8) is given as
| (11) |
The essential idea of our model is to consider a local region on the two-dimensional surface as locally spherical (with planar as a special case), and use the appropriate Green’s function to derive a set of sources and anti-sources that produce the desired one-way wave field. To motivate the general case, we first examine planar and spherical surfaces in the next two sections. The cylindrical surface, for which a closed-form solution for one-way waves does not exist, is discussed in Appendix A.
2.2. Plane wave
We consider forcing a three-dimensional, initially quiescent, unbounded field of domain using the source model for one-way plane wave. To this end we define a source plane represented by x = x0 on which the source of the same strength is uniformly distributed. The source terms S1 and S2 can be expressed as
| (12) |
| (13) |
where f(t) and g(t) are arbitrary functions satisfying causality condition: f(t) = g(t) = 0 for t < 0. Though the analytical expressions for S1 and S2 are presented by Ffowcs-Williams[10], in the context of anti-sound generation for active noise control, we repeat the derivation for clarity.
The Green’s function for the one-dimensional wave equation is
| (14) |
where H is Heaviside step function. Substituting S1 and S2 into the solution above, we obtain
| (15) |
| (16) |
| (17) |
We can compute the integrals (A) and (B) as
| (18) |
| (19) |
| (20) |
| (21) |
| (22) |
| (23) |
| (24) |
| (25) |
to obtain
| (26) |
Thus we see that the mass source S1 acts as a monopole that generates outgoing waves of the same amplitude and the same sign, propagating in both ±x directions, while the momentum source S2 acts as a dipole that generates outgoing waves of the same amplitude, but opposite sign, propagating in ±x directions.
By defining f(t) = g(t)/c, we obtain
| (27) |
| (28) |
| (29) |
This is clearly a one-way solution that represents waves propagating only in +x direction. The waves caused by S1 and S2 propagating in −x direction cancel with each other since they have the same amplitude but opposite signs. In addition to the noise control, cancellation of a component of waves propagating in a particular direction by superposition of multiple sources, has been applied to analytical representation of Gaussian beam by point sources and sinks[15].
2.3. Spherical wave
Next, we consider an acoustic source distributed on a spherical surface represented by x = x0, where x is now the radius in spherical polar coordinates, to generate a one-way spherical wave. The wave equation in terms of x becomes
| (30) |
where we have used the definition of Laplacian in spherical polar coordinates . Notice that we can reformulate the equation in terms of xp:
| (31) |
Then we can apply the same Green’s function used for the plane source distribution to obtain:
| (32) |
| (33) |
| (34) |
Integral (A) follows that used in the planer wave solution. The integral (C) differs from (B). We further compute
| (35) |
| (36) |
| (37) |
Integral (D) becomes
| (38) |
| (39) |
where Gg(t) is the anti-derivative of g(t) and C(x) is an integration constant.
By using the expressions for (A) – (C), we obtain the following solution:
| (40) |
C(x) can be obtained by comparing this solution with the initial condition, p(x, t = 0).
We see that, the waves generated by the mass source S1 is a monopole solution like in the planer solution, while the waves generated by the momentum source S2 also contains a monopole solution, in addition to the dipole component seen in the planer wave solution. The monopole component induced by S2 clearly originates from the spherical geometry. It is straight forward that defining
| (41) |
makes the following one-way wave solution propagating outward:
| (42) |
Despite its simplicity, this form of the one-way spherical wave source has not, to our knowledge, been previously reported.
2.4. Arbitrary, smooth surfaces
For the general case of acoustic source that is distributed on combinations of arbitrary but smooth, two-dimensional surfaces, we may combine the plane, cylindrical and/or spherical one-way sources as building blocks that align on the source plane. As an example of such cases, in section 4.4 we will demonstrate a simulation of acoustic fields generated by a multi-array medical transducer, using a combination of spherical one-way sources to model the transducer elements.
3. Numerical method
In principle, the models for one-way source derived in the previous section can be used for any numerical methods that solve Euler or Navier-Stokes equations. For good accuracy, the waves should be introduced into a region of approximately quiescent flow, and the amplitude should be limited such that the linearization, upon which the source model rests, holds. Regardless, we can simply amend the derived source terms to the original nonlinear equations. In the present study, we use a finite-volume, fifth-order WENO scheme[16] both in cylindrical coordinates with an azimuthal symmetry and Cartesian coordinates. High-order WENO scheme is particularly capable of accurately simulating discontinuous solutions, including shock wave and material interface[17].
In the following we describe a method of numerical representation of the governing equation in cylindrical coordinates with azimuthal symmetry. That in 3D Cartesian coordinates can be trivially derived in a similar manner, and thus is omitted here. We spatially discretize the forced Euler equation in the following form:
| (43) |
where q is the vector of conservative variables, f, g are vectors of fluxes, s is the vector of source terms and the superscripts (·)g and (·)s denote the geometrical flux and the acoustic source, respectively. This formulation is convenient since the variables can be discretized in 2D Cartesian coordinates[18]. We integrate the above equation in arbitrary finite volume grid cell
| (44) |
where i and j are the indices of the cells in z− and r−directions, and zi±1/2 and rj±1/2 are the positions of cell faces. At each finite volume cell, we express the equation in the following semi-discrete form:
| (45) |
The conservative variables at cell faces are reconstructed by 5th order WENO scheme from the cell-centered values, then are used in HLLC Riemann solver to calculate the fluxes. A symmetry boundary condition is used at the domain boundary corresponding to the axis of symmetry, r = 0, and approximately nonreflecting, characteristic boundary conditions are used at other domain boundaries[19]. Further details are provided in [17, 20].
We express the forcing term ss defined on a surface Γ using the following integral representation:
| (46) |
where ξ is the coordinate defined on Γ, ΩΓ(ξ, t) is the forcing, and X(ξ, t) ∈ Γ is the function that maps ξ to x.
In z − r 2D axi-symmetric coordinates, we can represent arbitrary surface with axi-symmetric geometry by a curve L. L can be parametrized by a single scalar ξ, thus we have
| (47) |
where dξ is the line element of L.
We express the forcing at cell Ii,j by
| (48) |
where δh is a smeared delta function, Δξk is the length of kth line elements of L, and k ∈ ℤ : k ∈ [1, K]. Various forms of δh are available[21]. In the present study we employ the second-order, two-dimensional Gaussian function:
| (49) |
where σ is the support width. Typically σ = O(Δ) is taken, where Δ is the characteristic grid size at the region of the source. The overall rate of grid convergence of the scheme is second-order in smooth regions of the field. We note that the second order accuracy of the scheme for smooth regions is due to the second-order accurate spatial discretization of the geometrical flux, shown in equation (45), despite 5th order WENO scheme is used for reconstruction of variables at cell faces. Temporal integration of the partial differential equation is realized by third-order total variation diminishing Runge-Kutta scheme (TVD-RK)[22].
4. Numerical Results
We now verify and validate the one-way source models. First, we verify the source model by simulating the one- and three-dimensional sources for which analytical solutions are available. Next we consider HIFU waves produced on a portion of a spherical shell and compare with previous experimental measurements as well as numerical solutions employing the KZK equation. Finally, we apply the spherical one-way source to 3D simulation of a ultrasound generation with a multi-array medical transducer, then compare the simulated acoustic fields with experimental measurements.
4.1. Simulation of a plane Gaussian pulse
We first simulate a one-way, Gaussian acoustic pulse in air propagating in +z direction from the source distributed on the plane of z = 0. On z − r Cartesian grid, since the line source is aligned on the r axis, source representation can be simplified by smearing the source in ±z direction to express the source term as
| (50) |
where and
| (51) |
where σt is the support width of the Gaussian pulse in the time space and t0 is the delay. We take pa = 10 Pa, σt = 5 µs and t0 = 20 µs. The simulation domain is z ∈ [−20, 20] and r ∈ [0, 20] mm. The initial condition is given by (ρ, u, p) = (1.204, 0, 101325), where the density, velocity and pressure are in kg/m3, m/s and Pa, respectively. The simulation is evolved with a constant time-step, Δt = 160 ns. 200×100 uniform computational grids are used.
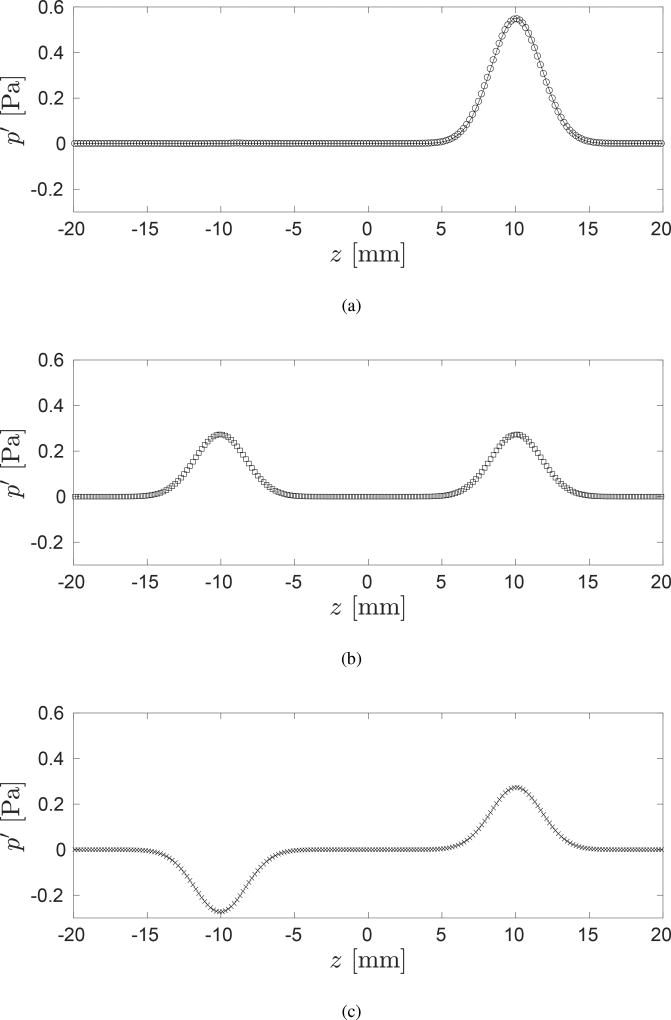
In Fig. 1a we compare the analytical and numerical solutions of p′ at t = 49.3 µs. For reference, We plot the components of the numerical solution of p′ that emanate from the mass and the momentum sources in Fig. 1b and c, respectively. The results show that the numerical solution agrees well with the analytical solution. As expected, in the right-going part of the numerical solution, the component from the mass source, identified as a monopole, has the same amplitude and sign with those of the component from the momentum source, thus they get amplified with each other. In the left-going part, the component from the mass source and that of the momentum source have the same amplitude but opposite sign, thus they cancel with each other.
Figure 1.
The pressure distribution on the z-axis at t = 49.3 µs. (a) The analytical (−) and numerical (◦) solutions are compared. The components of the numerical solution that emanate from (b) the mass source (□) and (c) momentum source (×) are plotted for reference
4.2. Simulation of a spherical sinusoidal pulse
Secondly, we simulate a one-way, sinusoidal acoustic pulse in water propagating inward from a uniform acoustic source distributed on a spherical shell with its center located at the origin, and with the radius of r0 = 15 mm. The expressions used for the source terms are , where, with angular frequency ω = 2πfs,
| (52) |
| (53) |
| (54) |
The spherical shell is represented as an upper hemi-circle in the z − r coordinate plane. ξ is defined as the polar angle that parametrizes the arc of the hemi-circle; ξ ∈ ℝ : ξ ∈ [0, π] and X(ξ) = [r0cosξ, r0sinξ]. The geometrical components of the mass source Gg(t) and C are expressed as
| (55) |
| (56) |
We take pa = 10 Pa, fs = 3.0 × 10⁵ Hz, and t0 = π/(2f) s. The simulation domain is z ∈ [−20, 20] and r ∈ [0, 20] mm. We evolve the simulation with the initial condition given by (ρ, u, p) = (1000, 0, 101325), where the density, velocity and pressure are in kg/m3, m/s and Pa, respectively. The simulation is evolved with a constant time-step, Δt = 20 ns. 800×400 uniform computational grids are used.
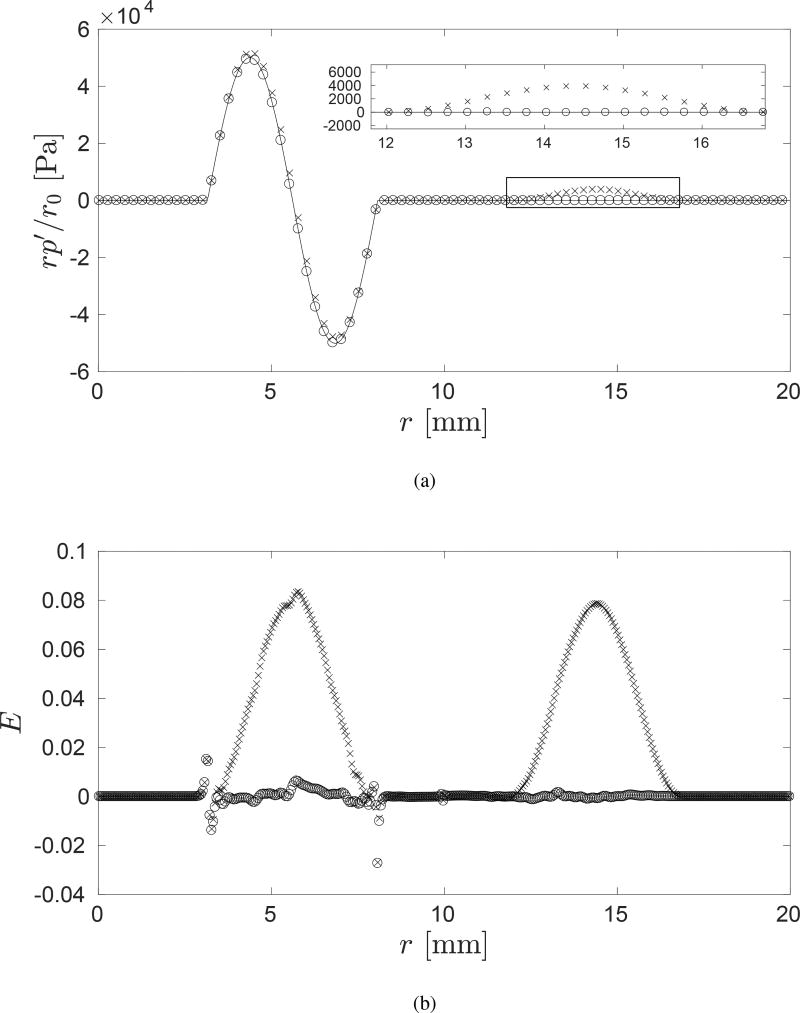
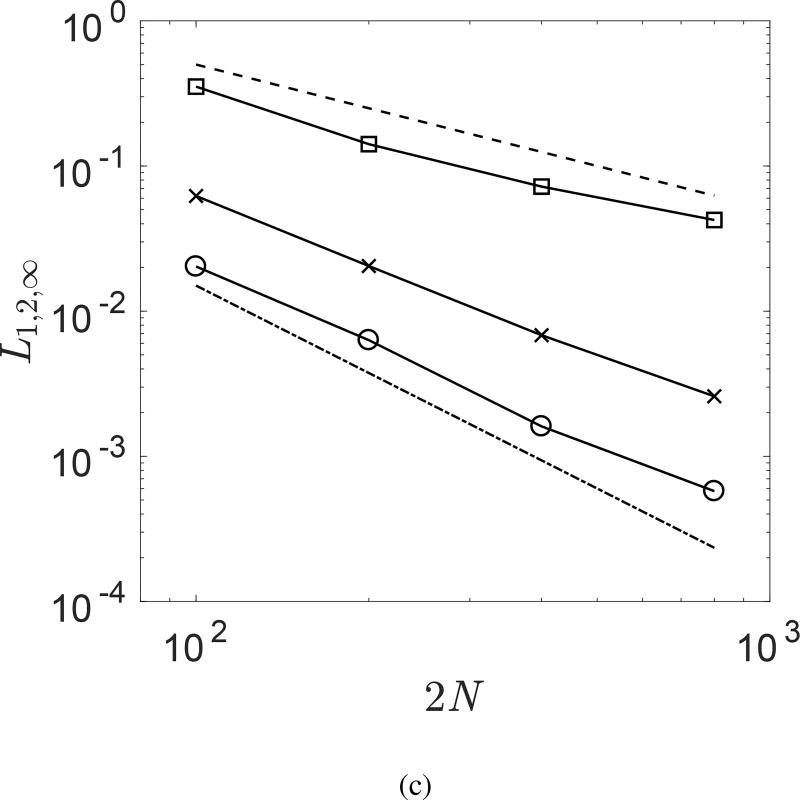
In Fig. 2(a) we compare the distribution of the analytical and numerical solutions of the pressure scaled by the radial coordinate, rp′/r0, on the r-axis at t = 5.12 µs. The numerical solution with and without the geometric component in the source term, G(t), are plotted. The result shows that the numerical solution with G(t) agrees well with the analytical solution, while that without G(t) does not. Fig. 2(b) shows the error defined as for the numerical solution with and without G(t). The difference between the two errors corresponds to the wave excited by G(t) in the numerical solution. The difference in the error is composed of an incoming and outgoing component of the same form and amplitude. This observation agrees with the result of our modeling that the geometrical component of the momentum source corresponds to monopole excitation. Finally, a convergence study is performed on the pressure. Fig. 2(c) shows L1,2,∞-norm of the error between the analytical solution and the numerical solution with G(t), both of which are shown in Fig. 2(a), as a function of the grid size. The result indicates that the numerical solution is first-order accurate. While the underlying finite-volume scheme being used is second-order accurate (for smooth solution), our regularization of the singular source on the scale of the grid spacing strands a first-order error in the source representation [23].
Figure 2.
(a) The distribution of the scaled pressure rp′/r0 on the r-axis at t = 5.12 µs. The analytical (−) and numerical (◦) solutions are compared. The numerical solution with and without the geometric component in the source term, G(t)), (×) are plotted. One of every five data points are shown for the numerical solutions. (b) The magnitude of the scaled error between the same analytical and numerical solutions, , on the r-axis at t = 5.12 µs. The error in terms of the numerical solution with the geometric component (◦) and without the geometric component (×) in the source term are plotted. (c)L1,2,∞-norm of the error between the analytical solution and the numerical solution at t = 5.12 µs as a function of the grid size (2N × N). Reference slopes for the first and second order convergence are included.
4.3. High-Intensity Focused Ultrasound
Next, we simulate a focused ultrasound field generated by a medical transducer studied by Canney et al. [13]. The transducer is composed of a single element of spherically focused, piezoceramic crystal with a characteristic frequency of 2.158 MHz. Following the linear analysis of a focused acoustic field by Canney et al., we define the aperture and radius of curvature of the transducer as 42.0 mm and 44.4 mm, respectively. On the z − r coordinate plane, we define the source as the arc of the circular section with its center located at the origin, radius r0 = 22 mm and central angle α/2. ξ is defined as the polar angle that parametrizes the arc of the circular section; ξ ∈ ℝ : ξ ∈ [0, α/2] and X(ξ) = [r0cosξ, r0sinξ]. Definition of the source follows equation (58–54). The simulation domain is z ∈ [−0.6, 68.4] and r ∈ [0, 24] mm. The initial condition is given by (ρ, u, p) = (1, 0, 101325), where the density, velocity and pressure are in kg/m3, m/s and Pa, respectively.
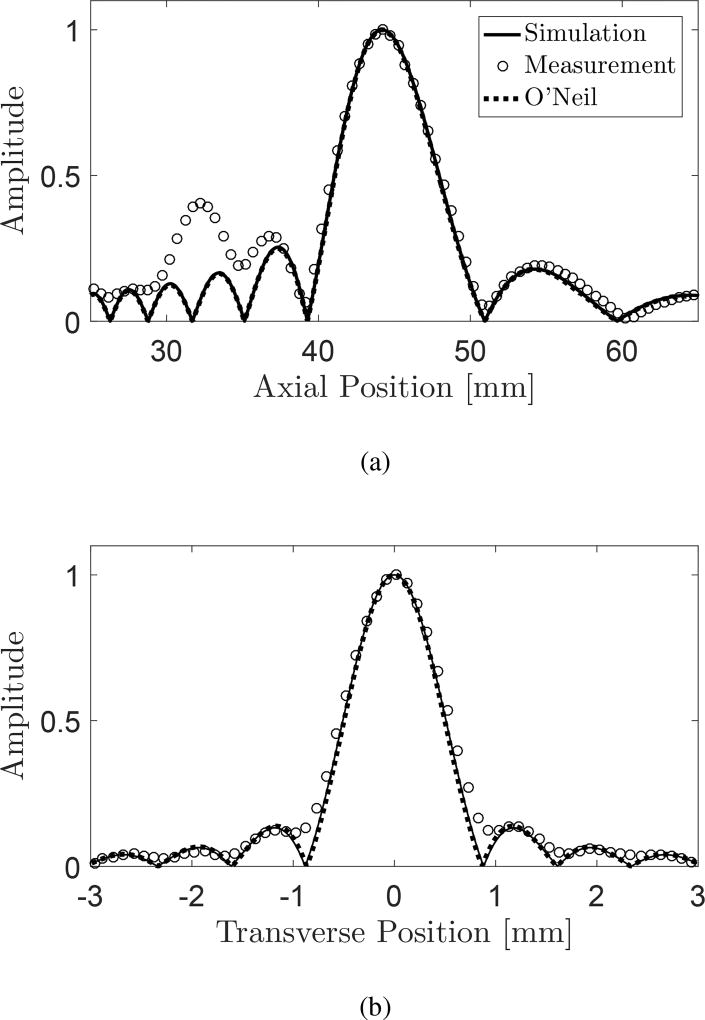
To validate the source model for the transducer, we first simulate a focused acoustic field in the linear regime with a source amplitude of pa = 1.0×10⁴ Pa to obtain the axial and focal scan of the pressure, for which an experimental measurement and analytical solution are available. The simulation is evolved with a constant time-step, Δt = 6.75 ns. 3250×1200 uniform computational grids, with a cell size of Δx = Δy = 20 µm, are used. In Fig. 3 we compare the results. The present simulation agrees very well with the analytical solution, and relatively well with the experimental measurement. We also note that the gain of the transducer obtained in the simulation is Ga = 48, where Ga = pf/pa and pf is the focal pressure. The value of the gain agrees with that of both the measurement and analytical solution. The discrepancy between the experimental measurement, notably seen in the pre-focal regions on the axis, can be explained by a non-uniform velocity distribution on the piezoceramic plate of the real transducer, that are not considered in the simulation and the analytical solution.
Figure 3.
The (a) axial and (b) focal scans of the pressure field in water by the SEA hydrophone for p0 = 1.0 × 10⁴ Pa. The result of the direct numerical simulation (−), and SEA hydrophone measurement by Canney et al., [13] (◦), and O’Neal analytic solution (- -) [24] are compared.
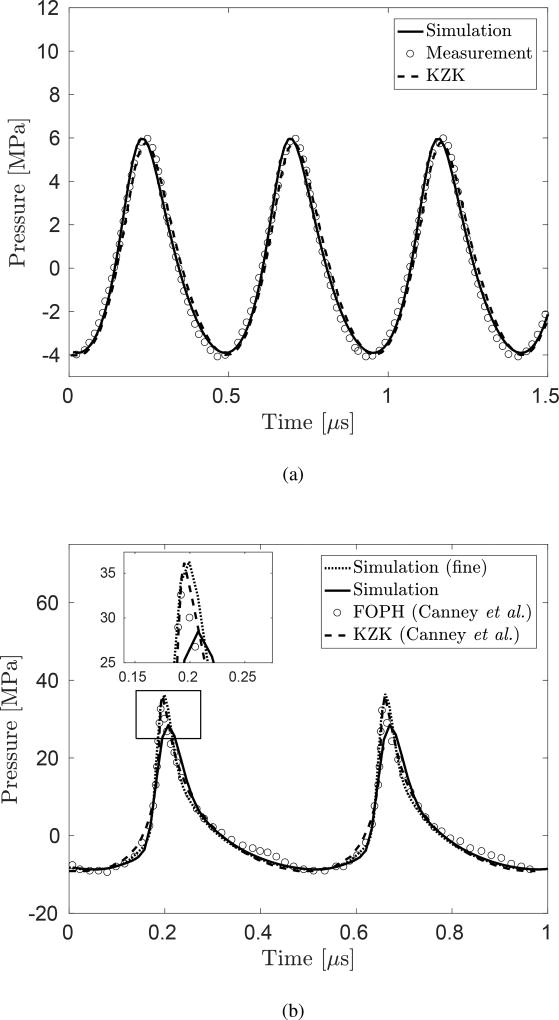
Next we simulate focused acoustic fields in nonlinear regimes with a source amplitude of pa = 1.0 × 10⁵ Pa using uniform grids with a cell size of Δx = Δy = 20 µm, and pa = 2.9 × 10⁵ Pa using two distinct resolutions of uniform grids with a cell size of Δx = Δy = 20 µm and Δx = Δy = 12.5 µm, respectively. In Fig. 4 we compare the focal pressure evolutions obtained from the present simulations and the experimental measurement conducted by Canney et al. The corresponding solutions of the KZK equation presented in Canney et al are also plotted. In the case with pa = 1.0 × 10⁵ Pa, shown in Fig. 4a, the result of the simulation agrees very well with the measurement as well as the solution of the KZK equation. The acoustic field in the focal region is in a weekly nonlinear regime. The amplitude of the positive peak is 6 MPa, while that of the negative peak is 4 MPa. The wave form is not largely distorted from a sinusoidal form. In the case with pa = 2.9 × 10⁵ Pa, shown in Fig. 4b, the wave form obtained by the simulations agrees well with the measurement. The maximum pressure obtained by the simulation with coarse grids is slightly lower than that of the others, shown in the inset of Fig. 4b. This is due to numerical dissipation that reduces the amplitude of the sharp peak formed by nonlinear sharpening. As shown by the result of the simulation using fine grids, this dissipation can be reduced by refining the grid.
Figure 4.
The focal pressure evolutions in water with (a) pa = 1.0 × 10⁵ and (b) pa = 2.9 × 10⁵. In the plot (a), the result of the direct numerical simulation (−), FOPH measurement by Canney et al (◦) [13], and analytical solution calculated with the KZK equation presented in Canney et al [13] (- -) are compared. In the plot (b), the results of the direct numerical simulation with a cell size of Δx = Δy = 12.5 µm (- -) and Δx = Δy = 20 µm (−) are compared with FOPH measurement and analytical solution calculated with the KZK equation.
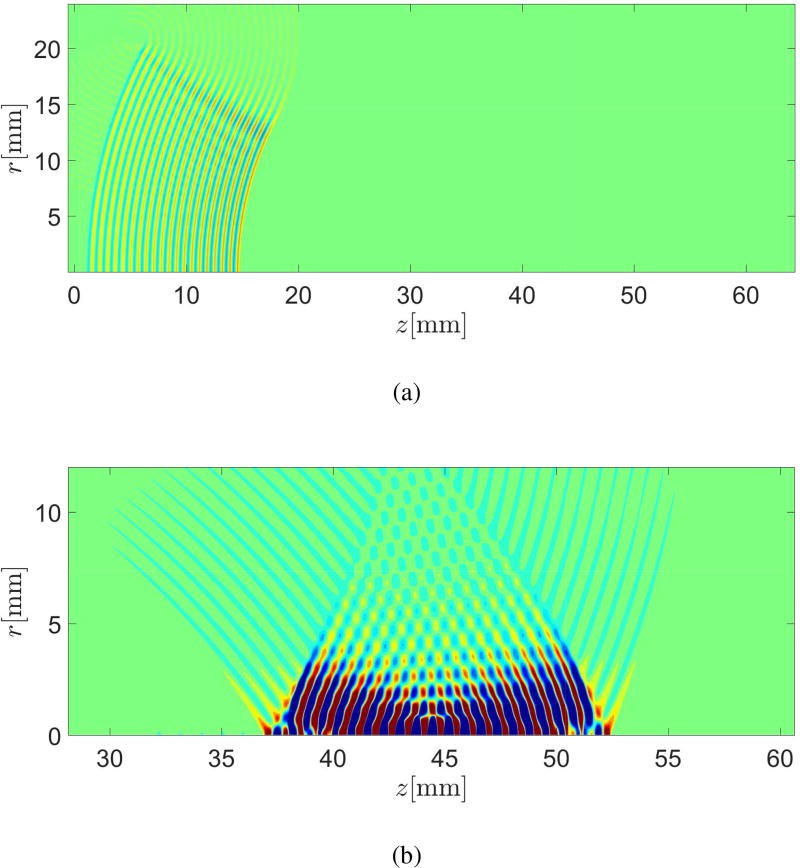
Fig. 5 shows the flooded pressure contour of the simulated acoustic fields with pa = 2.9 × 10⁵ at t = 20 µs and t = 70 µs. The waves generated on the source plane propagate and get focused toward the focal region. Waves propagating outward from the source plane are canceled.
Figure 5.
Flooded pressure contour of the simulated acoustic fields with pa = 2.9 × 10⁵ at (a) t = 20 µs and (b) t = 70 µs. The contour level is ±1 MPa
4.4. Multi-array transducer
Finally, we simulate a focused acoustic field generated by a medical, multi-array transducer in a linear regime using the one-way spherical source, and validate the simulation with an experimental measurement. The purpose of this case is to demonstrate the feasibility of the proposed source models for applications to a non-trivial source geometry.
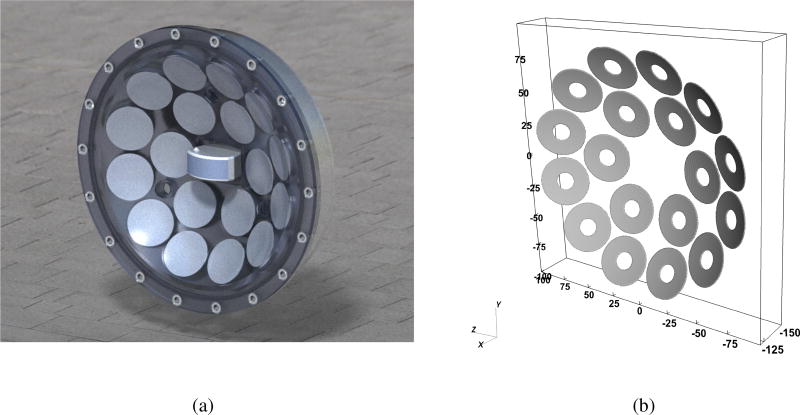
Fig. 6a shows an image of the multi-array transducer. The transducer is composed of 18 circular elements made from a ring-shaped piezo-ceramic plate with an outer diameter of 38.1 mm and an inner diameter of 12.7 mm. Each of the elements is designed to generate a spherical wave front, with a radius of 150 mm, that propagates inward to the center corresponding to the focal point. The detailed design of the transducer is reported by Maxwell [14]. Fig. 6b shows the modeled source surfaces. Unlike the single-element transducer considered in section 4.3, the source geometry of the multi-array transducer is not fully axi-symmetric. Therefore we use an x-y-z Cartesian coordinate system in this case of simulation. To model the element, we distribute the one-way spherical source on a ring-shaped portion of a spherical surface with a radius of 150 mm with its center located at the origin. Correspondingly, using a smeared delta function, the strength of the source is regularized onto three-dimensional grid cells neighboring the surface.
Figure 6.
Multiarray transducer with 18 elements considered in the present study. (a) Real transducer. The ring-shaped piezo-ceramic elements are covered by acoustic lenses. (b) Modeled source distribution used in the simulation. The length unit used in the figure is mm. Each element is modeled as a ring-shaped source plane aligned on a spherical section with a radius of 150 mm.
The expressions used for the source terms are
| (57) |
where, with angular frequency ω = 2πfs,
| (58) |
| (59) |
| (60) |
| (61) |
1ξ and η are defined as the polar and azimuthal angle that parametrize the spherical section; ξ, η ∈ ℝ : ξ ∈ [0, π], η ∈ [− π, π], and X(ξ, η) = [r0cosξcosη, r0cosξsinη, r0sinξ]. χ is an indicator function that takes a value of 1 when Lagrangian point X(ξ, η) is within the region of the defined ring-shaped transducer surfaces, and 0 elsewhere. Gg and C follow equations (55) and (56), respectively.
To validate the source model, we simulate a focused acoustic field in a linear regime with 20 cycles of a sinusoidal form of pressure waves with a frequency of 340 kHz and a source amplitude of 10 Pa. The spacial configuration of the source and the resulting acoustic field are symmetric along the x–y and x–z planes that intersect the x-axis. To reduce the computational cost, we simulate a domain of x ∈ [−160, 60], y ∈ [0, 100] and z ∈ [0, 100] mm, with symmetry boundary conditions applied along the x–y and x–z planes. Non-reflecting boundary conditions are applied on the other domain boundaries. The simulation is evolved with a constant time-step, Δt = 36.7 ns. 1320×600×600 uniform computational grids are used.
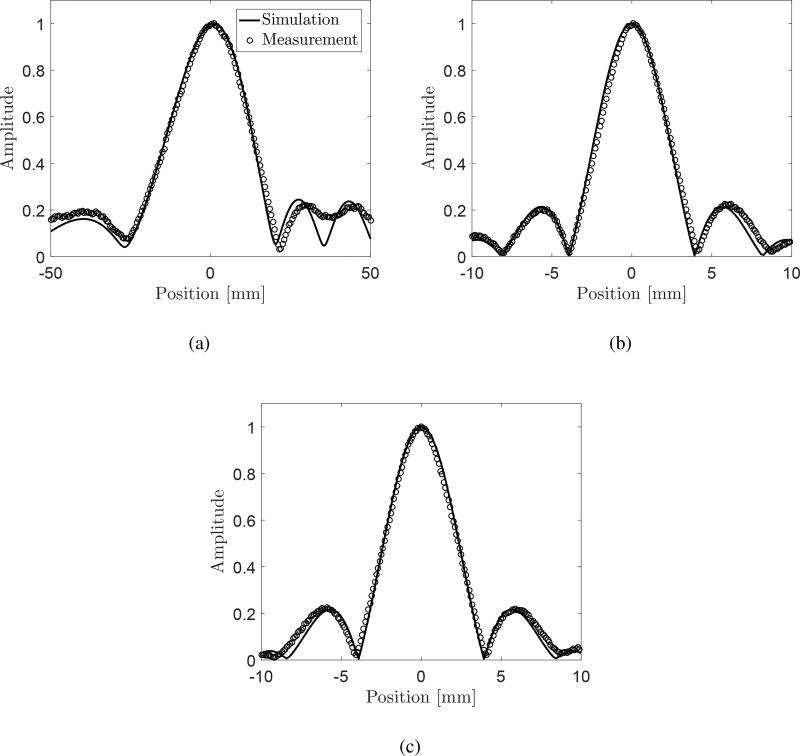
Fig. 7 shows the scans of the pressure field around the focal point along the coordinate axes obtained from the simulation and a corresponding experimental measurement using a capsule hydrophone reported by Maxwell [14]. The present simulation agrees well with the measurement along all the axes, except for the region around x = 30–40 mm on the x-axis. The discrepancy on the x-axis could be reduced by improving the accuracy of measurements and/or using more accurate geometric parameters of the source in simulations (e.g. the size of the piezo-ceramics plates). We note that the linear gain of the transducer obtained from the present simulation was Ga = 27.
Figure 7.
The scans of the pressure field around the focal point generated by the multi-array transducer along the (a) x-axis, (b) y-axis, and (c) z-axis, respectively. Results obtained in the present simulation and the hydrophone measurement are compared.
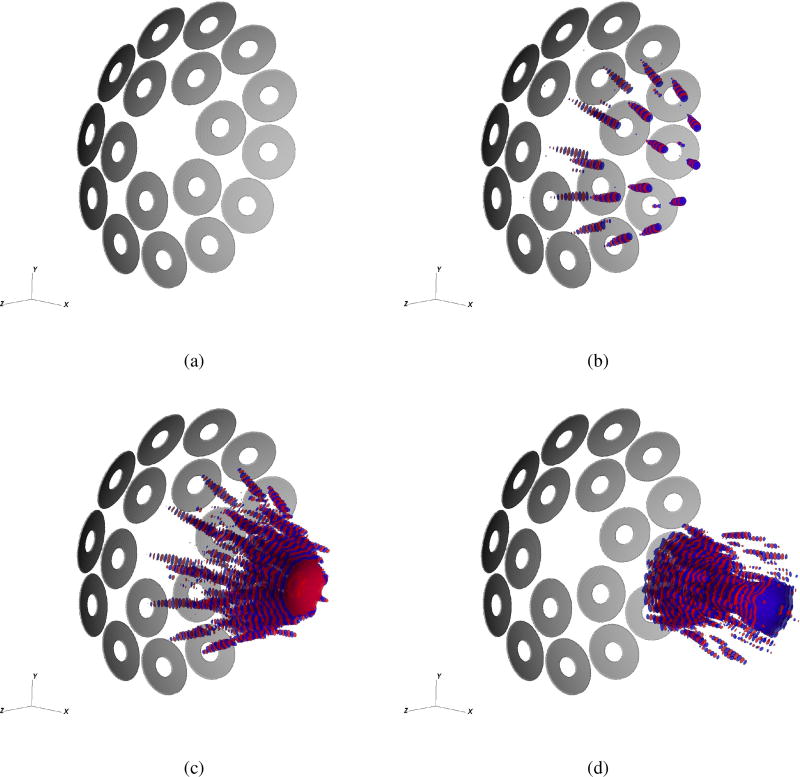
Fig. 8 shows the pressure iso-contours of the simulated acoustic fields with the contour level of −200 Pa (blue color) and 200 Pa (red color), respectively. The train of waves generated at each element overlaps with each other as they propagate, then converges toward the focal point. As shown in Fig. 8d, at t = 120 µs, the leading part of the train of waves diverge after passing the focal point.
Figure 8.
Pressure iso-contours of the simulated acoustic fields with the contour levels of −200 Pa (blue color) and 200 Pa (red color) at (a)0, (b)40, (c)80 and (d)120 µs.
5. Conclusion
In this paper, we have constructed simple, general models of source terms for the Euler/Navier-Stokes equations that generate unidirectional radiation from one face of an arbitrary, smooth surface. The models are built on a singular distribution of simple monopole and dipole sources that are regularized on the computational grid. The models were verified by simulation of one-way Gaussian wave in air and spherical waves in water, solved using a numerical method consisted of a finite-volume WENO scheme. We applied the scheme to simulate focused ultrasound fields generated by a HIFU transducer on 2D axi-symmetric grids and a multi-array transducer on 3D grids. For the HIFU transducer, the obtained ultrasound fields on the central axis and focal axis in a linear regime as well as the focal pressure evolutions in a non-linear regime agreed well with those of experimental measurements reported by Canney et al [13]. For the multi-array transducer, simulated focal scans of the ultrasound fields in a linear regime agree well with experimental measurements reported by Maxwell [14]. The source models for a plane, cylindrical and spherical one-way waves presented can be used as building blocks to construct a source distributed on a surface with arbitrary geometries and strength. In addition to acoustic waves in a pure fluid, the one-way source models can be also adapted to various hyperbolic systems. The fields of applications can include medical acoustics, aeroacoustics, seismology, astrophysics, and elastic solid mechanics.
Research highlights.
A source term that generates unidirectional acoustic waves is derived for the Euler and Navier-Stokes equations.
The acoustic source is defined on an arbitrary, smooth surface in three-dimensional space.
The source model is numerically implemented in the Euler equation.
Ultrasound fields generated by piezo-ceramic transducers are simulated
Simulations are validated with experimental measurements.
Acknowledgments
The authors thank Dr. Adam Maxwell for providing the experimental data of the hydrophone measurements of the multi-array transducer, and for his generous assistance to obtain the focal scans from the data. The authors also thank Dr. Wayne Kreider, Dr. Michael Bailey and Dr. Mark Hamilton for helpful discussions and comments on the manuscript. K.M would like to acknowledge thanks to Funai Foundation for Information Technology, for the Overseas Scholarship. This work was supported by the National Institutes of Health under grant 2P01-DK043881. The three-dimensional computations presented here utilized the Extreme Science and Engineering Discovery Environment, which is supported by the National Science Foundation grant number CTS120005.
Appendix
One-way cylindrical wave solution
It is widely known that cylindrical wave equation does not have a closed form of solution. Model of one-way cylindrical source in a simple form is therefore not available, unlike the planer or spherical one-way source. Instead, we can obtain an approximate solution in a closed form by solving the following inhomogeneous wave equation in terms of , in analogous to equation (31):
| (62) |
This approximation is valid for a cylindrical wave with a characteristic wave length much smalelr than the radius of the cylindrical source plane[25]. The solution of equation (62) is readily available using the Green’s function:
| (63) |
| (64) |
| (65) |
It is straight forward that defining
| (66) |
makes the following one-way wave solution:
| (67) |
Footnotes
Publisher's Disclaimer: This is a PDF file of an unedited manuscript that has been accepted for publication. As a service to our customers we are providing this early version of the manuscript. The manuscript will undergo copyediting, typesetting, and review of the resulting proof before it is published in its final citable form. Please note that during the production process errors may be discovered which could affect the content, and all legal disclaimers that apply to the journal pertain.
Note that we set ξ = [ξ, η]T in equation (46). For regularization of the singular sources, we use the second-order, three-dimensional Gaussian function: .
Citations
- 1.Tanguay Michel, Colonius Tim. ASME 2002 Joint US-European Fluids Engineering Division Conference. American Society of Mechanical Engineers; 2002. Numerical investigation of bubble cloud dynamics in shock wave lithotripsy; pp. 389–394. [Google Scholar]
- 2.Colonius Tim, Lele Sanjiva K. Computational aeroacoustics: progress on non-linear problems of sound generation. Progress in Aerospace sciences. 2004;40(6):345–416. [Google Scholar]
- 3.Etter Paul C. Underwater acoustic modeling and simulation. CRC Press; 2013. [Google Scholar]
- 4.Ginter Siegfried, Liebler Marko, Steiger Eckard, Dreyer Thomas, Riedlinger Rainer E. Full-wave modeling of therapeutic ultrasound: Nonlinear ultrasound propagation in ideal fluids. The Journal of the Acoustical Society of America. 2002;111(5):2049–2059. doi: 10.1121/1.1468876. [DOI] [PubMed] [Google Scholar]
- 5.Krimmel Jeff, Colonius Tim, Tanguay Michel. Simulation of the effects of cavitation and anatomy in the shock path of model lithotripters. Urological Research. 2010;38(6):505–518. doi: 10.1007/s00240-010-0332-z. [DOI] [PMC free article] [PubMed] [Google Scholar]
- 6.Okita Kohei, Ono Kenji, Takagi Shu, Matsumoto Yoichiro. Development of high intensity focused ultrasound simulator for large-scale computing. International Journal for Numerical Methods in Fluids. 2011;65(1–3):43–66. [Google Scholar]
- 7.Colonius Tim. Modeling artificial boundary conditions for compressible flow. Annual Review of Fluid Mechanics. 2004;36:315–345. [Google Scholar]
- 8.Lee Ding, Pierce Allan D, Shang Er-Chang. Parabolic equation development in the twentieth century. Journal of Computational Acoustics. 2000;8(04):527–637. [Google Scholar]
- 9.Towne Aaron, Colonius Tim. One-way spatial integration of hyperbolic equations. Journal of Computational Physics. 2015;300:844–861. [Google Scholar]
- 10.Ffowcs Williams JE. Review lecture: Anti-sound. Proceedings of the Royal Society of London A: Mathematical, Physical and Engineering Sciences. 1984;395(1808):63–88. [Google Scholar]
- 11.Nelson Philip A, Elliott Stephen J. Active control of sound. Academic press; 1991. [Google Scholar]
- 12.Kuo Sen M, Morgan Dennis. Active noise control systems: algorithms and DSP implementations. John Wiley Sons, Inc; 1995. [Google Scholar]
- 13.Canney Michael S, Bailey Michael R, Crum Lawrence A, Khokhlova Vera A, Sapozhnikov Oleg A. Acoustic characterization of high intensity focused ultrasound fields: A combined measurement and modeling approach. The Journal of the Acoustical Society of America. 2008;124(4):2406–2420. doi: 10.1121/1.2967836. [DOI] [PMC free article] [PubMed] [Google Scholar]
- 14.Maxell Adam D. Private communication. 2016 [Google Scholar]
- 15.Sapozhnikov Oleg A. An exact solution to the helmholtz equation for a quasigaussian beam in the form of a superposition of two sources and sinks with complex coordinates. Acoustical Physics. 2012;58(1):41–47. [Google Scholar]
- 16.Titarev VA, Toro EF. Finite-volume weno schemes for three-dimensional conservation laws. Journal of Computational Physics. 2004;201(1):238–260. [Google Scholar]
- 17.Coralic Vedran, Colonius Tim. Finite-volume weno scheme for viscous compressible multicomponent flows. Journal of Computational Physics. 2014;274:95–121. doi: 10.1016/j.jcp.2014.06.003. [DOI] [PMC free article] [PubMed] [Google Scholar]
- 18.Toro Eleuterio F. Riemann solvers and numerical methods for fluid dynamics: a practical introduction. Springer Science & Business Media; 2013. [Google Scholar]
- 19.Thompson Kevin W. Time dependent boundary conditions for hyperbolic systems. Journal of computational physics. 1987;68(1):1–24. [Google Scholar]
- 20.Meng Jomela C. PhD thesis. California Institute of Technology; 2016. Numerical Simulations of Droplet Aerobreakup. [Google Scholar]
- 21.Peskin Charles S. The immersed boundary method. Acta numerica. 2002;11:479–517. [Google Scholar]
- 22.Gottlieb Sigal, Shu Chi-Wang. Total variation diminishing runge-kutta schemes. Mathematics of computation of the American Mathematical Society. 1998;67(221):73–85. [Google Scholar]
- 23.Tornberg Anna-Karin, Engquist Bjrn. Regularization techniques for numerical approximation of pdes with singularities. Journal of Scientific Computing. 2003;19(1):527–552. [Google Scholar]
- 24.O’Neil HT. Theory of focusing radiators. The Journal of the Acoustical Society of America. 1949;21(5):516–526. [Google Scholar]
- 25.Whitham Gerald Beresford. Linear and nonlinear waves. Vol. 42. John Wiley Sons; 2011. [Google Scholar]


