

Abstract
Objective
Evidence suggests discrimination increases the risk of obesity. The biopsychosocial model of racism posits that psychological factors such as depressive symptoms may link experiences of perceived interpersonal discrimination to obesity. This study tested whether self-reported experiences of everyday discrimination were associated with adiposity indicators and if depressive symptoms explained these associations.
Methods
Cross-sectional survey data of 602 Latino adults living in Lawrence, MA from the Latino Health and Well-being Project (2011–2013) was used. Participants completed questionnaires assessing perceived everyday discrimination and depressive symptoms. Anthropometric measures (i.e., body mass index [BMI] and waist circumference [WC]) were obtained by trained staff. Structural equation modeling was employed to test for direct and indirect effects of perceived everyday discrimination on adiposity.
Results
Perceived everyday discrimination was directly and positively associated with higher BMI and WC, independent of sociodemographic factors, physical activity, and stressful life events. Perceived everyday discrimination was not indirectly associated with BMI and WC through depressive symptoms. However, perceived everyday discrimination was associated with higher levels of depressive symptoms.
Conclusion
Self-reported everyday discrimination among Latino adults is associated with adiposity. Day-to-day interpersonal discrimination may be implicated in obesity disparities for Latino adults.
Keywords: Hispanics, weight, body fat distribution, waist circumference, obesity
Introduction
In the landmark Hispanic Community Health Study/Study of Latinos (HCHS/SOL) the prevalence of obesity among Latinos was 43% among women and 37% among men (1). Latinos also have higher rates of obesity-related illnesses (e.g., diabetes and heart disease) than other racial/ethnic groups (1). The burden of obesity among Latinos is a critical public health issue with a wide-range of long-term implications including increased risk of impairment (2), poorer quality of life (2), and early mortality (3). If the obesity epidemic among Latinos is not reversed, it is expected that the social, economic, and health impact will be profound for individuals as well as their families, communities, and the nation.
A constellation of factors contributes to racial/ethnic disparities in obesity. One potential reason for these obesity disparities is the disproportionate exposure to stress among racial/ethnic minorities. For example, the 2017 American Psychological Association’s survey, Stress in America, showed a racial stress divide, with Latinos reporting the highest levels of stress compared to other racial/ethnic groups (4). As racialized persons, the injury of racism in its many manifestations is also a potential source of stress among Latinos (5). For instance, data from the HCHS/SOL Sociocultural Ancillary Study indicated that nearly 80% of Latinos reported perceived lifetime racial/ethnic discrimination (5).
Evidence, albeit limited, finds that self-reported experiences of interpersonal discrimination may be implicated in obesity disparities. Previous studies have found positive, cross-sectional associations between different forms of self-reported discrimination and waist circumference (WC) (6, 7), visceral fat (8), and body mass index (BMI) (7) in non-Latino populations. Longitudinal studies have also shown that different measures of perceived discrimination are prospectively associated with increased weight and WC (9) (10). Out of all these studies, the only study (7) that included Latinos in the sample found that self-reported discrimination was not associated with WC or BMI.
Depressive symptoms may help to explain the relation between self-reported experiences of discrimination and indicators of adiposity. Meta-analytic studies of cross-sectional (11) and longitudinal (12) studies have found an association between depression and obesity in the general population. Focusing on depressive symptoms as a potential mechanism is particularly relevant for Latinos because they report higher rates of depressive symptoms compared to non-Latino whites (13). Further, prior research finds that Latinos with obesity are more prone to depressive mood than their counterparts without obesity (14).
Against this backdrop, a focus on the association between perceived discrimination and adiposity is informed by the biopsychosocial model of racism (15), which postulates that discrimination is a chronic stressor that may impart its pernicious effects on the body via a number of pathways (15). From this theoretical perspective, cumulative exposure to everyday interpersonal discrimination (e.g., being treated rudely, thought of less smart compared to others, and being ignored) is posited to trigger physiological stress responses that increase risk for depressive symptoms through immune inflammatory processes (e.g., increased C-reactive protein) (16) and dysregulated functioning of the hypothalamic-pituitary-adrenal (HPA) axis (e.g., elevated stress hormone secretion such as cortisol) (17), which can increase risk for obesity over time (18). One study (19) examined the indirect effect of discrimination on BMI via mental health on Brazilian adults with null findings. Still, previous research studies (though not focused specifically on obesity) have found that increased symptoms of negative affect (20) help explain the association between self-reported discrimination and subjective health status among Latinos. These findings are also consistent with other studies demonstrating that depressive symptoms mediate the association between discrimination and overall health among African Americans (21). Thus, the available evidence suggests that stress responses posited to result from experiences of discrimination might help explain excess weight and visceral body fat accumulation among Latinos.
Present Study
The present study addresses several knowledge and empirical gaps by examining in a predominantly Caribbean immigrant sample of Latinos (i.e., Dominican and Puerto Rican), a group that evidences some of the highest obesity rates (1), the direct associations of everyday discrimination with two objectively measured indicators of adiposity (i.e., BMI and WC) and whether these associations are explained by depressive symptoms. It is hypothesized that perceived everyday discrimination will be positively associated with BMI and WC. We also hypothesize that perceived everyday discrimination will be indirectly associated with both measures of adiposity via increased levels of depressive symptoms, controlling for sociodemographic factors, physical activity, and other stressful life events.
Methods
Participants and Procedures
This study was based on secondary analysis of cross-sectional baseline data (N = 602) from the Latino Health and Well-being Project cohort (see (22); (23)). Participants from the larger study were recruited from the Lawrence Family Health Center in Lawrence, MA, a federally-qualified community health center serving about 85% of Latino population living in the Lawrence area. Proportional sampling within specified age (i.e., 21-34, 35-54, and 55-85) and gender strata from electronic patient records was used to randomly selected potential research participants who met inclusion criteria. Inclusion criteria was defined as self-identifying as Latino/Hispanic, Spanish or English speaking, ages 21 to 85 years, no plans to move from the area within one year, and able to verbally answer administered survey questions. A total of 2,783 potentially eligible individuals were identified of which 1,236 (44.4%) could be contacted by study staff. Of these 1,236, a total of 634 refused to participate in the study, which resulted in the 602 participants that could be contacted, were eligible, and were interested in participating. The 602 participants of this study represented 21.6% of the 2,783 original list of participants. Eligible and interested individuals were invited to participate in the study, scheduled for a study visit, and informed consent was obtained.
Baseline assessments in the main study were conducted between September 2011 and May 2013. Questionnaires were verbally administered in English or Spanish by trained bilingual/bicultural research assistants. Anthropometric measures were obtained by trained staff. Examination procedures lasted between 2.5 to 3.5 hours and occurred at a centralized community location. Participants received $50 as compensation. The University of Massachusetts Medical School Institutional Review Board (IRB) approved the main study (#H-14144). Secondary data analysis of the main study was IRB exempt (#2014-0842) by the University of Illinois at Chicago.
Measures
Everyday Discrimination
Perceived everyday discrimination was measured using the 9 item Everyday Discrimination Scale (EDS) (24) which measures frequency of routine experiences of unfair treatment. Sample items include “You are treated with less respect than other people” and “You receive poorer service than other people at restaurants or stores.” Response options range from 1 = almost every day to 6 = never. Items were reverse-coded with higher values representing greater frequency of discrimination. Perceived everyday discrimination as measured by the EDS was treated as a latent variable in our analyses. Confirmatory factor analysis (CFA) was used to confirm the dimensionality of the EDS. Following recommendations of a EDS psychometric study (25), the first item (i.e., “You are treated with less courtesy than other people”) was dropped because it was highly correlated with the second item (i.e., “You are treated with less respect than other people”). The CFA revealed a single-factor solution (see Results section) and this was consistent with the original formulation of the EDS and previous studies confirming the EDS construct validity in a nationally representative sample of Latinos (26). The internal consistency of the EDS measure in our sample was high (α = .85).
Depressive Symptoms
Depressive symptoms were measured using the 10-item short form of the CES-D scale (27) which asks how often symptoms are experienced during the previous week. Sample items include “I felt depressed” and “I felt that everything I did was an effort.” Response options range from 1 = rarely or none of the time [less than 1 day] to 4 = all of the time [5–7 days]). Two positively stated items (i.e., “I felt hopeful about the future” and “I was happy”) were reverse-coded with higher and higher total values indicating higher depression symptoms. Depression symptoms was treated as a latent variable in our analyses. The CFA results supported the unidimensionality of depressive symptoms (see Results section) which was consistent with other studies employing community samples of Latinos (28). The internal consistency of the CESD-10 measure in our sample was high (α = .88).
Anthropometric Measures
Participants wore light clothes and no shoes. BMI, a measure of general body fatness, was objectively measured using height and weight and the weight (lbs)/height(in)2 × 703 formula. WC, a measure of central obesity, was measured to the nearest 1/8th inch two times below the naval under clothing. The average of the two WC measures was used. BMI and gender-specific WC were each treated as observed continuous variables in analyses.
Covariates
Statistical models adjusted for the following covariates known or suspected to confound the discrimination and BMI/WC relationships. Sociodemographic variables included: age (in years), gender, birthplace (US-born vs. immigrant), employment status (employed vs. not employed), and perceived income measured with one question asking about level of difficulty in paying monthly bills which was then categorized into (0 = just enough) and (1 = not enough). Walking and leisure-time physical activity were measured using the Women’s Health Initiative Brief Physical Activity Questionnaire (29), a 9-item measure that assesses walking and light, moderate and vigorous physical activity during the past 7 days. The survey used a frequency by duration format and was used to calculate minutes of physical activity per week. For purposes of parsimony, participant responses were categorized into binary responses (0 = does not meet minimum U.S. guidelines [i.e., 0–150 minutes per week of weekly physical activity]; 1 = meets the guidelines [i.e., >150 minutes per week]). Stressful life events was measured using a Life Events Scale, a 30-item index assessing stressful life events (e.g., “Did you or someone close to you lose a job or experienced a layoff from work?” and “Have you or has someone close to you been arrested by the police, had problems with the law or immigration, or been in jail?”) in the past 12 months that was developed for the larger study. Responses to items were on a 0 = no or 1 = yes format. The sum of all affirmative responses was used. We excluded the item asking about experiences of racial discrimination or prejudice to avoid potential issues of multicollinearity with the perceived everyday discrimination measure; there was moderate correlation between the two measures (r = .40, p < .001).
Analytic Strategy
Main analyses of secondary data consisted of robust maximum-likelihood (MLR) estimation methods to obtain a structural equation model (SEM) solution for continuous outcomes using Mplus software. The advantage of SEM is that it corrects for random measurement error and can estimate both direct and indirect effects simultaneously for various outcomes while accounting for covariates (30). Moreover, using a single model avoids “multiple testing” concerns inherent in conducting separate multiple regression models for each outcome.
A two-stage approach to modelling was used (31). First, a measurement model was separately estimated for each latent variable (i.e., perceived everyday discrimination and depressive symptoms) to ensure that the psychometric properties were adequate for our sample and that the observed variables (i.e., indicators) loaded on the hypothesized factors. Second, a structural model was estimated and the overall fit of the empirical model was evaluated. Because the chi-square statistic is affected by sample size (with larger samples of 400 or more participants almost always resulting statistically significant) we used other model fit indices that are less sensitive to sample size. Specifically, excellent model fit was characterized as comparative fit index (CFI) ≥ .95, Tucker Lewis Index (TLI) ≥ .95; root-mean-square residual (RMSEA) ≤ .08, and standardized root-mean-square residual (SRMR) ≤ .06. Adequate fit was characterized as CFI ≥ .90, TLI ≥ .90, RMSEA ≤ .10, and SRMR ≤ .08 (30). The 90% confidence interval (CI) for the RMSEA provides additional information about the precision of this index. A model that meets most (though not necessarily all) of the fit criteria should not be rejected (30). Lastly, Mplus uses the Sobel test to calculate indirect effects and employs the Delta method to calculate standard errors of the indirect effects. Simulation studies suggest parameter estimates and standard errors using MLR would be identical to those obtained with the bootstrapping procedure taking into account assumptions of a normal distribution for the indirect effect (32). Missing data was handled in Mplus via the full-information maximum likelihood by using all the data available simultaneously to calculate estimates.
Results
Descriptive Statistics
Table 1 shows descriptive statistics for all variables used in our analyses for the overall sample. Bivariate correlations (not shown in tables) between our main variables indicated that everyday discrimination was significantly correlated with depressive symptoms (r = .38, p< .001) and WC (r = .08, p< .05), and marginally correlated with BMI (r = .08, p = .06). Depressive symptoms were significantly associated with BMI (r = .11, p < .01) but uncorrelated with WC (r = .06, p = .17). BMI and WC were positively correlated (r = .85, p < .001). Partial correlations were also conducted for associations involving WC to account for gender differences and be consistent with all gender-adjusted analyses of WC. These results showed that accounting for gender, perceived everyday discrimination was no longer associated with WC (r = .07, p = .11) and depressive symptoms were significantly correlated with WC (r = .09, p < .05).
Table 1.
Descriptive Statistics of Main Study Variables for Total Sample
| M or % | SE or (SD) | Range of scores | |
|---|---|---|---|
| Sociodemographic | |||
| Characteristics | |||
| Age, years | 46.6 | (15.5) | 21- 83 |
| Gender | |||
| Male | 48.8% | 0.02 | |
| Female | 51.2% | 0.02 | |
| Birthplacea | |||
| U.S.-born | 7.8% | 0.01 | |
| Immigrant | 92.2% | 0.01 | |
| Employment Status | |||
| Employed | 50.7% | 0.02 | |
| Unemployed/Other | 49.3% | 0.02 | |
| Perceived Income | |||
| More than/just enough | 48.5% | 0.02 | |
| Not enough | 51.5% | 0.02 | |
| Physical Activity | |||
| Does not meet guidelines | 58.3% | 0.02 | |
| Meets guidelines | 41.7% | 0.02 | |
| Stressful Life Events (count) | 2.4 | (2.4) | 0 - 13 |
| Exposure Variable | |||
| Everyday Discrimination | 14.9 | (7.2) | 0 - 46 |
| Intervening Variable | |||
| Depressive Symptomatology | 16.3 | (13.7) | 0 - 30 |
| Outcome Variables | |||
| Body Mass Index | 29.8 | (6.0) | 18.7 - 65.9 |
| Waist Circumference (inches)b | 35.6 | (1.14) | 34.48 – 36.77 |
Note. SD= Standard deviation; SE= Standard error.
Following similar categorization of immigrants in other studies of Latinos, the immigrant group includes persons who reported being born outside of the U.S., including Puerto Ricans born in the island.
Gender-adjusted means and ranges.
Structural Equation Modeling
First, the measurement models for the perceived everyday discrimination latent variables produced adequate fit indices (χ2(20) = 56.62, p <.001; CFI = .95; TLI =.93; RMSEA = .055, 90% CI = .039, .007; SRMR = .042) and depressive symptoms (χ2(35) = 84.77, p <.001; CFI = .97; TLI =.96; RMSEA = .049 (90% CI = .035, .062); SRMR = .03). The observed variables were good indicators of each latent variable and the construct validity was confirmed among our sample of Latinos. Factor loadings from the CFA for the perceived everyday discrimination latent variable ranged from .43 to .83. Factor loadings for the CFA for depressive symptoms latent variable ranged from .51 to .85.
Second, the structural model was estimated (see Figure 1). We correlated the error terms of the outcome variables (BMI and WC) because the variables were highly correlated (r = .85). The hypothesized structural model revealed that the model fit the data adequately in our sample (χ2(290) = 564.76, p <.001; CFI = .94; TLI =.93; RMSEA = .04, 90% CI= .035, .045; SRMR= .05). As shown in Figure 1, standardized path coefficients showed that everyday discrimination was directly associated with increased depressive symptoms (β=.25, p <.001), higher BMI (β = .10, p <.05), and larger WC (β = .11, p <.05), after accounting for stressful life events, physical activity, and sociodemographic factors. Depressive symptoms were not associated with BMI or WC. Perceived everyday discrimination was not indirectly associated with BMI or WC via depressive symptoms (see Table 2).
Figure 1. Structural Equation Model Solution with Standardized Measurement Weights and Structural Parameters.
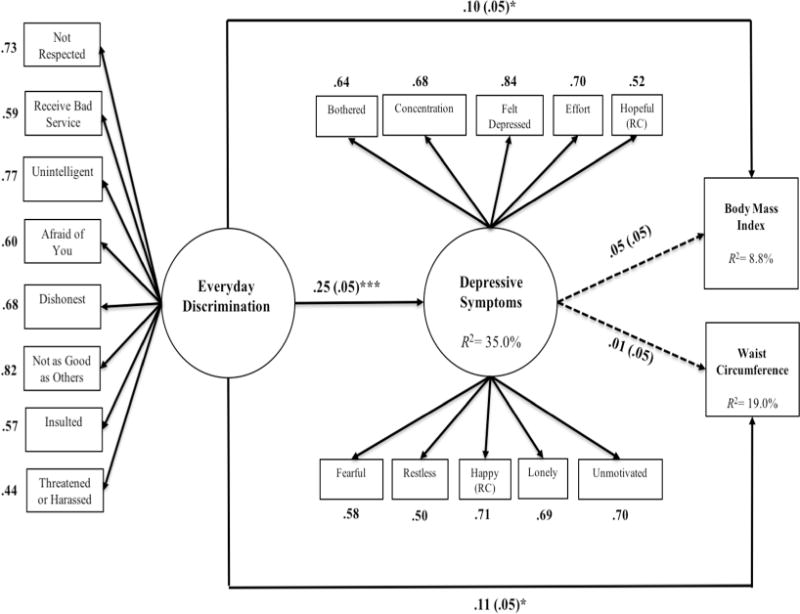
Note. RC= Reverse Coded. Dashed lines represent non-significant structural paths. Values in parentheses represent standard errors. Covariance between errors for body mass index and waist circumference not represented in model (β= .89, p< .001). The model was adjusted for age, gender, birthplace, employment status, perceived income, physical activity, and stressful life events. *p < .05; ***p < .001
Table 2.
Standardized Specific Indirect Effects for Everyday Discrimination to Body Mass Index and Waist Circumference
| Estimate | S.E. | p-value | 95% C.I. | |
|---|---|---|---|---|
| Total effect from ED to BMI | .109 | .05 | .022 | [.02, .20] |
| Total effect from ED to WC | .115 | .05 | .021 | [.02, .21] |
| Specific Indirect Effects | ||||
| ED➔CESD➔BMI | .013 | .01 | .307 | [−.01, .04] |
| ED➔CESD➔WC | .003 | .01 | .794 | [−.02, .03] |
Note. CI= Confidence Interval; S.E.= Standard Error; ED=Everyday Discrimination; CESD= Center for Epidemiologic Studies Depression Scale; BMI=Body Mass Index; WC= Waist Circumference
Discussion
The goals of the current study were to examine the direct and indirect associations between self-reported everyday discrimination and two indicators of adiposity (i.e., BMI and WC) among a large community sample of predominantly immigrant Caribbean Latino adults from a community health center in Lawrence, MA. The results of this study provide support for components of the biopsychosocial model of racism (15).
In support of the first hypothesis, we found that perceived everyday discrimination was associated with higher levels of BMI and WC. Our findings corroborate prior research that finds an association between self-reported experiences of interpersonal discrimination and visceral abdominal fat (8), WC (6), BMI (14), and increases in WC (9, 10) in primarily African American and White populations. Our findings are at odds with the one study (7) that included Latinos and which did not find support for an association between perceived discrimination and either of the two measures of adiposity. This may reflect methodological differences because the former study was comprised of Latinos from the Chicago Community Adult Health Study (2001–2003). Nonetheless, our findings are consistent with several previous studies (10, 33, 34). Our findings are also compelling given that a prior study showed that discrimination was associated with larger WC among participants who consistently reported high levels of interpersonal day-to-day discrimination compared to those who consistently reported low levels (35). We found significant associations in our study despite low levels of self-reported discrimination among the current sample, which may bias our results towards the null hypothesis.
The second hypothesis that perceived everyday discrimination would be indirectly associated with adiposity indicators via increased depressive symptoms was not supported. While there was a positive association between perceived everyday discrimination and depressive symptoms, a consistent finding across the literature, we did not find that depressive symptoms were associated with either BMI or WC. As found in one prior study (19), negative affect functioned as a mediator only for the association between perceived discrimination and self-rated health but not when BMI was the outcome. One explanation for our null findings could be related to methodological differences between our study and previous ones that find an association between depression and obesity. For example, although we initially found significant bivariate associations among depressive symptoms, BMI and WC, the correction for measurement error in the latent analysis leads to a disattenuation of such association at the latent level (30). Further, other studies (36) have been conducted with Mexican Americans and not Caribbean Latinos. Other studies have differentiated between visceral versus subcutaneous fat, finding that depressive symptoms were only associated with visceral fat (37). Another study (34) was prospective in their design, finding that depressive symptoms in youth are associated with obesity in adulthood.
Methodological issues notwithstanding, one potential explanation for the non-significant indirect effect could be that the depression-obesity link is not a direct one. For instance, previous studies have found that individuals who are depressed are more likely to engage in emotional eating, which mediates the effects of depressive symptoms on adiposity indicators (38, 39). Similarly, African American women who reported higher levels of perceived discrimination were more likely to eat when depressed or sad and to eat to manage their stress levels. Indeed, biobehavioral models for understanding the role of stress on obesity among Latino immigrants (40) suggest that exposure to acculturative processes including experiences with discrimination and social marginalization may result in maladaptive behavioral responses (e.g., increased food consumption, poor dietary intake) that help alleviate stress in the short-term but increase obesity risk. This theorizing is consistent with previous studies that find experiences of discrimination and social rejection are associated with depleted self-regulation such as emotional eating (41) and increased consumption of snacks high in fat and sugar (42). Thus, we may not have found an indirect association because we did not include these intervening variables between depressive symptoms and indicators of adiposity.
Limitations and Future Directions
Several key limitations of our study warrant attention. Chiefly, the cross-sectional study design limits the ability to infer causation and define the temporal ordering of the variables in our model. For example, persons with higher BMI levels or larger WC may be more likely to experience discrimination and feel depressed (43). Likewise, other studies find that abdominal obesity is associated with moderate-to-severe depressive symptoms (44) and the association between depression and obesity can be bidirectional as well as mutually reinforcing (18). Although our model was theoretically and empirically driven, further research is needed to clarify the complex relations between variables in our tested model.
Second, despite the strengths of employing an analytic approach that accounted for measurement error, participants in our study reported low levels of everyday discrimination. Although this is consistent with other studies of Latinos (26) and might reflect social desirability bias, low levels of self-reported discrimination in our study may also reflect neighborhood effects. That is, participants resided primarily in an ethnic enclave where they may be less likely to experience everyday forms of discrimination (e.g., disrespect) than structural forms (e.g., lack of or restricted job opportunities, concentrated disadvantage). Similarly, prior studies find that persons with obesity (BMI ≥35 kg/m2) are more likely to report both institutional (e.g., not given a promotion or prevented from remaining in a neighborhood because neighbors made life uncomfortable) and everyday discrimination when compared to persons with healthy weight (43). A prior study found that among immigrants, those living in a predominantly Mexican enclave were less likely to report experiences of discrimination compared to those residing in predominantly white neighborhoods (45). Whenever possible, future studies should account for different forms of discrimination that Latinos living in ethnic enclaves might face.
Lastly, we focused only on one mechanistic (psychological) factor posited to be part of the link between social stress and obesity. Future research should aim to include other psychological and behavioral factors (e.g., emotional eating, sleep) closely implicated in depression and obesity and that might help to explain the relation between self-reported discrimination and indicators of adiposity in Latinos.
Conclusion
Despite these limitations, our study had various strengths including objectively measuring BMI and WC, use of SEM to account for measurement error and missing data, and inclusion of other stressful events as covariates. Further, although recent research has focused on variation in obesity and obesity-related risks among Latinos (1), another strength of our paper was a focus on an understudied Latino group (i.e., Caribbean Latinos) who represents a group at high risk of obesity and related cardiometabolic issues. Focusing on this specific group has implications for more targeted interventions aimed at curbing the deleterious effects of perceived discrimination, especially for a segment of the population that reports higher levels of perceived exposure to discrimination relative to other Latino ethnic groups (5). Our findings also make an important contribution to the literature by helping us to better understand the role of perceived everyday discrimination on multiple objectively measured components of adiposity among Latinos, the first study to our knowledge. In light of the current sociopolitical context, our findings could be used as a baseline for future analyses investigating the pathways by which experiences of interpersonal day-to-day forms of discrimination are implicated in obesity disparities among a group that is disproportionately impacted by racism (5). In sum, our findings point toward the need to develop interventions focused on coping effectively with the uncontrollable and chronic nature of perceived everyday discrimination in order to intervene on obesity disparities among Latinos.
Study Importance Questions.
What is already known about this subject? What does your study add?
Cross-sectional associations of perceived discrimination with WC or BMI were not found among Latinos in the only previous study.
The biopsychosocial model of racism and available research suggests that depressive symptoms may mediate the associations of perceived discrimination with WC and BMI.
This is the first study to demonstrate that perceived everyday discrimination is positively associated with WC and BMI among Latinos
Depressive symptoms do not appear to mediate the association between everyday discrimination and adiposity indicators among Latinos.
Acknowledgments
The authors thank the study participants and staff for their time and efforts. Portions of this research were presented at the 2016 Annual Meeting of the NIH/National Heart, Lung and Blood Institute Programs to Increase Diversity Among Individuals Engaged in Health-Related Research (PRIDE); the research in this manuscript won first place in the PRIDE Conference poster session.
Funding: Kristine M. Molina was partially supported by the K12 Building Interdisciplinary Research Careers in Women’s Health (BIRCWH) Career Development Award (Eunice Shriver Kennedy National Institute of Child Health and Human Development Grant # K12HD055892) and UIC’s Office of Social Science Research Faculty Seed Grant. Mayra Estrella was supported by the National Heart, Lung, and Blood Institute (NHLBI) T32-HL125294. Noemi Rivera-Olmedo was partially supported by UCLA’s Fielding School of Public Health Dean’s Leadership Grant.
Footnotes
The authors declared no conflict of interests.
Contributor Information
Kristine M. Molina, Department of Psychology, Community and Prevention Research Program, University of Illinois at Chicago
Mayra L. Estrella, Institute for Minority Health Research, University of Illinois at Chicago.
Noemi Rivera-Olmedo, UCLA Fielding School of Public Health
Christine Frisard, Division of Preventive and Behavioral Medicine, Department of Medicine, University of Massachusetts Medical School
Stephanie Lemon, Division of Preventive and Behavioral Medicine, Department of Medicine, University of Massachusetts Medical School
Milagros C. Rosal, Division of Preventive and Behavioral Medicine, Department of Medicine, University of Massachusetts Medical School
References
- 1.Daviglus ML, Talavera GA, Avilés-Santa ML, et al. Prevalence of major cardiovascular risk factors and cardiovascular diseases among Hispanic/Latino individuals of diverse backgrounds in the United States. JAMA. 2012;308:1775–84. doi: 10.1001/jama.2012.14517. [DOI] [PMC free article] [PubMed] [Google Scholar]
- 2.Hassan MK, Joshi AV, Madhavan SS, Amonkar MM. Obesity and health-related quality of life: a cross-sectional analysis of the U.S. population. Int J Obes. 2003;27:1227–1232. doi: 10.1038/sj.ijo.0802396. [DOI] [PubMed] [Google Scholar]
- 3.Greenberg JA. Obesity and early mortality in the United States. Obesity. 2013;21:405–412. doi: 10.1002/oby.20023. [DOI] [PubMed] [Google Scholar]
- 4.Amerian Psychological Assocation. Stress in America: The state of our nation Stress in America™ Survey. 2017 [Google Scholar]
- 5.Arellano-Morales L, Roesch SC, Gallo LC, et al. Prevalence and correlates of perceived ethnic discrimination in the Hispanic Community Health Study/Study of Latinos Sociocultural Ancillary Study. J Lat Psychol. 2015;3:160–176. doi: 10.1037/lat0000040. [DOI] [PMC free article] [PubMed] [Google Scholar]
- 6.Hunte HER. Association between perceived interpersonal everyday discrimination and waist circumference over a 9-year period in the midlife development in the United States Cohort Study. Am J Epidemiol. 2011;173:1232–1239. doi: 10.1093/aje/kwq463. [DOI] [PMC free article] [PubMed] [Google Scholar]
- 7.Hunte HER, Williams DR. The association between perceived discrimination and obesity in a population-based multiracial and multiethnic adult sample. Am J Public Health. 2009;99:1285–92. doi: 10.2105/AJPH.2007.128090. [DOI] [PMC free article] [PubMed] [Google Scholar]
- 8.Lewis TT, Kravitz HM, Janssen I, Powell LH. Self-reported experiences of discrimination and visceral fat in middle-aged African-American and Caucasian women. Am J Epidemiol. 2011;173:1223–1231. doi: 10.1093/aje/kwq466. [DOI] [PMC free article] [PubMed] [Google Scholar]
- 9.Cozier YC, Wise LA, Palmer JR, Rosenberg L. Perceived racism in relation to weight change in the Black Women’s Health Study. Ann Epidemiol. 2009;19:379–87. doi: 10.1016/j.annepidem.2009.01.008. [DOI] [PMC free article] [PubMed] [Google Scholar]
- 10.Cunningham TJ, Berkman LF, Kawachi I, et al. Changes in waist circumference and body mass index in the US CARDIA cohort: fixed-effects associations with self-reported experiences of racial/ethnic discrimination. J Biosoc Sci. 2013;45:267–278. doi: 10.1017/S0021932012000429. [DOI] [PMC free article] [PubMed] [Google Scholar]
- 11.de Wit L, Luppino F, van Straten A, Penninx B, Zitman F, Cuijpers P. Depression and obesity: a meta-analysis of community-based studies. Psychiatry Res. 2010;178:230–235. doi: 10.1016/j.psychres.2009.04.015. [DOI] [PubMed] [Google Scholar]
- 12.Luppino FS, de Wit LM, Bouvy PF, et al. Overweight, obesity, and depression: a systematic review and meta-analysis of longitudinal studies. Arch Gen Psychiatry. 2010;67:220. doi: 10.1001/archgenpsychiatry.2010.2. [DOI] [PubMed] [Google Scholar]
- 13.Menselson T, Rehkopf DH, Kubzansky LD. Depression among Latinos in the United States: a meta-analytic review. J Consult Clin Psychol. 2008;76:355–66. doi: 10.1037/0022-006X.76.3.355. [DOI] [PubMed] [Google Scholar]
- 14.Heo M, Pietrobelli A, Fontaine KR, Sirey JA, Faith MS. Depressive mood and obesity in US adults: comparison and moderation by sex, age and race. Int J Obes. 2006;30:513–519. doi: 10.1038/sj.ijo.0803122. [DOI] [PubMed] [Google Scholar]
- 15.Clark R, Anderson N, Clark V, Williams D. Racism as a stressor for African Americans: a biopsychosocial model. Am Psychol. 1999;54:805–16. doi: 10.1037//0003-066x.54.10.805. [DOI] [PubMed] [Google Scholar]
- 16.Raison CL, Capuron L, Miller AH. Cytokines sing the blues: inflammation and the pathogenesis of depression. Trends Immunol. 2006;27:24–31. doi: 10.1016/j.it.2005.11.006. [DOI] [PMC free article] [PubMed] [Google Scholar]
- 17.Herbert J. Cortisol and depression: three questions for psychiatry. Psychol Med. 2013;43:449–469. doi: 10.1017/S0033291712000955. [DOI] [PubMed] [Google Scholar]
- 18.Granberg E. The Oxford Handbook of the Social Science of Obesity. Oxford University Press; 2011. Depression and obesity. [Google Scholar]
- 19.Bastos JL, Celeste RK, Silva DAS, Priest N, Paradies YC. Assessing mediators between discrimination, health behaviours and physical health outcomes: a representative cross-sectional study. Soc Psychiatry Psychiatr Epidemiol. 2015;50:1731–42. doi: 10.1007/s00127-015-1108-0. [DOI] [PubMed] [Google Scholar]
- 20.Brondolo E, Hausmann LRM, Jhalani J, et al. Dimensions of perceived racism and self-reported health: examination of racial/ethnic differences and potential mediators. Ann Behav Med. 2011;42:14–28. doi: 10.1007/s12160-011-9265-1. [DOI] [PMC free article] [PubMed] [Google Scholar]
- 21.Earnshaw VA, Rosenthal L, Carroll-Scott A, Santilli A, Gilstad-Hayden K, Ickovics JR. Everyday discrimination and physical health: exploring mental health processes. J Health Psychol. 2016;21:2218–28. doi: 10.1177/1359105315572456. [DOI] [PMC free article] [PubMed] [Google Scholar]
- 22.Lopez-Cepero A, Frisard CF, Lemon SC, Rosal MC. Association of dysfunctional eating patterns and metabolic risk factors for Cardiovascular Disease among Latinos. Acad Nutr Diet. 2018;118:849–856. doi: 10.1016/j.jand.2017.06.007. [DOI] [PubMed] [Google Scholar]
- 23.Silfee V, Lemon S, Lora V, Rosal M. Sedentary behavior and Cardiovascular Disease risk factors among Latino adults. J Health Care Poor Underserved. 2017;28:798–811. doi: 10.1353/hpu.2017.0075. [DOI] [PMC free article] [PubMed] [Google Scholar]
- 24.Williams DR, Yan Yu, Jackson JS, Anderson NB. Racial differences in physical and mental health: socio-economic status, stress and discrimination. J Health Psychol. 1997;2:335–351. doi: 10.1177/135910539700200305. [DOI] [PubMed] [Google Scholar]
- 25.Reeve BB, Willis G, Shariff-Marco SN, et al. Comparing cognitive interviewing and psychometric methods to evaluate a racial/ethnic discrimination scale. In: Willis GB, Miller K, editors. Field methods. Vol. 23. 2011. pp. 397–419. [DOI] [PMC free article] [PubMed] [Google Scholar]
- 26.Molina KM, Alegria M, Mahalingam R. A multiple-group path analysis of the role of everyday discrimination on self-rated physical health among Latina/os in the USA. Ann Behav Med. 2013;45:33–44. doi: 10.1007/s12160-012-9421-2. [DOI] [PMC free article] [PubMed] [Google Scholar]
- 27.Radloff LS. The CES-D Scale: A self-report depression scale for research in the general population. Appl Psychol Meas. 1977;1:385–401. [Google Scholar]
- 28.Grzywacz JG, Hovey JD, Seligman LD, Arcury TA, Quandt S. Evaluating short-form versions of the CES-D for measuring depressive symptoms among immigrants from Mexico. Hisp J Behav Sci. 2006;28:404–422. [PMC free article] [PubMed] [Google Scholar]
- 29.Johnson-Kozlow M, Rock CL, Gilpin EA, Hollenbach KA, Pierce JP. Validation of the WHI brief physical activity questionnaire among women diagnosed with breast cancer. Am J Health Behav. 31:193–202. doi: 10.5555/ajhb.2007.31.2.193. [DOI] [PubMed] [Google Scholar]
- 30.Kline RB. Principles and practice of structural equation modeling. 4th. New York, NY: Guilford Press; 2016. [Google Scholar]
- 31.Anderson JC, Gerbing DW. Structural equation modeling in practice: A review and recommended two-step approach. Psychol Bull. 1998;103:411–423. [Google Scholar]
- 32.Enders CK. Applied Missing Data Analysis. New York, NY: Guilford Press; 2010. [Google Scholar]
- 33.Gee GC, Ro A, Gavin A, Takeuchi DT. Disentangling the effects of racial and weight discrimination on body mass index and obesity among Asian Americans. Am J Public Health. 2008;98:493–500. doi: 10.2105/AJPH.2007.114025. [DOI] [PMC free article] [PubMed] [Google Scholar]
- 34.Hasler G, Pine DS, Kleinbaum DG, et al. Depressive symptoms during childhood and adult obesity: the Zurich Cohort Study. Mol Psychiatry. 2005;10:842–850. doi: 10.1038/sj.mp.4001671. [DOI] [PubMed] [Google Scholar]
- 35.Hunte HE. Association between perceived interpersonal everyday discrimination and waist circumference over a 9-year period in the midlife development in the United States Cohort Study. Am J Epidemiol. 2011;173:1232–1239. doi: 10.1093/aje/kwq463. [DOI] [PMC free article] [PubMed] [Google Scholar]
- 36.Olvera RL, Williamson DE, Fisher-Hoch SP, Vatcheva KP, McCormick JB. Depression, obesity, and metabolic syndrome. J Clin Psychiatry. 2015;76:e1300–e1305. doi: 10.4088/JCP.14m09118. [DOI] [PMC free article] [PubMed] [Google Scholar]
- 37.Everson-Rose SA, Lewis TT, Karavolos K, Dugan SA, Wesley D, Powell LH. Depressive symptoms and increased visceral fat in middle-aged women. Psychosom Med. 2009;71:410–416. doi: 10.1097/PSY.0b013e3181a20c9c. [DOI] [PMC free article] [PubMed] [Google Scholar]
- 38.Konttinen H, Männistö S, Sarlio-Lähteenkorva S, Silventoinen K, Haukkala A. Emotional eating, depressive symptoms and self-reported food consumption. A population-based study. Appetite. 2010;54:473–479. doi: 10.1016/j.appet.2010.01.014. [DOI] [PubMed] [Google Scholar]
- 39.Ouwens MA, van Strien T, van Leeuwe JF. Possible pathways between depression, emotional and external eating. A structural equation model. Appetite. 2009;53:245–8. doi: 10.1016/j.appet.2009.06.001. [DOI] [PubMed] [Google Scholar]
- 40.D’Alonzo KT, Johnson S, Fanfan D. A biobehavioral approach to understanding obesity and the development of obesogenic illnesses among Latino immigrants in the United States. Biol Res Nurs. 2012;14:364–374. doi: 10.1177/1099800412457017. [DOI] [PMC free article] [PubMed] [Google Scholar]
- 41.Hayman LW, McIntyre RB, Abbey A. The bad taste of social ostracism: the effects of exclusion on the eating behaviors of African-American women. Psychol Health. 2015;30:518–533. doi: 10.1080/08870446.2014.983923. [DOI] [PubMed] [Google Scholar]
- 42.Baumeister RF, DeWall CN, Ciarocco NJ, Twenge JM. Social exclusion impairs self-regulation. J Pers Soc Psychol. 2005;88:589–604. doi: 10.1037/0022-3514.88.4.589. [DOI] [PubMed] [Google Scholar]
- 43.Carr D, Friedman MA. Is obesity stigmatizing? Body weight, perceived discrimination, and psychological Well-being in the United States. J Health Soc Behav. 2005;46:244–259. doi: 10.1177/002214650504600303. [DOI] [PubMed] [Google Scholar]
- 44.Zhao G, Ford ES, Li C, Tsai J, Dhingra S, Balluz LS. Waist circumference, abdominal obesity, and depression among overweight and obese U.S. adults: national health and nutrition examination survey 2005-2006. BMC Psychiatry. 2011;11:130. doi: 10.1186/1471-244X-11-130. [DOI] [PMC free article] [PubMed] [Google Scholar]
- 45.McClure HH, Josh Snodgrass J, Martinez CRJ, et al. Stress, place, and allostatic load among Mexican immigrant farmworkers in Oregon. J Immigr Minor Heal. 2015;17:1518–25. doi: 10.1007/s10903-014-0066-z. [DOI] [PubMed] [Google Scholar]