

SUMMARY
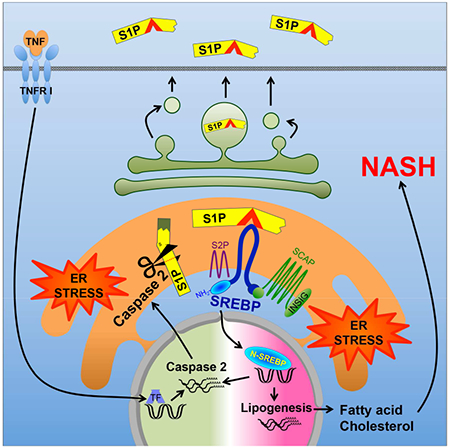
Nonalcoholic fatty liver disease (NAFLD) progresses to nonalcoholic steatohepatitis (NASH) in response to elevated endoplasmic reticulum (ER) stress. Whereas the onset of simple steatosis requires elevated de novo lipogenesis, progression to NASH is triggered by accumulation of hepatocyte free cholesterol. We now show that caspase-2, whose expression is ER-stress-inducible and elevated in human and mouse NASH, controls the buildup of hepatic free cholesterol and triglycerides by activating sterol regulatory element binding proteins (SREBP) in a manner refractory to feedback inhibition. Caspase-2 colocalizes with site 1 protease (S1P) and cleaves it to generate a soluble active fragment that initiates SCAP-independent SREBP1/2 activation in the ER. Caspase-2 ablation or pharmacological inhibition prevents diet-induced steatosis and NASH progression in ER-stress-prone mice. Caspase-2 inhibition offers a specific and effective strategy for preventing or treating stress-driven fatty liver diseases, whereas caspase-2-generated S1P proteolytic fragments, which enter the secretory pathway, are potential NASH biomarkers.
Keywords: NASH, SREBP, caspase-2, site 1 protease, hepatic steatosis
ETOC
Caspase-2 inhibition could present a specific and effective strategy for preventing or treating stress-driven fatty liver diseases.
INTRODUCTION
The obesity epidemic has dramatically increased the incidence of the metabolic syndrome and associated pathologies, including nonalcoholic fatty liver disease (NAFLD), which affects 30% of Americans (Cohen et al., 2011; Farrell et al., 2012). Whereas NAFLD is defined by hepatic steatosis, 15-20% of NAFLD patients manifest liver damage, inflammation, and fibrosis, the hallmark comorbidities of nonalcoholic steatohepatitis (NASH), a disease whose development is thought to depend on endoplasmic reticulum (ER) stress and mitochondrial dysfunction (Tilg and Moschen, 2010). Unlike simple steatosis, NASH is a serious disease that readily progresses to liver cirrhosis and hepatocellular carcinoma (HCC). Although the subject of intense efforts, no effective interventions that prevent or reverse NASH exist other than caloric restriction, enhanced exercise, or bariatric surgery, which only succeed when applied early. Although the role of ER stress in NAFLD to NASH progression (Ji and Kaplowitz, 2006) was confirmed in a mouse model (Nakagawa et al., 2014), its origin and mechanism of action remain unknown. One metabolic process thought to initiate NAFLD is de novo lipogenesis (DNL), whose rate is up to 3-fold higher in NAFLD patients (Lambert et al., 2014). DNL was speculated to contribute to NASH progression by generating lipotoxic free fatty acids (FFA), but recent studies now attribute NASH-related lipotoxicity to free cholesterol accumulation (Caballero et al., 2009; Farrell and van Rooyen, 2012). Non-esterified cholesterol can cause mitochondrial dysfunction when combined with TNF (Mari et al., 2006), another critical driver of NASH (Nakagawa et al., 2014).
ER stress elicits hepatic insulin resistance and inflammation through poorly understood intermediates. Stress-induced eIF2α phosphorylation was shown to increase expression of adipogenic transcription factors (Oyadomari et al., 2008), but another ER stress effector, IRE1α, was reported to attenuate hepatic steatosis (Zhang et al., 2011). To get to the bottom of these intriguing relationships we used MUP-uPA mice, in which hepatocyte ER stress caused by ectopic urokinase (uPA) expression (Weglarz et al., 2000) results in NASH-like pathology upon high-fat diet (HFD) feeding (Nakagawa et al., 2014). Although normal chow (NC)-fed MUP-uPA mice show transient liver damage and steatosis shortly after birth, this damage subsides due to formation of new hepatocytes with reduced uPA expression (Weglarz et al., 2000). In these mice, HFD reignites ER stress and classical NASH signs appear within 16 weeks (Nakagawa et al., 2014). NASH development remains ER-stress-dependent and is inhibited by the chemical chaperons phenyl butyric acid (PBA) and tauroursodeoxycholic acid (TUDCA), or by Bip/GRP78 overexpression (Nakagawa et al., 2014). These treatments block lipid accumulation and attenuate activation of sterol response element binding proteins (SREBP), whose activity is elevated in MUP-uPA mice (Nakagawa et al 2014). These results suggest that SREBP1/2, which activate transcriptional programs that promote FA and cholesterol synthesis, respectively (Osborne and Espenshade, 2009), may play a key role in NAFLD/NASH pathogenesis. Given the NASH-specific accumulation of hepatic cholesterol (Caballero et al., 2009; Puri et al., 2007), it is plausible that the mysterious switch from bland steatosis to NASH depends on SREBP2, whose expression is much higher in NASH than in non-fibrotic NAFLD (Caballero et al., 2009).
SREBP1 isoforms (SREBP1c in liver) and SREBP2 are produced as inactive precursors that are ER-membrane-embedded along with the INSIG:SCAP chaperon complex. Regulation of SREBP2, which controls sterol biosynthesis, is subject to negative feedback inhibition (Brown and Goldstein, 1997). Cholesterol deficiency disrupts the INSIG:SCAP complex to cause translocation of SCAP-bound SREBP2 to the early Golgi where it is processed by active forms of S1P and S2P, site-specific proteases that allow its cytoplasmic-facing N-terminal portion to enter the nucleus and stimulate sterol biosynthetic genes (Osborne and Espenshade, 2009). SREBP1 is also produced as an inactive ER-anchored precursor bound by INSIG:SCAP, but the cues that control its processing by S1P and S2P are complex and include insulin, oxysterols, unsaturated FA, and feeding cues (Hannah et al., 2001; Owen et al., 2012). Despite existence of several negative feedback loops, HFD consumption promotes SREBP activation in WT and MUP-uPA mice (Nakagawa et al., 2014). ER stress also activates SREBPs via ill-defined mechanisms (Colgan et al., 2011) that include INSIG downregulation through PERK-mediated eIF2α phosphorylation and translational inhibition (Bobrovnikova-Marjon et al., 2008; Lee and Ye, 2004). Caspases were also implicated in stress-induced SREBP processing. Activated caspase-3 (Casp3) elicits S1P/S2P-independent SREBP activation (Wang et al., 1996) and other studies suggested caspases-4 and -12 (Casp4, Casp12) to activate SREBPs in alcohol-exposed cells via a poorly defined cholesterol-insensitive mechanism (Pastorino and Shulga, 2008). Most caspases are activated during apoptosis, but hepatocytes with persistently elevated DNL and cholesterol synthesis are not apoptotic. Such hepatocytes, however, may succumb to excessive lipid droplet buildup and reactive oxygen species (ROS) accumulation after TNF exposure (Nakagawa et al., 2014). Accordingly, TNF signaling inhibition attenuates lipid droplet accumulation and ballooning degeneration and prevents NASH progression. We therefore postulated that a non-apoptotic caspase whose activity or expression is induced by ER stress or TNF may control SREBP activation and NASH progression in MUP-uPA mice and humans. One candidate is caspase-2 (Casp2), whose expression is upregulated on ER stress (Upton et al., 2012) and SREBP2 activation (Logette et al., 2005). Casp2 was implicated in ER-stress-induced cell death (Upton et al., 2012), but this particular function was questioned (Sandow et al., 2014). Unlike other caspases, Casp2 was reported to enter the ER lumen and the Golgi apparatus (Cheung et al., 2006; Mancini et al., 2000; O’Reilly et al., 2002), further supporting a link to ER stress (Krumschnabel et al., 2009). Initial interrogation of Casp2−/− mice has not revealed a clear role for Casp2 in any physiologically obvious process (Bouchier-Hayes and Green, 2012), but subsequent studies implicated Casp2 in lipotoxic liver damage elicited by the toxic methionine-and-choline-deficient diet (MCD) (Machado et al., 2015). Although MCD was used to model NASH, the extensive liver damage, weight loss, and lethality that it causes makes it an unsuitable surrogate for the human condition (Ibrahim et al., 2016; Larter and Yeh, 2008). Given these reservations, we investigated Casp2’s role in SREBP activation and hepatic lipid accumulation in MUP-uPA mice. Of note, Casp2 expression was elevated in both MUP-uPA mice and NASH patients and was crucial for hepatic TG and cholesterol accumulation and NASH progression in mice. Importantly, we uncovered an unexpected and key role for Casp2 in ER-stress-induced SREBP1/2 activation that is refractory to feedback inhibition and obtained evidence for Casp2’s involvement in human NASH.
RESULTS
Liver Casp2 is ER-stress-induced and upregulated in NASH
ER stress in MUP-uPA liver peaks 5 to 6 weeks after birth and then declines due to reduced uPA expression in regenerated hepatocytes (Nakagawa et al., 2014; Weglarz et al., 2000). We examined young MUP-uPA livers for expression of Casp2, Casp3, Casp4, Casp8, and Casp12, and found particularly high amounts of precursor and cleaved forms of Casp2 (Figure 1A and S1A), as well as elevated Casp2 mRNA (Figure 1B). In older NC-fed MUP-uPA mice with lower liver ER stress at base, HFD feeding led to TNF receptor 1 (TNFR1)-dependent Casp2 mRNA induction (Figure 1C). HFD also increased Casp2 protein expression (Figure S1A). Administration of the ER stress inducer tunicamycin to non-transgenic 3-month-old NC-fed BL6 mice also induced Casp2 protein and mRNA (Figure 1A and D). Elevated Casp2 expression in NC-fed young and HFD-fed adult MUP-uPA mice was detected by immunohistochemistry (IHC) and confirmed by PCR analysis, which also showed Tnf mRNA induction (Figure S1B and C).
Figure 1: Elevated Casp2 expression in ER-stressed mice and human NASH.
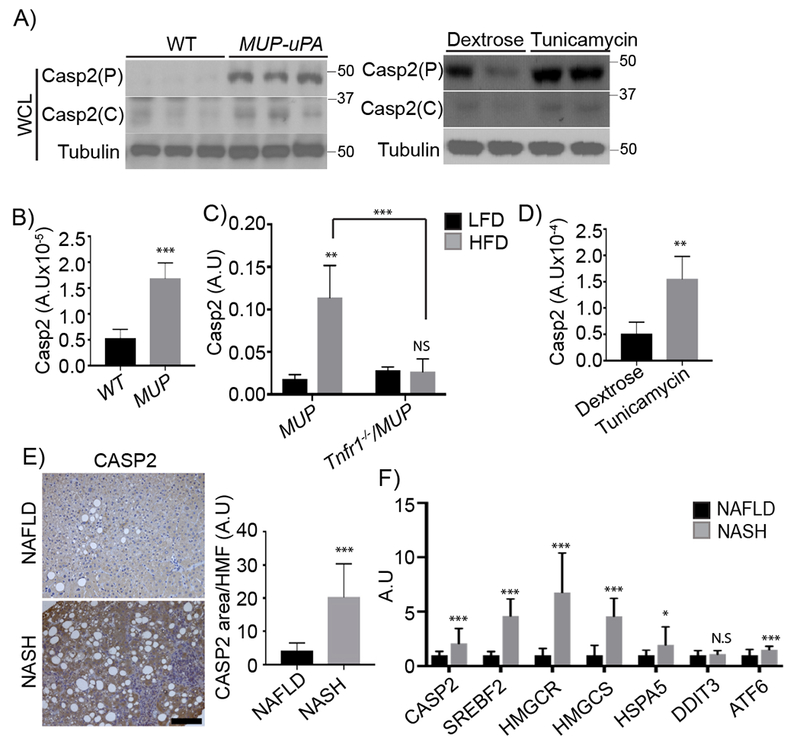
A) Immunoblots (IBs) analysis of whole cell lysates (WCL) from 5-week-old WT and MUP-uPA livers (left) and 3-month-old WT livers exposed to dextrose or tunicamycin. Mean ± SEM (dextrose: n = 4; tunicamycin: n = 5). P: precursor, C: cleaved. B) Casp2 mRNA in livers of above 5-week-old mice quantified by qRT-PCR. Results are mean ± SEM (WT: n = 5; MUP: n = 9). C) Liver Casp2 mRNA in 20-week-old MUP-uPA and Tnfr1−/−/MUP-uPA mice given HFD for 12 weeks. Mean ± SEM [MUP (LFD: n = 4; HFD: n = 8); Tnfr1−/−/MUP (LFD: n = 4; HFD: n = 9)]. D) Liver Casp2 mRNA induction by tunicamycin; mean ± SEM (dextrose: n = 4; tunicamycin: n = 5). E) CASP2 immunohistochemistry (IHC) of liver biopsies from NAFLD (n = 4) and NASH (n = 4) patients. Staining intensity was quantified by ImageJ. F) CASP2, SREBF2, HMGCR, HMGCS, and ER stress marker transcripts (HSPA5, DDIT3 and ATF6) in liver biopsies from NAFLD (n = 10) or NASH (n = 9) patients quantified by qRT-PCR. *p < 0.05, **p < 0.005, ***p < 0.001. A.U., arbitrary units.
CASP2 expression was elevated in NASH patients’ livers relative to simple hepatic steatosis (Figure 1E). CASP2 staining of human or mouse NASH-afflicted livers was not associated with any apoptotic or necrotic features other than macrovesicular fat and hepatocyte ballooning. RNA analysis confirmed that NASH liver biopsies contained more CASP2 mRNA, ER stress marker transcripts [HSPA5 (GRP78/BIP) and ATF6], as well as SREBF2 mRNA and the SREBP2 targets HMGCR and HMGCS (Figure 1F). These results support the suitability of our mouse model for studying how ER stress drives NASH pathogenesis.
Casp2 is required for NASH development
To determine Casp2’s role in NAFLD/NASH development we generated Casp2-deficient MUP-uPA mice (Casp2−/−/MUP-uPA) that were born at the expected Mendelian ratio without obvious abnormalities. Eight-week-old MUP-uPA and Casp2−/−/MUP-uPA mice were placed on HFD (60% of caloric intake provided by saturated fat) and after 12 weeks their livers were excised and evaluated. Casp2−/−/MUP-uPA mice did not exhibit fatty liver and were protected from lipid droplet accumulation, ballooning degeneration, Mallory-Denk body (MDB) formation, p62 accumulation, and macrophage infiltration (Figure 2A). The histological improvement afforded by Casp2 ablation was comparable to the effect of TNFR1 ablation (Figure S2A), which blocks NASH development (Nakagawa et al., 2014). Casp2 ablation reduced serum and liver TG by 50% and 85%, respectively, whereas serum and liver cholesterol were ~20% and 50% lower, respectively (Figure 2B). Casp2 ablation brought liver free cholesterol in HFD-fed MUP-uPA mice to the same level as in BL6 mice (Figure S2B). In 5-week-old MUP-uPA mice, which are ER-stressed, Casp2 ablation did not affect uPA mRNA and did not block liver ER stress/UPR, which was actually elevated based on CHOP expression (Figure S2C).
Figure 2: Casp2 is required for NASH development.
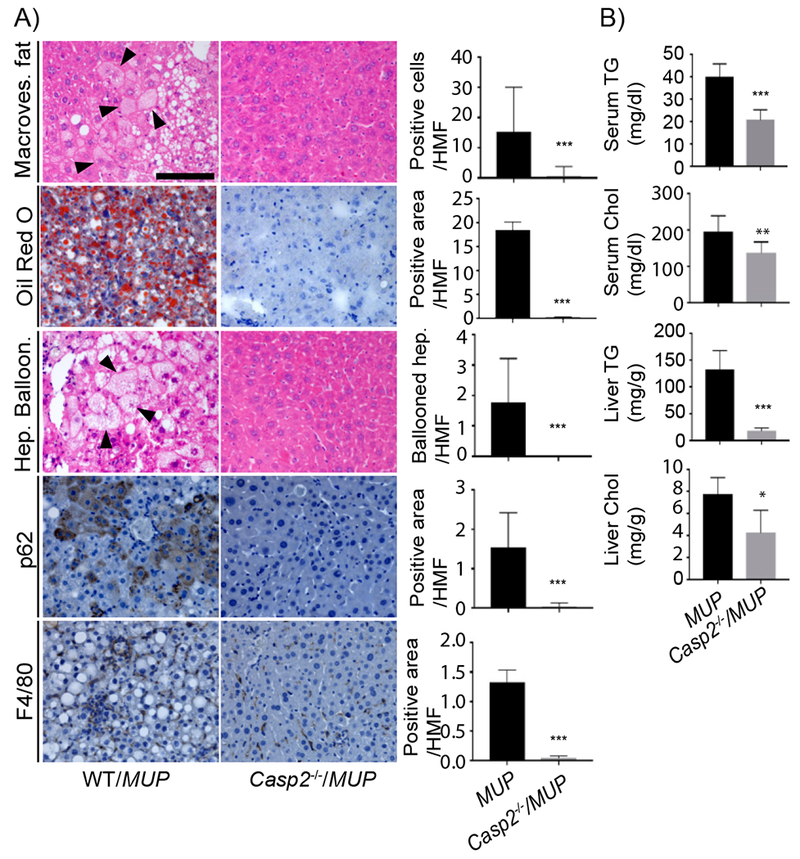
A) IHC of formalin-fixed paraffin-embedded (FFPE) liver sections from indicated mouse strains. H&E reveals tissue composition, macrovesicular fat and hepatocyte ballooning. Oil Red O (ORO) visualizes lipid droplets. p62 and F4/80 immunostaining show Mallory-Denk Bodies (MDB) and macrophage infiltration, respectively. Scale bar: 100 μm. Staining intensity per high magnification field (HMF) was determined by ImageJ of 8 fields per section (WT/MUP: n = 8; Casp2−/−/MUP: n = 6). Bar graphs: mean ± SEM. B) Serum and liver triglycerides (TG) and cholesterol (Chol) in indicated mouse strains (WT/MUP: n = 10; Casp2−/−/MUP: n = 7). Mean ± SEM. *p < 0.05, **p < 0.005, ***p < 0.001.
Casp2 controls adipose tissue expansion and energy expenditure
Body weight and food consumption were measured every 2 weeks during HFD feeding. MUP-uPA mice gained weight gradually, just like non-transgenic BL6 mice (Figure S3A). Remarkably, Casp2 ablation inhibited weight gain with no effect on food consumption in both MUP-uPA and BL6 mice (Figure 3A and S3A). Casp2 ablation also prevented fat depot expansion (Figure 3B and S3B). Morphological analysis indicated that epididymal adipocytes in HFD-fed MUP-uPA mice were twice as large as Casp2−/−/MUP-uPA adipocytes (Figure 3C). Casp2 ablation also reduced adipose tissue inflammation (Figure 3D). Adipogenesis is controlled by an elaborate network of transcription factors, e.g. PPARy and C/EBPβ family members. To investigate Casp2’s effect on adipogenesis, we isolated stromal vascular fractions (SVF) containing adipocyte precursors and converted them to adipocytes. PPARγ and C/EBPβ and adipogenic marker transcripts, including Srebf1a, Srebf2, Adrp30, and Fabp4, were not affected by Casp2 ablation (Figure S3C and D). We conclude that Casp2 indirectly controls adipose tissue expansion rather than adipogenesis per se.
Figure 3: Casp2 controls adipose tissue expansion.
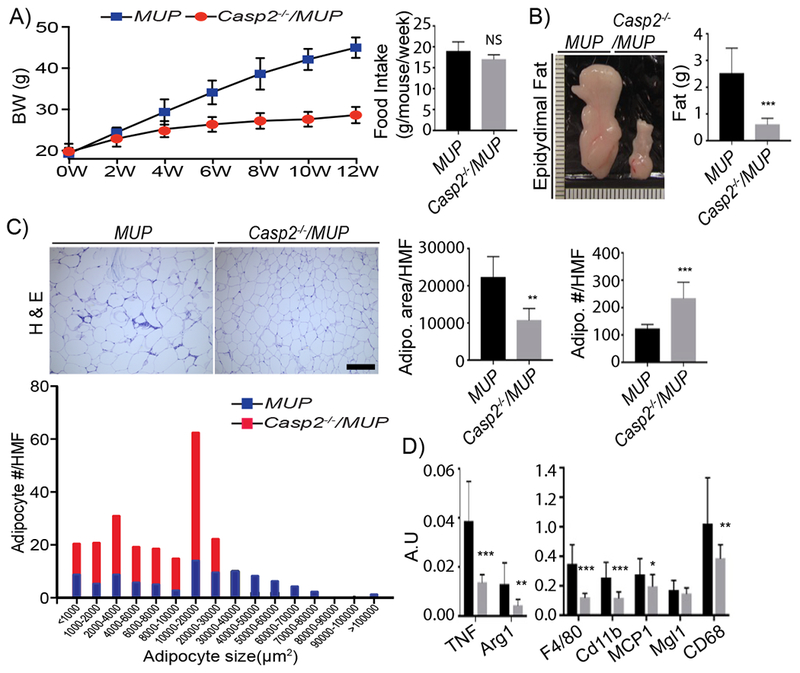
A) Body weight and bi-weekly food intake of indicated mouse strains given HFD (MUP: n = 12; Casp2−/−/MUP: n = 10). Mean ± SEM. B) Gross morphology and epidydimal fat weights from above mice (MUP: n = 12; Casp2−/−/MUP: n = 10). C) H&E stained FFPE epidydimal fat sections. Scale bar: 200 μm. Adipocyte area/HMF, adipocyte number/HMF and adipocyte size distributions were determined by ImageJ of 5 HMF per section (MUP: n = 7; Casp2−/−/MUP: n = 9). D) Cytokine and inflammation marker mRNAs were quantified by qRT-PCR analysis of epidydimal fat RNA. Bar graphs: mean ± SEM. *p < 0.05, **p < 0.005, ***p < 0.001.
We postulated that the inability of Casp2−/− mice to gain weight and fat may reflect increased energy expenditure. Indeed, Casp2 ablation dramatically increased O2 consumption and CO2 production, with a modest increase in respiratory exchange rate (RER), indicating elevated energy expenditure (Figure 4A). Congruently, Casp2−/− mice exhibited markedly elevated AMPK phosphorylation in metabolically active tissues: liver, skeletal muscle, and adipocytes (Figure 4B). UCP1-mediated thermogenesis protects humans and mice from obesity and associated diseases (Feldmann et al., 2009), and is enhanced by adipocyte-specific FA synthase (FAS) ablation (Lodhi et al., 2012). Consistent with SREBP1 inhibition and reduced FAS expression and DNL (see below), Casp2 ablation increased UCP1 expression in inguinal fat and brown adipose tissue (Figure 4C). HFD-induced brown adipose tissue whitening was also prevented in Casp2−/−/MUP-uPA mice, which in response to cold exposure expressed more UCP1 in brown adipose tissue than MUP-uPA counterparts (Figure S4).
Figure 4: Casp2 ablation increases energy expenditure.
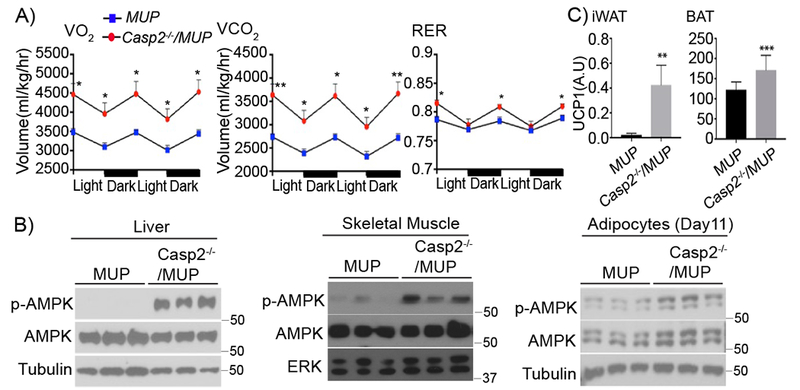
A) VO2, VCO2, and RER measurements in indicated mouse strains given HFD for 12 weeks and kept in metabolic cages for 2 dark and light cycles (n = 6 per group). Mean ± SEM. B) IB of p-AMPK and AMPK in tissue extracts from indicated mouse strains. C) UCP1 mRNA in inguinal fat (iWAT) and brown adipose tissue (BAT) of indicated mouse strains determined by qRT-PCR analysis (MUP: n = 12; Casp2−/−/MUP: n = 10). Mean ± SEM. *p < 0.05, **p < 0.005, ***p < 0.001.
Casp2 controls SREBP cleavage and lipogenic gene expression
Young MUP-uPA mice contained nuclear SREBP1 and 2 in hepatocytes along with precursor and cleaved forms of Casp2 (Figure 5A). Casp2 ablation abolished SREBP1/2 activation (note: the antibodies we used do not distinguish SREBP1a from SREBP1c) in young MUP-uPA mice and reduced nuclear SREBP1/2 in HFD-fed adult MUP-uPA mice (Figure 5A and B). Nuclear SREBP1/2 were generally higher in MUP-uPA mice than in BL6 mice after HFD feeding (Figure S5A). Consistent with diminished SREBP processing, SREBP-inducible transcripts (including Srebflc itself) were lower in Casp2−/−/MUP-uPA livers (Figure 5C). Casp2 ablation reduced SREBP-regulated transcripts to the same level seen in HFD-fed BL6 mice (Figure S5B), suggesting it reversed the effect of uPA-induced ER stress. Casp2 ablation markedly decreased expression of StARD4, a regulator of intracellular cholesterol transport, which was highly elevated in MUP-uPA mice (Figure S5C). However, Casp2 ablation did not affect either INSIG1 or SCAP in HFD-fed MUP-uPA mice (Figure S5D). Casp2 was also needed for TNF-induced SREBP1/2 activation in primary WT hepatocytes (Figure S5E) and its re-expression in Casp2-null hepatocytes restored SREBP1/2 activation, whether or not the cells were TNF-treated (Figure S5F).
Figure 5: Casp2 controls SREBP activation and de novo lipogenesis.
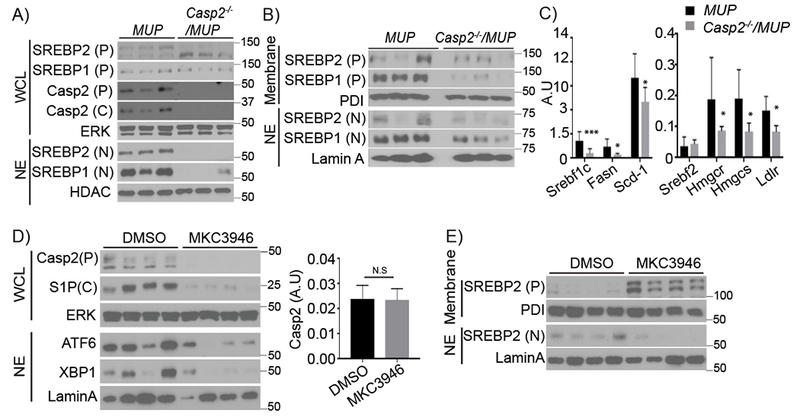
A) IB of SREBP1/2 and Casp2 in WCL and nuclear extracts (NE) from livers of 5-week-old MUP-uPA and Casp2−/−/MUP-uPA mice. P: precursor, C: cleaved, N: nuclear. B) IB of SREBP1/2 in liver membrane fraction and NE from HFD-fed 20-week-old mice. C) qRT-PCR analysis of lipogenic mRNAs in total liver RNA from HFD-fed mice. D) IB analysis of indicated proteins in WCL and NE from livers of 5-week-old MUP-uPA mice treated with vehicle (DMSO) or IRE1 inhibitor (MKC3946) (DMSO: n = 4; MKC3946: n = 6). P: precursor, C: cleaved. Casp2 mRNA was quantitated by qRT-PCR (n = 4). Bar graph: mean ± SEM. *p < 0.05, **p < 0.005, ***p < 0.001. E) Membrane fractions and NE of above livers were IB’d for the indicated proteins.
Casp2 translation depends on IRE1α (Upton et al., 2012). Treatment with the IRE1 inhibitor MKC3946 inhibited liver Casp2 expression as well as XBP1 activation without affecting Casp2 mRNA (Figure 5D) and prevented SREBP2 activation (Figure 5E) in young MUP-uPA mice. MKC3946 also inhibited hepatic steatosis and inflammation (Figure S5G and H). To determine Casp2’s effect on SREBP1/2 and lipogenesis in adipocytes, preadipocytes in SVF were differentiated into mature adipocytes. The Casp2 deficiency reduced expression of precursor and cleaved forms of SREBP1/2 as well as lipogenic enzymes (Figure S5I) and decreased insulin-stimulated lipogenesis (Figure S5J).
Casp2 cleaves S1P but not SREBPs
Apoptotic caspases cleave and activate mammalian and fly SREBPs (Amarneh et al., 2009; Wang et al., 1996). However, the SREBP1 and 2 primary sequences lack obvious Casp2 cleavage sites, whose consensus is VDVAD (Talanian et al., 1997). Co-transfection of Casp2 and SREBP2 into either SCAP-deficient (293ΔSCAP) or WT HEK293 cells did not elicit SREBP1/2 activation/cleavage unless an S1P expression vector was included (Figure 6A and S6A). SREBP activation under these conditions depended on Casp2 catalytic activity but was SCAP-independent, being as pronounced in 293ΔSCAP cells as in WT cells. In HEK293 cells incubated in lipoprotein-deficient serum, SREBP2 was activated by S1P + SCAP, and this was abolished by cholesterol + mevalonate addition (Figure 6B). By contrast, activation of SREBP2 by Casp2 + S1P was refractory to feedback inhibition. Coexpression of Casp2 with S1P or SREBP2 in S1P-deficient HEK293 cells resulted in colocalization of Casp2 with S1P and SREBP2 in juxta-nuclear structures, likely corresponding to peri-nuclear ER and early Golgi (Figure 6C and S6B). However, Casp2 expressed alone displayed punctate cytoplasmic staining. Casp2 overexpression did not induce apoptosis or Casp3 activation under any circumstance, with or without S1P (Figure S6B and C). ER stress was reported to induce SREBP activation (Colgan et al., 2011). Casp2 activity was needed for SREBP2 activation by tunicamycin in S1P-transfected HEK293 cells (Figure S6D). Tunicamycin alone did not activate SREBP2.
Figure 6: Casp2 cleaves S1P to initiate SREBP processing.
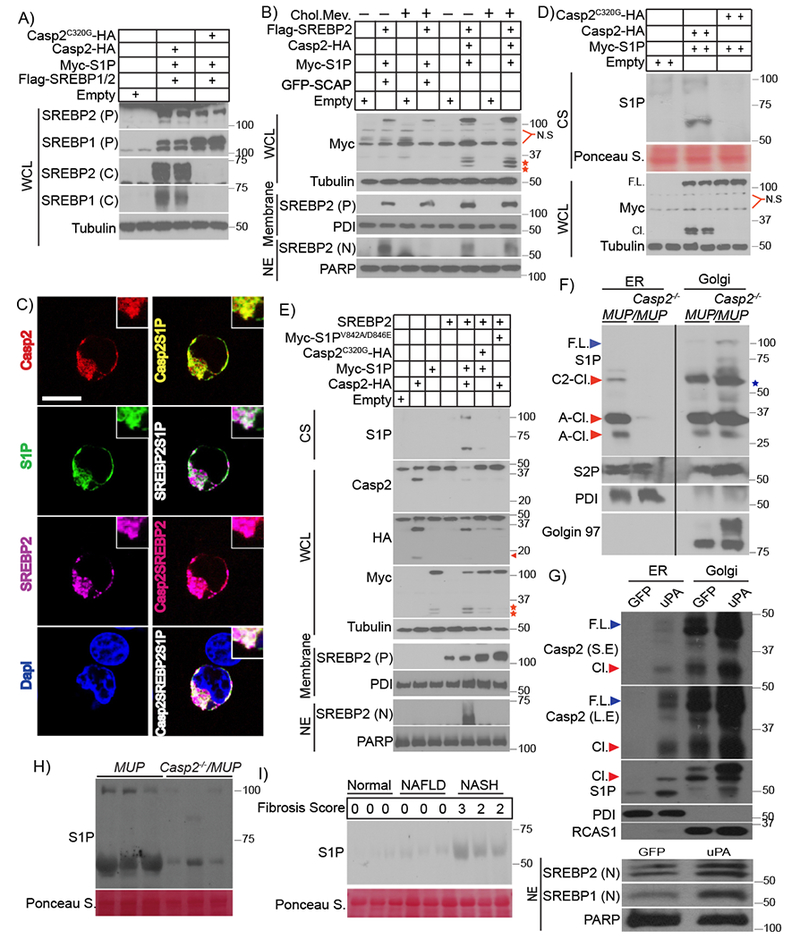
A) Indicated expression vectors were transfected into HEK293 cells. After 48 hr, cells were incubated with 25 μg/ml N-acetyl-leucine-leucine-norleucinal (ALLN) for 3 hr before harvest. WCL were IB’d with antibodies to SREBP1 and 2. B) Indicated expression vectors were transfected into SCAP-ablated HEK293 cells (293ΔSCAP). After 5 hr, cells were incubated with 1% lipoprotein-deficient serum (LPDS) for 16 hr, followed by ethanol or 50 μM mevalonate + 5 μg/ml cholesterol for 12 hr and 3 hr with ALLN before harvest. WCL, membranes, and NE were IB’d. Red stars: N-terminal Myc epitope-containing S1P polypeptides. C) Intracellular localization of Casp2-HA, S1P-Myc and Flag-SREBP2 in S1P-ablated HEK293 cells (293ΔS1P). Transiently expressed Casp2, S1P, and SREBP2 were visualized by immunofluorescence with HA, Myc, and FLAG antibodies, respectively. Nuclei were counterstained with DAPI. Scale bar: 10 μm. D) Indicated proteins were expressed in HEK293 cells. After 48 hr, WCL and culture supernatants (CS) were IB’d with Myc and S1P antibodies (2 lanes per condition). E) Indicated proteins were expressed in 293ΔSCAP cells. 5 hr after transfection, the cells were incubated with 1% LPDS for 16 hr followed by 3 hr with ALLN. WCL, membranes, and NE were prepared and Casp2 and S1P were IB’d with HA and Myc antibodies. CS were IB’d for S1P. Arrow: cleaved Casp2, red stars: N-terminal S1P fragments that retained the Myc epitope. F) ER and Golgi fractions were isolated by differential centrifugation from livers of LFD-fed 7-week-old MUP-uPA and Casp2−/−/MUP-uPA mice. Proteins in each fraction were de-glycosylated with PNGase F and IB’d as indicated. Star: nonspecific band present in the Golgi fraction of Casp2-null liver, F.L: full-length, C2-Cl.: Casp2-cleaved, A-Cl.: autocleaved. G) BL6 hepatocytes introduced with Adv carrying GFP or uPA. After 24 hr, ER, Golgi and nuclear fractions were isolated by differential centrifugation and IB’d for indicated proteins. F.L: full-length, Cl.: cleaved, L.E: long-exposure, S.E: short-exposure. H) IB of S1P in sera of HFD-fed (12 weeks) mice (n = 3) of indicated genotypes. I) Sera from normal individuals, NAFLD and NASH patients (n = 3 per group) with different liver fibrosis scores were IB’d with S1P antibody.
The S1P (aka SKI-1) precursor is an ER membrane-anchored 1052 amino acid (AA) protein with two autocleavage sites: 134RSLK137 and 183RRLL186. Autocleavage produces B- and C-form S1P (100 and 95 kDa, respectively), which remain membrane-anchored (Figure S7A). Coexpression of Casp2 with S1P in HEK293 cells generated a new 68 kDa S1P polypeptide that was secreted into the culture supernatant (Figure 6D), resembling autocleaved C-form S1P whose C-terminal transmembrane (TM) domain was removed by site-directed mutagenesis (Cheng et al., 1999). Casp2 coexpression with S1P also generated a larger secreted polypeptide migrating around 100 kDa, suggesting that this S1P form and the 68 kDa polypeptide lack the C-terminal TM domain (Figures 6D and E). Casp2 also enhanced formation of 2-3 smaller (~30 kDa) intracellular S1P polypeptides that, unlike the 68 and 100 kDa polypeptides, retained the N-terminal Myc epitope originally inserted after the signal sequence (Figures 6B, D and S7A). The small S1P polypeptides are likely generated by autocleavage, since they were also generated by S1P overexpression without Casp2 (Figures S6D and S7B). The secreted 68 kDa and 100 kDa fragments, which react with an S1P antibody recognizing an epitope between AA200-300 (Abcam technical information), most likely correspond to a 72 kDa polypeptide (generated by autocleavage at AA186) stretching from AA187 to the putative Casp2 site, Asp846 (see below), and a longer polypeptide whose N-terminus may correspond to that of A- or B-form S1P, which are secreted after TM domain removal (da Palma et al., 2014). Both forms contain the entire catalytic pocket, although A-site cleavage does not generate active S1P.
To determine whether Casp2-induced S1P processing and SREBP activation depend on direct S1P cleavage and identify the relevant cleavage site(s), we altered the four putative Casp2 sites: 214VAVFD218, 721VIFSD725, 735VKFYD739, and 842VLYGD846 (Figure S7A) by site-directed mutagenesis, replacing the Val and Asp residues at P1 and P5 with Ala and Glu, respectively (Figure S7C). The only mutation clearly affecting S1P processing was the 842V/A-D/E846 substitution, which blocked appearance of the secreted 68 and 100 kDa fragments and reduced production of the 30 kDa intracellular Myc-tagged fragments (Figure 6E and S7D). Casp2 coexpression also inhibited or reduced expression of full-length S1P, but the 842V/A-D/E846 substitution blocked this effect (Figure 6E and S7D). Most importantly, the 842V/A-D/E846 substitution prevented SREBP1 and 2 activation by Casp2 + S1P (Figures 6E and S7E), but had no effect on SREBP activation by SCAP + S1P (Figure S7F). These results suggest that Casp2 first cleaves S1P at Asp846, separating its catalytic pocket from the TM domain, thereby activating S1P and enhancing subsequent self-cleavage at AA186 to generate the secreted 68 kDa polypeptide. Small amounts of A- or B-form S1P cleaved by Casp2 at Asp846 are also secreted to the culture medium. Cleavage at AA186 may also be responsible for generating one of the short 30 kDa S1P polypeptides that contain the N-terminal Myc epitope. Of note, the small 30 kDa autocleaved S1P polypeptides were also detected by an antibody against an N-terminal epitope in 5-week-old MUP-uPA mice, but were absent in age-matched Casp2−/−/MUP-uPA mice (Figure S7G). By contrast, Casp2−/−/MUP-uPA livers contained much higher amounts of membrane-associated full-length S1P, similar to what was observed in HEK293 cells. To determine the subcellular site of S1P cleavage, we purified the ER and Golgi fractions from 7-week-old MUP-uPA and Casp2−/−/MUP-uPA livers. Casp2 expression correlated with presence of cleaved S1P in the ER of MUP-uPA liver (Figure 6F). Furthermore, the Casp2-null MUP-uPA liver contained membrane-bound full-length S1P which was restricted to the Golgi fraction and absent in the MUP-uPA liver. No S1P polypeptides were present in the ER of the Casp2-deficient liver. Transduction of cultured hepatocytes with GFP- or uPA-expressing adenoviruses led to activation of endogenous Casp2, whose full length and cleaved forms were present in the Golgi fractions of both GFP- and uPA-transduced cells, and also in the ER fraction of uPA-, but not GFP-expressing cells (Figure 6G). uPA overexpression also enhanced formation of cleaved ~68 kDa S1P in both the Golgi and ER fractions. The stronger ability of uPA to induce S1P cleavage relative to GFP correlated with enhanced SREBP1/2 activation (Figure 6G).
The 68 and 100 kDa secreted S1P polypeptides were also found in MUP-uPA sera, but were barely detected in Casp2−/−/MUP-uPA sera (Figure 6H). Strikingly, NASH patients’ sera also contained the 68 kDa secreted S1P isoform, which was much less abundant in sera of non-fibrotic NAFLD patients and practically absent in normal controls (Figure 6I). We also examined whether S2P-mediated cleavage was required for Casp2-induced SREBP activation and generated S2P-deficient HEK293 cells. Expression of Casp2 in these cells along with S1P and SREBP2 failed to induce SREBP2 activation, which was readily detected in WT cells (Figure S7H). Instead, Casp2 + S1P expression in 293AS2P cells led to appearance of partially-processed SREBP2 migrating around 80 kDa.
Casp2 inhibition prevents NASH
To examine if Casp2 inhibition has a therapeutic value, at least in mice, we administered the specific, cell-permeable Casp2 inhibitor Ac-VDVAD-CHO (Talanian et al., 1997) to HFD-fed MUP-uPA mice. HFD feeding was initiated at 8 weeks of age and 6 weeks later the mice were i.p. injected with the Casp2 inhibitor on alternate days (Figure 7A). After a 6-week regimen, liver and adipose tissues were removed and examined. Casp2 inhibition prevented hepatic steatosis, ballooning degeneration, p62 accumulation and MDB formation, while decreasing macrophage recruitment (Figure 7B) and attenuating fibrosis. qRT-PCR analysis confirmed that expression of inflammatory cytokines and markers as well as fibrosis-related genes were reduced on Casp2 inhibition (Figure 7C). Casp2 inhibitor treatment also decreased circulating and liver TG and serum cholesterol (Figure 7D) and blocked adipocyte enlargement and adipose tissue macrophage (ATM) accumulation (Figure 7E). Notably, Casp2 inhibition attenuated SREBP1/2 activation in liver and stimulated AMPK phosphorylation in liver and skeletal muscle (Figure 7F and G). Ac-VDVAD administration reduced StARD4 but had no effect on INSIG1/2 expression, mTORC1/p70S6K activation, IRS2 expression, blood insulin, or body weight (Figure S8A). Casp2 inhibition enhanced UCP1 expression in BAT (Figure S8B). Thus, Casp2 inhibition has both prophylactic and therapeutic value, capable of preventing NASH progression without causing hypertriglyceridemia. Inhibition of SREBP1/2 activation was not due to any effects on insulin signaling or INSIG1/2 expression.
Figure 7: Casp2 inhibition prevents NASH.
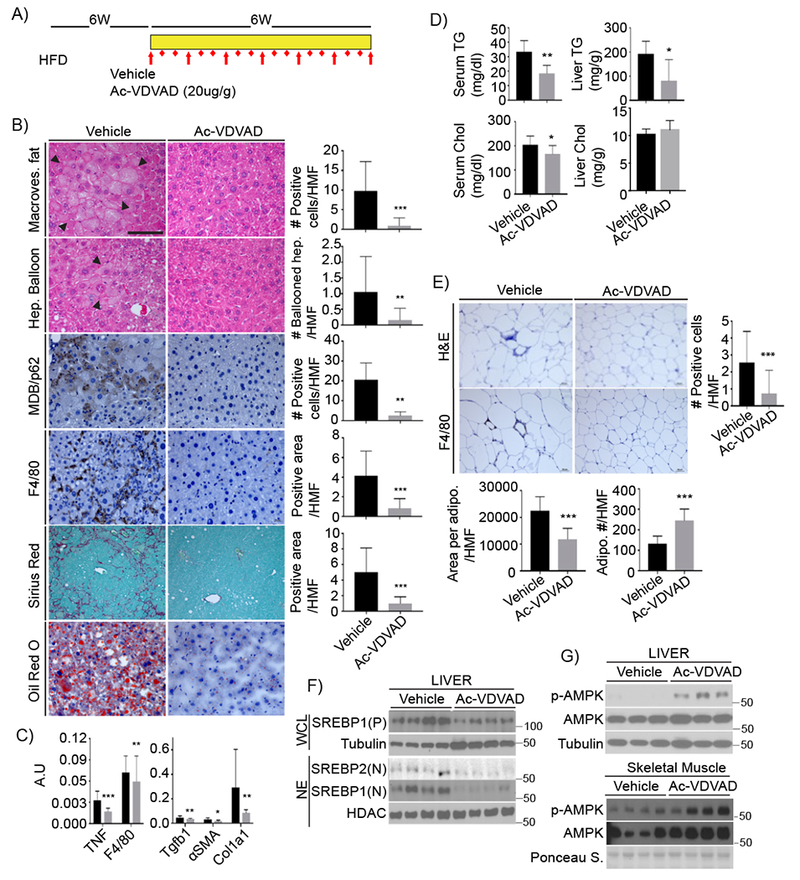
A) Experimental scheme. After 6 weeks on HFD, MUP-uPA mice were treated with Ac-VDVAD (10 μg/g) for 6 weeks while kept on HFD. B) FFPE sections of inhibitor or vehicle treated livers were evaluated for macrovesicular fat, ballooning hepatocytes, MDB and p62 aggregates, macrophages, collagen fibers, and lipid droplets. Magnification bar: 100 μm. Images were quantitated as above; results are shown on right as mean ± SEM (Vehicle: n = 6; Ac-VDVAD: n = 7). C) qRT-PCR of inflammatory and fibrogenic mRNAs (Vehicle: n = 6; Ac-VDVAD: n = 7). Mean ± SEM. D) TG and cholesterol in serum and liver of treated mice (Vehicle: n = 6; Ac-VDVAD: n = 7). E) Adipocytes were visualized by H&E staining of FFPE epidydimal fat sections from inhibitor- or vehicle-injected mice. Adipocyte size and density were determined as above. ATM were stained for F4/80 and quantified. F) SREBP1/2 were IB’d in WCL and NE from livers of untreated and treated mice. G) AMPK IB of liver and muscle extracts.
To examine the effect of liver-specific Casp2 expression, we infected Casp2−/−/MUP-uPA mice with adenoviruses (Adv) encoding WT or catalytically inactive Casp2. Restoration of Casp2 expression led to SREBP2 activation and SREBP2 target gene induction in liver, but not in adipose tissue of mice that were kept on NC (Figure S8C-E). No clear effect on SREBP1 was seen under these conditions. However, feeding Adv-transduced Casp2−/−/MUP-uPA mice HFD, even for just 10 days after Adv infection, resulted in pronounced activation of both SREBP2 and SREBP1 only in mice transduced with WT Casp2 (Figure S8C), which also exhibited elevated hepatic steatosis (Figure S8F).
DISCUSSION
Progression from simple steatosis to NASH may depend on secondary hits, including ER stress (Farrell et al., 2012; Tilg and Moschen, 2010). Congruent with this hypothesis, ER stress related transcripts (HSPA5 and ATF6) were elevated in human NASH. Although ER stress was proposed to induce cell death and inflammation through numerous mediators (Ji and Kaplowitz, 2006; Zhang et al., 2014), exactly how it promotes NASH progression was heretofore unknown. We now demonstrate that Casp2 is the most critical mediator of the transition from benign NAFLD to NASH, at least in MUP-uPA mice. Casp2 expression is highly elevated in human NASH and young MUP-uPA mice, when liver ER stress is high, and is IRE1-dependent. In older mice, Casp2 is induced by HFD feeding in a manner dependent on TNFR1 signaling. Ablation of Casp2 or pharmacological intervention with its expression or activity prevents NASH development in the MUP-uPA model. In fact, the effect of Casp2 inhibition is at least as strong as the effect of chemical or biological chaperons, which inhibit NASH development by relieving ER stress (Nakagawa et al., 2014). The main conduit through which Casp2 affects NASH development is S1P, whose activation by Casp2 results in dysregulated SREBP1/2 activation, leading to TG and cholesterol accumulation within hepatocytes.
ER-stress-induced SREBP activation occurs under diverse experimental conditions, but the underlying mechanisms were poorly defined and rarely studied in vivo (Colgan et al., 2011). ER stress was also suggested to stimulate hepatic steatosis through SREBP-independent mechanisms (Zhang et al., 2014), including PERK-eIF2α-ATF4-mediated induction of adipogenic transcription factors (Oyadomari et al., 2008). By contrast, the IRE1α-XBP1 module was reported to attenuate hepatic steatosis (Zhang et al., 2011), but other investigators showed XBP1 to activate lipogenic genes (Lee et al., 2008) and ATF6 was claimed to reduce hepatic steatosis by antagonizing SREBP2 (Zeng et al., 2004). In contrast to these conflicting reports, we show that ER-stress-mediated SREBP1/2 activation, TG and cholesterol accumulation, as well as NASH progression all depend on Casp2, whose protein expression is induced upon IRE1 activation. Casp2 activates SREBP1/2 downstream of TNF, which induces Casp2 mRNA. Importantly, Casp2 activates SREBP1 and 2 through a hitherto undescribed mechanism that is not subject to feedback inhibition by sterols or unsaturated FA, which inhibit normal SCAP-dependent SREBP activation (Brown and Goldstein, 1997; Hannah et al., 2001; Osborne and Espenshade, 2009). The same mechanism seems to operate in human NASH patients. These findings explain how ER stress and hypernutrition overcome the normal homeostatic controls that safeguard multicellular animals against excessive lipogenesis. Furthermore, the activation of Casp2 gene transcription by SREBP2 (Logette et al., 2005) suggests the existence of a positive autoregulatory loop that plays a critical role in NASH pathogenesis by receiving additional inputs from IRE1 and TNFR1.
Casp2, SREBP activation and NASH
Canonical SREBP activation requires transport of SCAP-bound SREBP from the ER to the early Golgi, where SREBP1/2 cleavage is initiated by the active form of S1P (Osborne and Espenshade, 2009). This pathway is subject to feedback inhibition by sterols (Brown and Goldstein, 1997) and unsaturated FA (Hannah et al., 2001), and may be either inhibited or stimulated by insulin through effects on INSIG and SREBP1c expression and processing (Fernandez-Alvarez et al., 2010; Yecies et al., 2011). However, it was described that apoptotic caspases, e.g. Casp3, can directly cleave and activate SREBP in an S1P/S2P-independent manner in cultured cells (Wang et al., 1996). Unlike Casp3, Casp2 does not trigger apoptosis and cannot activate SREBP1/2 directly, correlating with absence of high-affinity Casp2 target sites. Nonetheless, when coexpressed with S1P, with which it colocalizes to juxta-nuclear structures that likely correspond to the ER and early Golgi, Casp2 promotes SREBP activation by cleaving S1P at Asp846. This cleavage event severs the S1P catalytic pocket from its C-terminal TM domain, generating soluble S1P isoforms that reach the ER to initiate SCAP-independent SREBP processing that is refractory to feedback inhibition. Casp2-activated S1P is present in the ER fraction of MUP-uPA liver or uPA-overexpressing hepatocytes, whereas no S1P-derived polypeptides were detected in the ER fraction of the Casp2-null liver. Moreover, the major Casp2-generated S1P cleavage products enter the circulation and are found in sera of MUP-uPA mice and human NASH patients. By comparison, self-activated S1P is membrane-anchored and concentrated at the Golgi (Espenshade et al., 1999). However, in SCAP-deficient cells incubated with brefeldin, active S1P can be found in the ER and is sufficient for SCAP-independent SREBP activation (DeBose-Boyd et al., 1999). We postulate that subsequent to Casp2-mediated separation of its catalytic pocket from the TM domain, luminal S1P undergoes final activation through C-site self-cleavage, leading to formation of the 68 kDa polypeptide, which eventually enters the secretory pathway. Prior to its secretion, Casp2-activated S1P cleaves SREBP1/2 at site 1, followed by the S2P-mediated cleavage step that results in final SREBP activation. Notably, SREBP1/2 activation by the Casp2-S1P pathway is SCAP-independent, and Casp2, S1P, and SREBP2 cohabitate the same juxta-nuclear compartment. This unique pathway of SREBP1/2 activation results in persistent upregulation of DNL, which is needed for NAFLD initiation and accumulation of hepatocyte free cholesterol, which drives the transition from simple steatosis to NASH (Farrell and van Rooyen, 2012). In human subjects, cholesterol accumulation distinguishes bland steatosis from NASH and correlates with elevated expression of SREBP2 and its target genes.
Of note, NASH patient sera contain much higher amounts of the secreted 68 kDa S1P polypeptide than sera of non-fibrotic NAFLD patients or normal controls. If confirmed in a larger cohort, these results should provide a much-needed biomarker for non-invasive monitoring of NASH progression and severity. The same biomarker can also be used to monitor Casp2 activity before and after drug treatment and its presence supports the notion that Casp2 also plays a critical role in human NASH pathogenesis. Although Casp2 does not trigger hepatocyte apoptosis, the excessive accumulation of free cholesterol caused by its activation predisposes hepatocytes to TNF-induced mitochondrial dysfunction and death (Mari et al., 2006), which likely play key roles in NASH initiation.
Casp2, energy expenditure and lipid accumulation
Casp2 regulates energy expenditure. Casp2-deficient mice consume as much food as Casp2-proficient mice but do not gain weight and show elevated O2 consumption and CO2 production. Enhanced energy expenditure is accompanied by a marked increase in AMPK phosphorylation in metabolically active tissues, suggesting that although initial ER stress in MUP-uPA mice is liver-specific and elicited by uPA expression, Casp2 also controls energy metabolism in fat and muscle. Although adipocytes in HFD-fed Casp2−/− mice are much less hypertrophic than WT adipocytes and are not surrounded by ATM, this may not be entirely due to loss of adipocyte-intrinsic Casp2. For instance, liver-specific Casp2 action resulting in upregulation of DNL can enhance secretion of TG, whose excess is removed by adipocyte-specific storage. Conversely, reduced DNL in Casp2-deficient mice results in UCP1 upregulation, favoring energy expenditure and thermogenesis. Correspondingly, treatment of HFD-fed MUP-uPA mice with Casp2 or IRE1 inhibitors prevents hepatic steatosis, damage and inflammation. Casp2 inhibition also results in AMPK activation, further reducing lipid deposition and inflammation. These results also demonstrate that in contrast to a previous study based on the liver-damaging MCD model (Machado et al., 2015), Casp2 does not exert its NASH-promoting effect through lipotoxic cell death. Instead, Casp2 acts as a critical pathophysiological regulator of DNL, cholesterol metabolism and energy expenditure, in part via its ability to activate SREBP1 and 2. Thus, Casp2 inhibition offers an ideal way for prevention or treatment of NASH, because while reducing hepatic steatosis, cholesterol accumulation and liver damage, it prevents hyperlipidemia. Furthermore, Casp2 inhibition should have no effect on physiological SREBP activation and other S1P-dependent responses.
STAR METHODS
CONTACT FOR REAGENT AND RESOURCE SHARING
Further information and requests for resources and reagents should be directed to and will be fulfilled according to institutional rules by the Lead Contact, Michael Karin (karinoffice@ucsd.edu).
EXPERIMENTAL MODEL AND SUBJECT DETAILS
Mouse strains and HFD feeding
Casp2−/− mice were purchased from The Jackson Laboratories and crossed with either C57BL/6 or MUP-uPA mice (Weglarz et al., 2000) to generate Casp2−/−/WT or Casp2−/−/MUP-uPA mice, respectively. All mouse lines were either on a pure C57BL/6 genetic background or crossed into it for at least nine generations. Only male mice were used and experiments were approved by the University of California San Diego (UCSD) Institutional Animal Care and Use Committee. Mice were fed HFD (#S3282, Bio-serv) for a total of 12 weeks, starting at 8 weeks of age. Body weight increase and food consumption were monitored bi-weekly throughout the entire feeding period. Mice were starved for 3 hr before sacrifice and liver and adipose tissue were excised and weighed.
Generation of cell lines
SCAP, S1P, or S2P knock-out HEK293 cells (293ΔSCAP, 293ΔS1P, or 293ΔS2P) were generated using LentiCRISPRv2 system (Sanjana et al., 2014). Two oligonucleotides that contain guide sequences against SCAP, S1P, or S2P were synthesized and annealed to lentiCRISPRv2 vector. Insertion of oligonucleotides into vector was verified by DNA sequencing. Guide sequences were delivered into HEK293 cells through viral transduction and SCAP, S1P, or S2P-deleted 293 cells (293ΔSCAP, 293ΔS1P, or 293ΔS2P) were selected in DMEM/F12 medium supplemented with puromycin (10 μg/ml). Cholesterol and lipid auxotrophic 293ΔSCAP, 293ΔS1P, or 293ΔS2P cells were maintained in medium supplemented with 10% FBS, 5 μg/ml cholesterol, 20 μM sodium oleate, and 1 mM mevalonate. The oligonucleotides used for deletion of SCAP, S1P, or S2P in HEK293 cells are listed in Table S3.
Human specimens
Patients with clinical indication for liver biopsy were prospectively enrolled with written informed consent at the UCSD NAFLD Research Center (Caussy et al., 2017; Loomba et al., 2017; Park et al., 2017). After undergoing evaluation for other causes of hepatic steatosis and liver disease, patients were invited to undergo standardized history, physical and anthropometric exam, and laboratory testing. The study was HIPAA compliant and approved by the UCSD Institutional Review Board and the Clinical and Translational Research Institute. Participants were included if they met the following criteria: 1. 18 years or older, 2. Fat accumulation in the liver (steatosis) involving at least 5% of hepatocytes on routine stains, 3. No evidence of other acute or chronic liver disease, 4. Absence of regular or excessive use of alcohol. Regular or excessive alcohol is defined as an average alcohol intake of more than 14 drinks of alcohol/week in men or more than 7 drinks of alcohol/week in women. Liver histology assessment was done using the NASH CRN Histologic Scoring System by an experienced, blinded GI pathologist. All biopsies were assessed for the following three parameters: steatosis was graded 0-3, lobular inflammation was graded 0-3, ballooning was graded 0-2, fibrosis stage was classified into five staged from 0-4. Presence of NASH was defined as a pattern that was consistent with steatohepatitis including presence of steatosis, lobular inflammation and ballooning with or without perisinusoidal fibrosis. NAFL was defined as the presence of steatosis with no evidence of hepatocellular injury in the form of hepatocyte ballooning or no evidence of fibrosis. For non-NAFLD control group, non-NAFLD controls were derived from the Twin and Family cohort, prospectively recruited at the UCSD NAFLD Research Center (Caussy et al., 2017; Loomba et al., 2017; Park et al., 2017). All participants underwent a standardized exhaustive clinical research visit including detailed medical history, physical examination, and testing to rule out other causes of chronic liver diseases (see inclusion and exclusion criteria for further details), fasting laboratory tests at the UCSD NAFLD Research Center and then underwent an advanced Magnetic Resonance examination including magnetic resonance imaging proton density fat fraction (MRI-PDFF) for the quantification of liver fat content at the UCSD MR3T Research Laboratory for the screening of NAFLD and advanced fibrosis (Le et al., 2012; Loomba et al., 2015). Written informed consent was obtained from each participant, and the research protocol was approved by the UCSD Institutional Review Board. Participants without evidence of NAFLD (MRI-PDFF < 5%) were considered as non-NAFLD control.
METHOD DETAILS
Reagents
Cholesterol was obtained from Santa Cruz Technologies (#sc-202539). Sodium oleate (#O7501), (R)-(−)-mevalonolactone (#68519), and Ac-VDVAD-CHO (#SCP0076) were from Sigma-Aldrich. Total Exosome Isolation Reagent for both plasma (#4484450) and cell culture media (#4478359) were from Thermo Fisher Scientific. PNGase F (#P0704) was from New England BioLabs. Antibodies used for IB analysis were: anti-Casp2 for IB analysis (#ALX-804-356, Enzo Life Sciences), anti-Casp2 for IHC (#Ab2251, Abcam), anti-p62 (#GP62-C, ProGen), anti-SREBP1 (#Ab3259, Abcam), anti-SREBP2 (#Ab30682, Abcam), anti-S1P for detection of N-terminal fragments (#sc-271916, Santa Cruz Technologies), anti-S1P for detection of the catalytic pocket (#Ab140592, Abcam), anti-phospho-AMPK (#2535, Cell Signaling Technologies), anti-AMPK (#sc-25792, Santa Cruz Technologies), anti-ERK (#9102, Cell Signaling Technologies), anti-ACC (#3662, Cell Signaling Technologies), anti-FAS (#3180, Cell Signaling Technologies), anti-Hmgcr (#sc-33827, Santa Cruz Technologies), anti-Hmgcs (#sc-373681, Santa Cruz Technologies), PARP (#sc-7150, Santa Cruz Technologies), anti-UCP1 (#10983, Abcam), anti-F4/80 (#MF48000, Thermo Fisher Scientific), anti-HA (#1867431, Roche), anti-Myc (#05-724, Upstate), anti-Flag (#F7425, Sigma-Aldrich) and anti-tubulin (#T5168, Sigma-Aldrich).
Transfections and cell fractionation
To test S1P processing, cells were plated at a density of 5 × 10⁵ per well of 6 well plates. On the next day, 1 μg of indicated vector DNAs were transfected using Lipofectamine 3000 (Thermo Fisher Scientific, MA) according to manufacturer’s instruction. After 5 hr, cells were incubated in DMEM/F12 medium supplemented with 1% lipoprotein deficient serum (LPDS). For SREBP cleavage, cells were plated on 5 × 10 cm plates at a density of 4 × 10⁶ per plate. The next day, cells were transfected with 5 μg of each plasmid DNA using Lipofectamine 3000 (Thermo Fisher Scientific, MA) according to manufacturer’s instructions and incubated in DMEM/F12 medium supplemented with 1% LPDS for 24 hr. Nuclear and membrane fractions were prepared as described previously (DeBose-Boyd et al., 1999). Briefly, cells were incubated in hypotonic buffer A (10 mM HEPES-KOH, pH 7.6, 10 mM KCl, 1.5 mM MgCl2, 1 mM sodium EDTA, 1 mM sodium EGTA, 250 mM sucrose, and 5 g/ml pepstatin A, 10 g/ml leupeptin, 0.5 mM PMSF, 1 mM DTT, and 25 g/ml ALLN) for 1 hr and passed through a 26G-gauge needle 30 times. Cell lysates were centrifuged at 890 g at 4°C for 10 min to collect nuclei. Pellets were resuspended in lysis buffer (150 mM Tris-HCl, pH 7.4, 10% sodium-deoxycholate, 100 mM NaCl, 100 mM EDTA, 100 mM PMSF, 200 mM NaF, 100 mM Na3VO4, and a mixture of protease inhibitors) to collect nuclear extracts. The supernatants from the original 890 g spin were centrifuged at 60,000 g for 1 hr at 4°C in a Beckman centrifuge (TLA 100.3 rotor) to collect membranes. Pellets were subjected to sonication and removed of carbohydrate moieties by PNGase F. Prepared nuclear and membrane extracts were subjected to IB analysis.
Detection of secreted S1P
50 μl of plasma was incubated with 10 μl of exosome isolation slurry for 30 min at 4°C. After centrifugation, the sedimented pellet was resuspended in PBS, followed by sonication and incubation with PNGase F. 10 μl of plasma samples were applied to IB analysis with S1P antibody. For detection of secreted S1P, culture supernatants were mixed with exosome isolation slurry and left at 4°C overnight. After centrifugation, pellets were resuspended, subjected to sonication, and carbohydrate moieties were removed. S1P was detected by IB analysis.
RNA analysis
RNAs were extracted from liver or fat tissue of indicated mice or human biopsies using TRIZOL reagent according to manufacturer’s instruction. cDNAs were synthesized from total RNAs using Super Script VILO cDNA Synthesis Kit (Thermo Fisher Scientific, MA) according to the supplier’s instructions. The cDNAs were quantified by real-time PCR analysis using SYBR Green Master Mix (Bio-Rad, CA). The primer sequences that were used for human biopsies are listed in Table S1. The primers used to determine mRNA in fat or liver of mice are listed in Table S2. Mean levels of Cq values were measured from triplicate PCR analyses for each sample and normalized to the amount of Cyclophilin A transcripts. Primer sequences for Tnf, Arg1, F4/80, Cd11b, Mcp1, Mgl1, Cd68 were described (Lumeng et al., 2007) and lipogenic enzyme mRNAs including mSrebf1c, Srebf2, Fasn, Scd-1, Hmgcr, Hmgcs, and Ldlrwere also described (Yang et al., 2001).
Immunohistochemistry
Liver and epidydimal fat were fixed in 4% paraformaldehyde for 48 hr and embedded in paraffin, sectioned, stained with hematoxylin and eosin (H&E) to evaluate gross morphology and ballooning degeneration and with Sirius Red to determine fibrosis. Prepared FFPE sections were subjected to incubation with antibodies specific to p62 and F4/80 to visualize formation of Mallory-Denk Bodies (MDB) and macrophage infiltration, respectively. For frozen-block preparation, liver tissue was embedded in Tissue-Tek OCT compound (Sakura Finetek), sectioned, and stained with Oil Red O to visualize TG accumulation. Stained areas were quantified using ImageJ software.
Expression vectors
Mouse S1P (MC204593) and mouse Casp2 cDNA clone (MC206011) were purchased from Origene Technologies, Inc. Flag-tagged SREBP2 (#32018) cDNA clone was from Addgene. We generated Myc-S1P in which the c-Myc epitope was inserted between AA23 and 24 of mouse S1P as described previously (Sakai et al., 1998). S1P-Myc with a C-terminal Myc epitope was generated by PCR amplification and subsequently cloned between the Nhe1 and BamH1 sites of pCDH-CMV-MCS-EFI-Puro (#CD500-CD700, System Bioscience). Casp2-HA with a C-terminal HA epitope was amplified and subsequently cloned between the NheI and BamHI sites of pCDH-CMV-MCS-EF1-Puro. The primers used are listed in Table S4 and DNA sequences of the cDNA constructs were confirmed by DNA sequencing.
Immunofluorescence
Cells were plated on cover slips on day 0 at density of 1.5 × 10⁵ cells per well. On day 1, 0.2 μg of plasmid DNA were transfected using Lipofectamine 3000. After incubation in 1% LPDS, the cells were fixed with 4% paraformaldehyde for 30 min followed by permeabilization with 0.2% Triton X-100 for 3 min. The cells were then incubated in blocking solution (5% Bovine Serum Albumin, 5% Donkey serum, 0.1% Tween 20 in PBS, pH 7.4) for 1 hr at RT, followed by O.N. incubation with primary antibodies. On the next day, the cells were washed with PBS 5 times and incubated with secondary conjugated antibodies for 1 hr. DAPI was used for nuclear staining. Anti-rat HA (1:100) and Alexa-594 conjugated donkey anti-rat IgG (A21209, Life Technologies) were used for detection of Casp2-HA, anti-mouse Myc (1:100) and Alexa-488 conjugated donkey anti-mouse IgG (A21202, Life Technologies) were used for S1P-Myc, anti-rabbit Flag (1:100) and Alexa-647 conjugated donkey anti-rabbit IgG (A31573, Life Technologies) were used to detect Flag-SREBP2. Images were taken via a Leica TCS SP5 X confocal microscope.
Triglyceride and cholesterol analysis
Liver lipids were extracted using chloroform/methanol (2:1 v/v) and plasma and liver TG and cholesterol were determined using Triglyceride Colorimetric Assay Kit (Cayman Chemical Company, MI) and Cholesterol Quantification Kit (Sigma-Aldrich, MO) according to manufacturer’s instructions.
Metabolic cage analysis
Indicated mice were fed with HFD for 12 weeks and subjected to metabolic cage analyses. Metabolic parameters including O2 consumption, CO2 production, and respiratory exchange ratio were recorded by Comprehensive Lab Animal Monitoring System (Columbus Instruments) for 4 consecutive days and nights, with at least 24-hr adaptation period prior to data recording.
ER and Golgi isolation and separation
The ER and Golgi fractions were isolated from mouse liver as described previously (Croze and Morre, 1984). Briefly, mice were sacrificed and livers were quickly removed. 0.8 g of liver tissue were minced and placed in 3.0 ml of homogenization buffer (37.5 mM TRIS-maleate, pH 6.4; 0.5 M sucrose; 1% dextran; 5 mM MgCl2). After homogenization with a Herdolph RZR 50 motor-driven homogenizer, liver homogenates were centrifuged at 5,000 g for 15 min (Sorvall RC6+, SS-34 rotor). To isolate the Golgi compartment, the yellow-brown portion (upper one-third) of the pellet was removed and suspended in 0.5 ml of homogenization buffer and then layered over a 1.2 M sucrose cushion. After centrifugation at 100,000 g for 30 min (Beckman Coulter Optima XE-90, SW 55 Ti rotor), the Golgi fraction was collected from the homogenate-1.2 M sucrose interface. Collected Golgi compartments were diluted in homogenization buffer and centrifuged at 5,500 g for 20 min. To isolate the ER fraction, the supernatant from the initial centrifugation was combined with the one obtained from the 100,000 g spin used to isolate the Golgi complex and subjected to manual-homogenization in 2 ml of homogenization buffer. Homogenates were centrifuged at 8,500 g for 5 min (Sorvall RC6+, SS-34 rotor) to remove mitochondria. The supernatant was layered onto a discontinuous sucrose gradient consisting of 2.0 M, 1.5 M and 1.3 M sucrose in a v/v ratio of 3:4:4 and centrifuged for 120 min at 90,000 g (Beckman Coulter Optima XE-90, SW 41 Ti rotor). ER fraction was collected from the 1.3 M-1.5 M interface and the 1.5 M-2.0 M interface. Proteins in each of the membrane fractions were extracted by sonication, de-glycosylated, and subjected to IB analysis as described. To obtain ER and Golgi fractions from hepatocytes, hepatocytes were transduced using Adv expressing GFP or uPA (Lieber et al., 1995).
In vitro adipocyte differentiation
Preadipocytes were obtained from inguinal adipose tissue, and induced to differentiate in DMEM supplemented with 10% FBS along with 500 μM 3-Isobutyl-1-methylxanthine, 2.5 μM dexamethasone, 1 μg/ml insulin and 5 μM Rosiglitazone. After 3 days, the cells were cultured in DMEM supplemented with 10% FBS and 1 μg/ml insulin for another 3 days. Then, mature adipocytes were kept in 10% FBS containing DMEM.
De novo lipogenesis
Two days after completion of the differentiation process, adipocytes were starved overnight and then incubated for 2 hr at 37°C in DMEM-0.2% fatty acid-free BSA with or without 50 nM insulin and 0.5 μCi 14C-glucose. After incubation, the cells were washed with PBS for 3 times, and lysed in 200 μl of 0.1 N HCl. Lipids were extracted by adding 500 μl of 2:1 chloroform-methanol to 100 μl cell lysate. After 5 min incubation, 250 μl water was added. Samples were centrifuged at 3,000 g for 10 min. 100 μl lower phase was transferred into 5 ml liquid scintillation fluid to measure 14C activity. 14C activity was normalized to cellular protein content.
Morphological analysis of fat
Morphological analysis of adipocytes was performed by using MRI adipocyte tools (Osman et al., 2013). Images were taken from FFPE epidydimal fat section by AXIO Imager A2 (Carl Zeiss, Germany) and subjected to MRI adipocyte software to obtain area of individual fat cell and number of adipocytes per HMF. Quantification and statistical significance were analyzed by Prism 7 software (GraphPad Prism, CA).
QUANTIFICATION AND STATISTICAL ANALYSIS
Data are represented as mean ± SEM as indicated. Differences in mean values were analyzed by Student t-test or one-way ANOVA (for more than 2 groups). P value < 0.05 was considered as significant (N.S: p ≥ 0.05, *: p < 0.05, **: p < 0.005, ***: p < 0.0001). Statistical analyses were performed using GraphPad Prism 7 software (San Diego, CA).
Supplementary Material
Highlights.
Caspase-2, which is induced by ER stress and TNF, controls NASH development.
Caspase-2 exerts its pathogenic effect via proteolytic activation of S1P.
Caspase-2-cleaved S1P triggers uncontrolled activation of SREBPs.
Persistent SREBP activation results in NASH development.
ACKNOWLEDGEMENTS
We thank Karin Lab members for helpful discussions, Cell Signaling Technologies, Santa Cruz Technologies, and Life Technologies for gifts of antibodies/other reagents. We also thank VectorBuilder Inc. for generation of adenovirus. P. Espenshade (Johns Hopkins University) for GFP-SCAP construct, P. Cohen (Rockefeller University) for discussion regarding thermogenesis and adipocyte studies, and R. Kaufman (SBP Biomedical Discovery Institute) for ER stress/UPR related advice and reagents. Research was supported by NIH, NCI (R01CA211794, R01CA198103, R01CA155120), Superfund Basic Research Program (P42ES010337), and NHMRC (APP112227). J.Y.K. was supported by the AACR-Bayer Hepatocellular Carcinoma Fellowship (16-40-44-KIMJ), Diabetes Research Center Pilot and Feasibility Grant (P30DK063491); and R.G.C. by Boehringer Ingelheim Fonds; D.D. held an ALF ‘Liver Scholar Award’ and Young Investigator Award from the National Childhood Cancer Foundation, ‘CureSearch’.
Footnotes
Publisher's Disclaimer: This is a PDF file of an unedited manuscript that has been accepted for publication. As a service to our customers we are providing this early version of the manuscript. The manuscript will undergo copyediting, typesetting, and review of the resulting proof before it is published in its final citable form. Please note that during the production process errors may be discovered which could affect the content, and all legal disclaimers that apply to the journal pertain.
DECLARATION OF INTERESTS
The authors declare no competing interests.
REFERENCES
- Amarneh B, Matthews KA, and Rawson RB (2009). Activation of sterol regulatory element-binding protein by the caspase Drice in Drosophila larvae. J Biol Chem 284, 9674–9682. [DOI] [PMC free article] [PubMed] [Google Scholar]
- Bobrovnikova-Marjon E, Hatzivassiliou G, Grigoriadou C, Romero M, Cavener DR, Thompson CB, and Diehl JA (2008). PERK-dependent regulation of lipogenesis during mouse mammary gland development and adipocyte differentiation. Proc Natl Acad Sci U S A 105, 16314–16319. [DOI] [PMC free article] [PubMed] [Google Scholar]
- Bouchier-Hayes L, and Green DR (2012). Caspase-2: the orphan caspase. Cell Death Differ 19, 51–57. [DOI] [PMC free article] [PubMed] [Google Scholar]
- Brown MS, and Goldstein JL (1997). The SREBP pathway: regulation of cholesterol metabolism by proteolysis of a membrane-bound transcription factor. Cell 89, 331–340. [DOI] [PubMed] [Google Scholar]
- Caballero F, Fernandez A, De Lacy AM, Fernandez-Checa JC, Caballeria J, and Garcia-Ruiz C (2009). Enhanced free cholesterol, SREBP-2 and StAR expression in human NASH. J Hepatol 50, 789–796. [DOI] [PubMed] [Google Scholar]
- Caussy C, Soni M, Cui J, Bettencourt R, Schork N, Chen CH, Ikhwan MA, Bassirian S, Cepin S, Gonzalez MP, et al. (2017). Nonalcoholic fatty liver disease with cirrhosis increases familial risk for advanced fibrosis. J Clin Invest 127, 2697–2704. [DOI] [PMC free article] [PubMed] [Google Scholar]
- Cheng D, Espenshade PJ, Slaughter CA, Jaen JC, Brown MS, and Goldstein JL (1999). Secreted site-1 protease cleaves peptides corresponding to luminal loop of sterol regulatory element-binding proteins. J Biol Chem 274, 22805–22812. [DOI] [PubMed] [Google Scholar]
- Cheung HH, Lynn Kelly N, Liston P, and Korneluk RG (2006). Involvement of caspase-2 and caspase-9 in endoplasmic reticulum stress-induced apoptosis: a role for the IAPs. Exp Cell Res 312, 2347–2357. [DOI] [PubMed] [Google Scholar]
- Cohen JC, Horton JD, and Hobbs HH (2011). Human fatty liver disease: old questions and new insights. Science 332, 1519–1523. [DOI] [PMC free article] [PubMed] [Google Scholar]
- Colgan SM, Hashimi AA, and Austin RC (2011). Endoplasmic reticulum stress and lipid dysregulation. Expert Reviews in Molecular Medicine 13. [DOI] [PubMed] [Google Scholar]
- Croze EM, and Morre DJ (1984). Isolation of plasma membrane, golgi apparatus, and endoplasmic reticulum fractions from single homogenates of mouse liver. J Cell Physiol 119, 46–57. [DOI] [PubMed] [Google Scholar]
- da Palma JR, Burri DJ, Oppliger J, Salamina M, Cendron L, de Laureto PP, Seidah NG, Kunz S, and Pasquato A (2014). Zymogen activation and subcellular activity of subtilisin kexin isozyme 1/site 1 protease. J Biol Chem 289, 35743–35756. [DOI] [PMC free article] [PubMed] [Google Scholar]
- DeBose-Boyd RA, Brown MS, Li WP, Nohturfft A, Goldstein JL, and Espenshade PJ (1999). Transport-dependent proteolysis of SREBP: relocation of site-1 protease from Golgi to ER obviates the need for SREBP transport to Golgi. Cell 99, 703–712. [DOI] [PubMed] [Google Scholar]
- Espenshade PJ, Cheng D, Goldstein JL, and Brown MS (1999). Autocatalytic processing of site-1 protease removes propeptide and permits cleavage of sterol regulatory elementbinding proteins. J Biol Chem 274, 22795–22804. [DOI] [PubMed] [Google Scholar]
- Farrell GC, and van Rooyen D (2012). Liver cholesterol: is it playing possum in NASH? Am J Physiol Gastrointest Liver Physiol 303, G9–11. [DOI] [PubMed] [Google Scholar]
- Farrell GC, van Rooyen D, Gan L, and Chitturi S (2012). NASH is an Inflammatory Disorder: Pathogenic, Prognostic and Therapeutic Implications. Gut Liver 6, 149–171. [DOI] [PMC free article] [PubMed] [Google Scholar]
- Feldmann HM, Golozoubova V, Cannon B, and Nedergaard J (2009). UCP1 ablation induces obesity and abolishes diet-induced thermogenesis in mice exempt from thermal stress by living at thermoneutrality. Cell Metab 9, 203–209. [DOI] [PubMed] [Google Scholar]
- Fernandez-Alvarez A, Soledad Alvarez M, Cucarella C, and Casado M (2010). Characterization of the human insulin-induced gene 2 (INSIG2) promoter: the role of Ets-binding motifs. J Biol Chem 285, 11765–11774. [DOI] [PMC free article] [PubMed] [Google Scholar]
- Hannah VC, Ou J, Luong A, Goldstein JL, and Brown MS (2001). Unsaturated fatty acids down-regulate srebp isoforms 1a and 1c by two mechanisms in HEK-293 cells. J Biol Chem 276, 4365–4372. [DOI] [PubMed] [Google Scholar]
- Ibrahim SH, Hirsova P, Malhi H, and Gores GJ (2016). Animal Models of Nonalcoholic Steatohepatitis: Eat, Delete, and Inflame. Dig Dis Sci 61, 1325–1336. [DOI] [PMC free article] [PubMed] [Google Scholar]
- Ji C, and Kaplowitz N (2006). ER stress: can the liver cope? J Hepatol 45, 321–333. [DOI] [PubMed] [Google Scholar]
- Krumschnabel G, Sohm B, Bock F, Manzl C, and Villunger A (2009). The enigma of caspase-2: the laymen’s view. Cell Death and Differentiation 16, 195–207. [DOI] [PMC free article] [PubMed] [Google Scholar]
- Lambert JE, Ramos-Roman MA, Browning JD, and Parks EJ (2014). Increased de novo lipogenesis is a distinct characteristic of individuals with nonalcoholic fatty liver disease. Gastroenterology 146, 726–735. [DOI] [PMC free article] [PubMed] [Google Scholar]
- Larter CZ, and Yeh MM (2008). Animal models of NASH: getting both pathology and metabolic context right. J Gastroenterol Hepatol 23, 1635–1648. [DOI] [PubMed] [Google Scholar]
- Le TA, Chen J, Changchien C, Peterson MR, Kono Y, Patton H, Cohen BL, Brenner D, Sirlin C, Loomba R, et al. (2012). Effect of colesevelam on liver fat quantified by magnetic resonance in nonalcoholic steatohepatitis: a randomized controlled trial. Hepatology 56, 922–932. [DOI] [PMC free article] [PubMed] [Google Scholar]
- Lee AH, Scapa EF, Cohen DE, and Glimcher LH (2008). Regulation of hepatic lipogenesis by the transcription factor XBP1. Science 320, 1492–1496. [DOI] [PMC free article] [PubMed] [Google Scholar]
- Lee JN, and Ye J (2004). Proteolytic activation of sterol regulatory element-binding protein induced by cellular stress through depletion of Insig-1. J Biol Chem 279, 45257–45265. [DOI] [PubMed] [Google Scholar]
- Lieber A, Peeters MJ, Gown A, Perkins J, and Kay MA (1995). A modified urokinase plasminogen activator induces liver regeneration without bleeding. Hum Gene Ther 6, 1029–1037. [DOI] [PubMed] [Google Scholar]
- Lodhi IJ, Yin L, Jensen-Urstad AP, Funai K, Coleman T, Baird JH, El Ramahi MK, Razani B, Song H, Fu-Hsu F, et al. (2012). Inhibiting adipose tissue lipogenesis reprograms thermogenesis and PPARgamma activation to decrease diet-induced obesity. Cell Metab 16, 189–201. [DOI] [PMC free article] [PubMed] [Google Scholar]
- Logette E, Le Jossic-Corcos C, Masson D, Solier S, Sequeira-Legrand A, Dugail I, Lemaire-Ewing S, Desoche L, Solary E, and Corcos L (2005). Caspase-2, a novel lipid sensor under the control of sterol regulatory element binding protein 2. Mol Cell Biol 25, 9621–9631. [DOI] [PMC free article] [PubMed] [Google Scholar]
- Loomba R, Seguritan V, Li W, Long T, Klitgord N, Bhatt A, Dulai PS, Caussy C, Bettencourt R, Highlander SK, et al. (2017). Gut Microbiome-Based Metagenomic Signature for Non-invasive Detection of Advanced Fibrosis in Human Nonalcoholic Fatty Liver Disease. Cell Metab 25, 1054–1062 e1055. [DOI] [PMC free article] [PubMed] [Google Scholar]
- Loomba R, Sirlin CB, Ang B, Bettencourt R, Jain R, Salotti J, Soaft L, Hooker J, Kono Y, Bhatt A, et al. (2015). Ezetimibe for the treatment of nonalcoholic steatohepatitis: assessment by novel magnetic resonance imaging and magnetic resonance elastography in a randomized trial (MOZART trial). Hepatology 61, 1239–1250. [DOI] [PMC free article] [PubMed] [Google Scholar]
- Lumeng CN, Bodzin JL, and Saltiel AR (2007). Obesity induces a phenotypic switch in adipose tissue macrophage polarization. J Clin Invest 117, 175–184. [DOI] [PMC free article] [PubMed] [Google Scholar]
- Machado MV, Michelotti GA, Pereira Tde A, Boursier J, Kruger L, Swiderska-Syn M, Karaca G, Xie G, Guy CD, Bohinc B, et al. (2015). Reduced lipoapoptosis, hedgehog pathway activation and fibrosis in caspase-2 deficient mice with non-alcoholic steatohepatitis. Gut 64, 1148–1157. [DOI] [PMC free article] [PubMed] [Google Scholar]
- Mancini M, Machamer CE, Roy S, Nicholson DW, Thornberry NA, Casciola-Rosen LA, and Rosen A (2000). Caspase-2 is localized at the Golgi complex and cleaves golgin-160 during apoptosis. J Cell Biol 149, 603–612. [DOI] [PMC free article] [PubMed] [Google Scholar]
- Mari M, Caballero F, Colell A, Morales A, Caballeria J, Fernandez A, Enrich C, Fernandez-Checa JC, and Garcia-Ruiz C (2006). Mitochondrial free cholesterol loading sensitizes to TNF- and Fas-mediated steatohepatitis. Cell Metab 4, 185–198. [DOI] [PubMed] [Google Scholar]
- Nakagawa H, Umemura A, Taniguchi K, Font-Burgada J, Dhar D, Ogata H, Zhong Z, Valasek MA, Seki E, Hidalgo J, et al. (2014). ER stress cooperates with hypernutrition to trigger TNF-dependent spontaneous HCC development. Cancer Cell 26, 331–343. [DOI] [PMC free article] [PubMed] [Google Scholar]
- O’Reilly LA, Ekert P, Harvey N, Marsden V, Cullen L, Vaux DL, Hacker G, Magnusson C, Pakusch M, Cecconi F, et al. (2002). Caspase-2 is not required for thymocyte or neuronal apoptosis even though cleavage of caspase-2 is dependent on both Apaf-1 and caspase-9. Cell Death Differ 9, 832–841. [DOI] [PubMed] [Google Scholar]
- Osborne TF, and Espenshade PJ (2009). Evolutionary conservation and adaptation in the mechanism that regulates SREBP action: what a long, strange tRIP it’s been. Genes Dev 23, 2578–2591. [DOI] [PMC free article] [PubMed] [Google Scholar]
- Osman OS, Selway JL, Kepczynska MA, Stocker CJ, O’Dowd JF, Cawthorne MA, Arch JR, Jassim S, and Langlands K (2013). A novel automated image analysis method for accurate adipocyte quantification. Adipocyte 2, 160–164. [DOI] [PMC free article] [PubMed] [Google Scholar]
- Owen JL, Zhang Y, Bae SH, Farooqi MS, Liang G, Hammer RE, Goldstein JL, and Brown MS (2012). Insulin stimulation of SREBP-1c processing in transgenic rat hepatocytes requires p70 S6-kinase. Proc Natl Acad Sci U S A 109, 16184–16189. [DOI] [PMC free article] [PubMed] [Google Scholar]
- Oyadomari S, Harding HP, Zhang Y, Oyadomari M, and Ron D (2008). Dephosphorylation of translation initiation factor 2alpha enhances glucose tolerance and attenuates hepatosteatosis in mice. Cell Metab 7, 520–532. [DOI] [PMC free article] [PubMed] [Google Scholar]
- Park CC, Nguyen P, Hernandez C, Bettencourt R, Ramirez K, Fortney L, Hooker J, Sy E, Savides MT, Alquiraish MH, et al. (2017). Magnetic Resonance Elastography vs Transient Elastography in Detection of Fibrosis and Noninvasive Measurement of Steatosis in Patients With Biopsy-Proven Nonalcoholic Fatty Liver Disease. Gastroenterology 152, 598–607 e592. [DOI] [PMC free article] [PubMed] [Google Scholar]
- Pastorino JG, and Shulga N (2008). Tumor necrosis factor-alpha can provoke cleavage and activation of sterol regulatory element-binding protein in ethanol-exposed cells via a caspase-dependent pathway that is cholesterol insensitive. J Biol Chem 283, 25638–25649. [DOI] [PMC free article] [PubMed] [Google Scholar]
- Puri P, Baillie RA, Wiest MM, Mirshahi F, Choudhury J, Cheung O, Sargeant C, Contos MJ, and Sanyal AJ (2007). A lipidomic analysis of nonalcoholic fatty liver disease. Hepatology 46, 1081–1090. [DOI] [PubMed] [Google Scholar]
- Sakai J, Rawson RB, Espenshade PJ, Cheng D, Seegmiller AC, Goldstein JL, and Brown MS (1998). Molecular Identification of the Sterol-Regulated Luminal Protease that Cleaves SREBPs and Controls Lipid Composition of Animal Cells. Molecular Cell 2, 505–514. [DOI] [PubMed] [Google Scholar]
- Sandow JJ, Dorstyn L, O’Reilly LA, Tailler M, Kumar S, Strasser A, and Ekert PG (2014). ER stress does not cause upregulation and activation of caspase-2 to initiate apoptosis. Cell Death Differ 21, 475–480. [DOI] [PMC free article] [PubMed] [Google Scholar]
- Sanjana NE, Shalem O, and Zhang F (2014). Improved vectors and genome-wide libraries for CRISPR screening. Nat Methods 11, 783–784. [DOI] [PMC free article] [PubMed] [Google Scholar]
- Talanian RV, Quinlan C, Trautz S, Hackett MC, Mankovich JA, Banach D, Ghayur T, Brady KD, and Wong WW (1997). Substrate Specificities of Caspase Family Proteases. Journal of Biological Chemistry 272, 9677–9682. [DOI] [PubMed] [Google Scholar]
- Tilg H, and Moschen AR (2010). Evolution of inflammation in nonalcoholic fatty liver disease: the multiple parallel hits hypothesis. Hepatology 52, 1836–1846. [DOI] [PubMed] [Google Scholar]
- Upton JP, Wang L, Han D, Wang ES, Huskey NE, Lim L, Truitt M, McManus MT, Ruggero D, Goga A, et al. (2012). IRE1alpha cleaves select microRNAs during ER stress to derepress translation of proapoptotic Caspase-2. Science 338, 818–822. [DOI] [PMC free article] [PubMed] [Google Scholar]
- Wang X, Zelenski NG, Yang J, Sakai J, Brown MS, and Goldstein JL (1996). Cleavage of sterol regulatory element binding proteins (SREBPs) by CPP32 during apoptosis. EMBO J 15, 1012–1020. [PMC free article] [PubMed] [Google Scholar]
- Weglarz TC, Degen JL, and Sandgren EP (2000). Hepatocyte transplantation into diseased mouse liver. Kinetics of parenchymal repopulation and identification of the proliferative capacity of tetraploid and octaploid hepatocytes. Am J Pathol 157, 1963–1974. [DOI] [PMC free article] [PubMed] [Google Scholar]
- Yang J, Goldstein JL, Hammer RE, Moon YA, Brown MS, and Horton JD (2001). Decreased lipid synthesis in livers of mice with disrupted Site-1 protease gene. Proc Natl Acad Sci U S A 98, 13607–13612. [DOI] [PMC free article] [PubMed] [Google Scholar]
- Yecies JL, Zhang HH, Menon S, Liu S, Yecies D, Lipovsky AI, Gorgun C, Kwiatkowski DJ, Hotamisligil GS, Lee CH, et al. (2011). Akt stimulates hepatic SREBP1c and lipogenesis through parallel mTORC1-dependent and independent pathways. Cell Metab 14, 21–32. [DOI] [PMC free article] [PubMed] [Google Scholar]
- Zeng L, Lu M, Mori K, Luo S, Lee AS, Zhu Y, and Shyy JY (2004). ATF6 modulates SREBP2-mediated lipogenesis. EMBO J 23, 950–958. [DOI] [PMC free article] [PubMed] [Google Scholar]
- Zhang K, Wang S, Malhotra J, Hassler JR, Back SH, Wang G, Chang L, Xu W, Miao H, Leonardi R, et al. (2011). The unfolded protein response transducer IRE1alpha prevents ER stress-induced hepatic steatosis. EMBO J 30, 1357–1375. [DOI] [PMC free article] [PubMed] [Google Scholar]
- Zhang XQ, Xu CF, Yu CH, Chen WX, and Li YM (2014). Role of endoplasmic reticulum stress in the pathogenesis of nonalcoholic fatty liver disease. World J Gastroenterol 20, 1768–1776. [DOI] [PMC free article] [PubMed] [Google Scholar]
Associated Data
This section collects any data citations, data availability statements, or supplementary materials included in this article.