Abstract
Nucleophosmin (NPM1) is among the most frequently mutated genes in acute myeloid leukemia (AML). It is not known, however, how the resulting oncoprotein mutant NPM1 is leukemogenic. To reveal the cellular machinery in which NPM1 participates in myeloid cells, we analyzed the endogenous NPM1 protein interactome by mass spectrometry and discovered abundant amounts of the master transcription factor driver of monocyte lineage differentiation PU.1 (also known as SPI1). Mutant NPM1, which aberrantly accumulates in cytoplasm, dislocated PU.1 into cytoplasm with it. CEBPA and RUNX1, the master transcription factors that collaborate with PU.1 to activate granulomonocytic lineage fates, remained nuclear; but without PU.1, their coregulator interactions were toggled from coactivators to corepressors, repressing instead of activating more than 500 granulocyte and monocyte terminal differentiation genes. An inhibitor of nuclear export, selinexor, by locking mutant NPM1/PU.1 in the nucleus, activated terminal monocytic fates. Direct depletion of the corepressor DNA methyltransferase 1 (DNMT1) from the CEBPA/RUNX1 protein interactome using the clinical drug decitabine activated terminal granulocytic fates. Together, these noncytotoxic treatments extended survival by more than 160 days versus vehicle in a patient-derived xenotransplant model of NPM1/FLT3-mutated AML. In sum, mutant NPM1 represses monocyte and granulocyte terminal differentiation by disrupting PU.1/CEBPA/RUNX1 collaboration, a transforming action that can be reversed by pharmacodynamically directed dosing of clinical small molecules.
Keywords: Hematology, Oncology
Keywords: Epigenetics, Leukemias, Transport
Introduction
Nucleophosmin (NPM1) is one of the most frequently mutated genes in de novo acute myeloid leukemia (AML) (~30% of cases) (1). Only approximately 50% of patients with NPM1-mutated AML can expect long-term survival with current antimetabolite/cytotoxic treatments (2, 3), and there are no “precision” molecular-targeted treatments for this disease, reflecting insufficient understanding of how mutant NPM1 is leukemogenic. Previous discoveries have, however, provided important clues: NPM1 is a nucleus- and nucleolus-enriched phosphoprotein that chaperones and shuttles several chromatin remodeling and ribosome biogenesis proteins between the nucleus and cytoplasm (4–6). The recurrent insertions into NPM1 seen in AML, e.g., NPM1-W288Cfs*12, produce a reading frameshift that eliminates a nucleolar localization sequence and adds a nuclear export sequence; mutant NPM1 protein product thus accumulates aberrantly in cytoplasm (1, 7). This unbalanced export of mutant NPM1 out of nuclei is mediated by the nuclear export protein chromosome region maintenance 1 (CRM1), also known as exportin 1 (XPO1) (5, 8). How such cytoplasmic dislocation of mutant NPM1 confers a growth advantage to myeloid cells, however, is unknown.
These mutations, though highly recurrent in AML, are not seen in cancers of other tissues, suggesting a transforming effect specifically in a myeloid lineage, and other discoveries have clarified where in myeloid differentiation continua NPM1 mutations originate: surface markers were used to sort bone marrow cells from patients with NPM1-mutated AML into hematopoietic stem cells (HSCs) and lineage-committed myeloid progenitors, for subsequent DNA sequencing to document mutations (9–11). Some AML mutations, such as DNMT3A-R882H, were detected in both the HSCs and downstream progenitors (9–11). NPM1 mutations were detected, however, only in the lineage-committed progenitors, wherein they supplemented mutations, e.g., DNMT3A-R882H, propagated from HSCs (9–11). Upon xenotransplantation into immunocompromised mice, the HSCs lacking NPM1 mutations produced phenotypically normal multilineage hematopoiesis, but the lineage-committed progenitors containing mutated NPM1 yielded leukemic hematopoiesis, wherein the cells did not mature and continued to replicate (9–11). Also indicating that NPM1 mutations originate in and transform lineage-committed myeloid progenitors are the following: (i) cytoplasmic NPM1 (mutant-NPM1 protein) is observed in myeloid but not in T or B cells from patients (12); (ii) NPM1-mutated AML cells that overcome interspecies barriers to initiate AML in immunocompromised mice (leukemia-initiating cells or leukemia “stem” cells) have surface phenotypes and transcriptomes of lineage-committed myeloid progenitors, e.g., granulocyte-monocyte progenitors (GMPs) that normally differentiate into granulocyte or monocyte progenitors, then terminally differentiated granulocytes or monocytes (9–11, 13, 14); (iii) bone marrow replacement (85%–97% of cells) in patients with NPM1-mutated AML is by cells with surface phenotypes and transcriptomes of GMPs (15); (iv) mutant Npm1/Flt3–internal tandem duplication (Flt3-ITD) knockin into hematopoietic precursors in mice expands GMPs in particular (16); and (v) AML mutations that precede NPM1 or FLT3 mutations and originate in germline or HSCs (e.g., DNMT3A, RUNX1 mutations) expand lineage-committed daughter cells the most (17, 18), thereby increasing possibilities for mutations to NPM1 and/or FLT3 in these daughter cells (9–11).
Several lines of evidence have thus indicated that NPM1 mutations originate in and transform lineage-committed myeloid progenitors (e.g., GMPs), a cellular context governed by a master transcription factor circuit containing PU.1 (SPI1), CEBPA, and RUNX1 — a few of the approximately 100 transcription factors expressed in cells are masters, collaborating in couplets or triplets to powerfully determine cell fates and functions, as illustrated by their remarkable capacity to convert cells of one lineage into another, even into embryonic stem cells (19). PU.1 cooperates with CEBPA and RUNX1 to command granulomonocytic lineage fates (20–27) — Pu.1-KO mice have reduced granulocytes and no monocytes (28, 29); Cebpa-KO mice have no granulocytes (30); definitive hematopoiesis is abrogated in Runx1-KO mice (31); and ectopic expression of transcription factor ensembles containing PU.1 with CEBPA, or PU.1 with RUNX1, are sufficient to convert even fibroblasts into myeloid precursors/monocytes (29, 32–36). Functional compromise of this master circuit can hence be expected to impede myeloid differentiation, and accordingly, loss-of-function mutations/translocations of CEBPA and RUNX1 are highly recurrent in AML, a disease defined by myeloid differentiation arrest (37–39) (reviewed in ref. 40). Recurrent alterations to PU.1, however, have not been found (41). Here, upon mass-spectrometric analyses of protein-protein interactions of endogenous NPM1 affinity-purified from WT and NPM1-mutated AML cell nuclear and cytoplasmic fractions, we found that both WT and mutant NPM1 interact with PU.1, and that mutant NPM1 dislocates PU.1 into cytoplasm with it. Using several methods, we elucidated how this disruption of the PU.1/CEBPA/RUNX1 master transcription factor hub decouples proliferation from forward differentiation. Importantly, the transforming actions could be reversed by clinical small molecules, a finding that opens the door to noncytotoxic differentiation-restoring treatments for patients with NPM1-mutated AML.
Results
Protein interactions of endogenous NPM1 and mutated NPM1 in nuclei and cytoplasm.
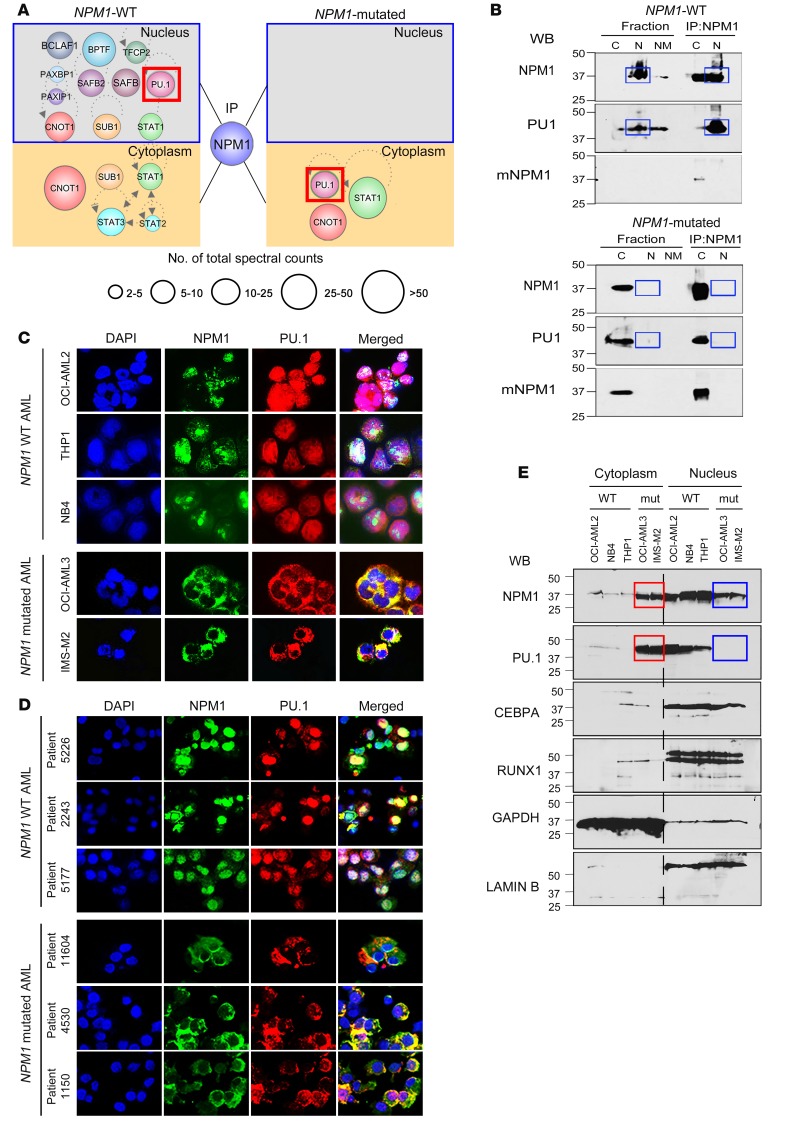
Protein-protein interactions of endogenous NPM1 immunoprecipitated from nuclear and cytoplasmic fractions of NPM1-WT and mutated AML cells were identified using liquid chromatography–tandem mass spectrometry (LC-MS/MS). Separation of cells into fractions was essential, since mutant NPM1 aberrantly accumulates in cytoplasm (1, 7). In nuclei of NPM1-WT AML cells, the NPM1 interactome was enriched for chromatin remodelers, splicing factors, ribosomal proteins, transport proteins, and hematopoietic transcription factors, most notable of which was PU.1 (Figure 1A and Supplemental Table 1; supplemental material available online with this article; https://doi.org/10.1172/JCI97117DS1). NPM1 also coimmunoprecipitated with PU.1 in the reverse pull-down (Supplemental Figure 1). PU.1 is essential for monocyte differentiation, contributes to granulocyte differentiation (23, 42–47), and is considered a master transcription factor, commanding other transcription factors and hundreds of genes to dictate cell fates (32). Critically, the transcription factors identified as interacting with NPM1 in nuclei of NPM1-WT AML cells were observed in cytoplasm of NPM1-mutated AML cells (Figure 1A).
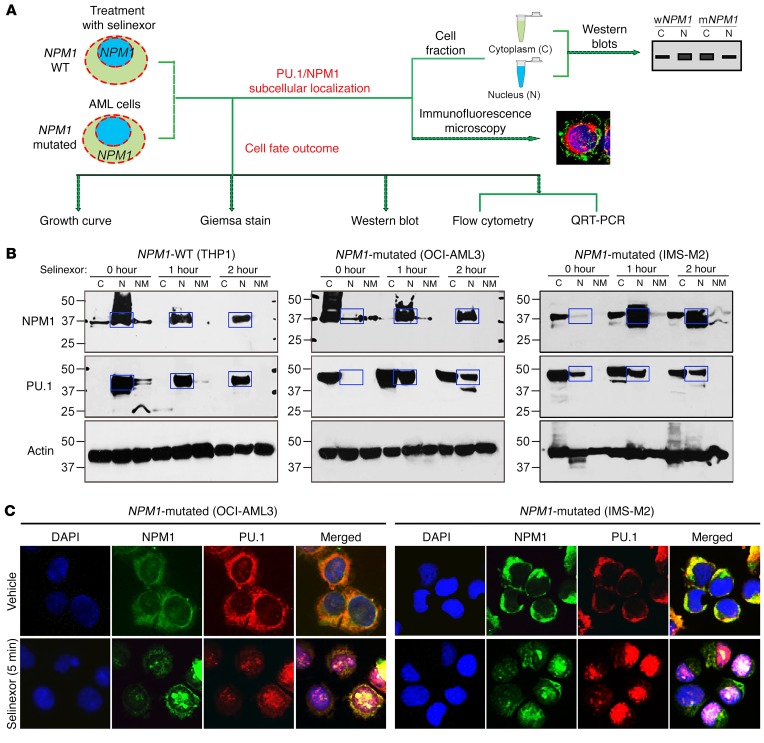
Figure 1. The NPM1 interactome includes the master transcription factor PU.1, which is cytoplasmically dislocated along with mutant NPM1 in NPM1-mutated AML cells.
(A) Transcription factors pulled down with NPM1 and mutant NPM1 (mNMP1) from nuclear (N) and cytoplasmic (C) fractions of WT and NPM1-mutated (mut) AML cells. Endogenous NPM1 and mutant NPM1 were immunoprecipitated from nuclear and cytoplasmic fractions of WT (THP1) and NPM1-mutated AML cells (OCI-AML3), and protein interactions were analyzed by LC-MS/MS. Only interactome transcription factors are shown (additional data in Supplemental Table 1). Individual protein enrichment is presented as total spectral counts, a semiquantitative method for estimating the abundance of a specific protein in the coimmunoprecipitate; larger circle size indicates higher number of total spectral counts for the protein. (B) NPM1 and PU.1 interaction in nuclei of WT AML cells, and in cytoplasm of NPM1-mutated AML cells, was also evident by IP-WB. Blue boxes indicate expected locations of NPM1 and PU.1 if in nuclear fractions of NPM1-mutated AML cells. WB with mutant NPM1-specific antibody also shown. (C) IF for NPM1 and PU.1 in WT (OCI-AML2, THP1, NB4) and NPM1-mutated (OCI-AML3, IMS-M2) AML cell lines. Nuclei were stained with DAPI. Images by Nikon Eclipse 400 microscope; original magnification, ×630. Secondary antibody–alone controls are shown in Supplemental Figure 2. (D) IF for NPM1 and PU.1 in WT and NPM1-mutated AML primary cells from patients’ bone marrow. Images by Nikon Eclipse 400 microscope; original magnification, ×630. Secondary antibody–alone controls are shown in Supplemental Figure 2. (E) WB for PU.1, RUNX1, CEBPA, and NPM1 in nuclear and cytoplasmic fractions of WT and NPM1-mutated AML cell lines. Blue boxes indicate expected locations of NPM1 and PU.1 in nuclear fractions of NPM1-mutated AML cells; red boxes highlight location in cytoplasm of these cells instead.
We corroborated the findings of NPM1 interactions with PU.1, and dislocation of both into cytoplasm when NPM1 is mutated, using 4 additional methods. First, we immunoprecipitated endogenous NPM1 from cell fractions of WT (THP1) and NPM1-mutated AML cells (OCI-AML3) and then performed Western blot (WB) analysis on the immunoprecipitates — these IP-WBs again demonstrated abundant coimmunoprecipitation of PU.1 with WT-NPM1 from nuclei of NPM1-WT AML cells, and with mutant-NPM1 from cytoplasm of NPM1-mutated AML cells (Figure 1B). Second, we used IF microscopy to examine whole cell preparations of 3 NPM1-WT AML cell lines (OCI-AML2, THP1, NB4) and 2 NPM1-mutated AML cell lines (OCI-AML3, IMS-M2); we found NPM1 and PU.1 in nuclei of the 3 NPM1-WT AML cell lines, but both were in cytoplasm of the 2 NPM1-mutated AML cell lines (Figure 1C and Supplemental Figure 2). Third, we used IF to visualize whole cell preparations of primary AML cells from 3 patients with NPM1-WT AML and 3 patients with NPM1-mutated AML; again, both NPM1 and PU.1 were in nuclei of the 3 NPM1-WT AML primary cell populations but in the cytoplasm of the 3 NPM1-mutated AML primary cell populations (Figure 1D and Supplemental Figure 2). Fourth, we performed WB analysis for NPM1, PU.1, and the master transcription factors RUNX1 and CEBPA, which cooperate with PU.1 to drive granulomonocytic differentiation (20–24), in cytoplasmic and nuclear fractions of 3 NPM1-WT AML cell lines (OCI-AML2, NB4, THP1) and 2 NPM1-mutated AML cell lines (OCI-AML3, IMS-M2): PU.1, CEBPA, and RUNX1 were in nuclear fractions of the 3 NPM1-WT AML cell lines, whereas PU.1, but not CEBPA or RUNX1, was instead in cytoplasmic fractions of the 2 NPM1-mutated AML cell lines (Figure 1E).
The master transcription factor expression pattern in AML cells.
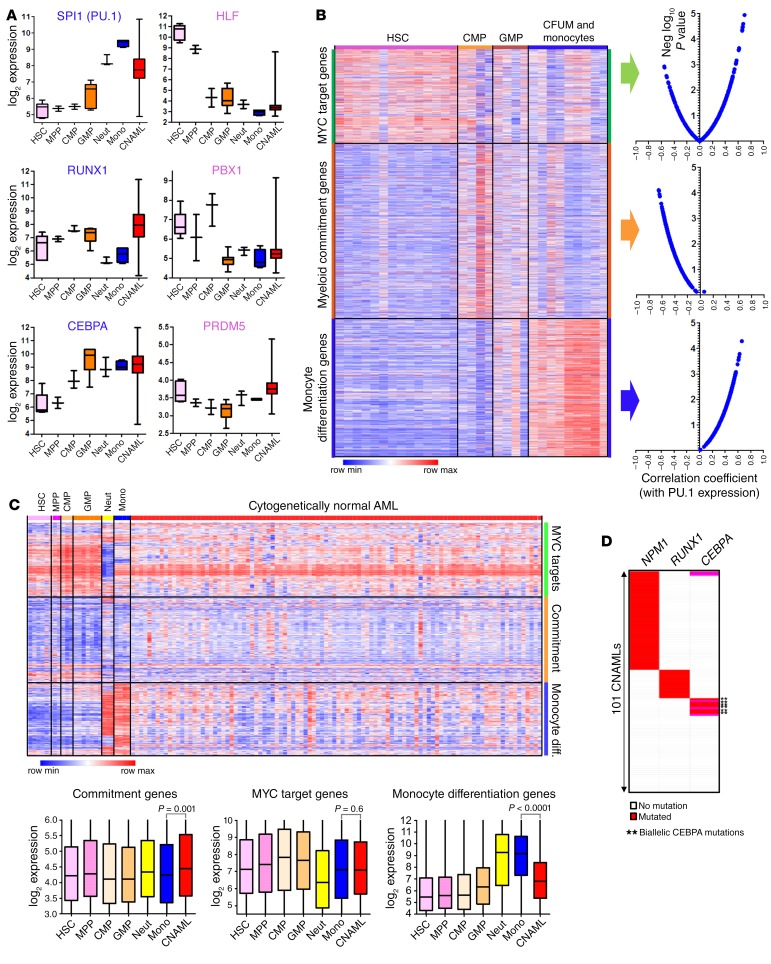
To interpret the pattern of master transcription factor expression in cytogenetically normal AML cells, we related this pattern to that seen at different stages of normal hematopoiesis by using a gene expression resource that we generated and described previously (48, 49). Master transcription factors that produce HSCs — HLF, PBX1, PRDM5 — were expressed in the AML cells at less than one-hundredth the levels seen in normal HSCs but similar to those in normal GMPs, granulocytes, or monocytes (Figure 2A). Master transcription factors that produce granulocytes and monocytes — PU.1, RUNX1, and CEBPA — were also expressed in the AML cells at levels similar to or exceeding (by up to 2-fold) those in normal GMPs/granulocytes/monocytes, levels several-fold higher than in normal HSCs (Figure 2A). The AML cells also clustered with normal GMPs to terminally differentiated granulocytes/monocytes and not HSCs when expression levels of several known hematopoietic master transcription factors (PU.1, RUNX1, CEBPA, IRF8, GFI1, GATA1, GATA2, FLI1, TAL1, LMO2, EBF1, PAX5, HLF, PBX1, PRDM5, and ZFP37AML) were used for unbiased hierarchical clustering (Supplemental Figure 3) (49).
Figure 2. AML cells highly express the PU.1/RUNX1/CEBPA master transcription factor circuit that drives cells to terminal granulomonocytic fates, but the monocyte differentiation program is suppressed.
(A) Expression of granulomonocytic (CEBPA, RUNX1, CEBPA) and HSC (HLF, PBX1, PRDM5) master transcription factors during normal myelopoiesis and in cytogenetically normal AML (CNAML). Gene expression data were integrated and normalized as previously described (48, 49). Boxes indicate median ± IQR, whiskers indicate range. HSCs, n = 6; multipotent progenitors (MPP), n = 2; CMPs, n = 3; GMPs, n = 7; neutrophils (Neut), n = 3; monocytes (Mono), n = 4; CNAML cells, n = 989. (B) Negative (Neg) correlation between myeloid commitment and PU.1 gene expression, but positive correlation between monocyte differentiation and PU.1 gene expression (Pearson’s correlation coefficients). Comparative Marker Selection (Morpheus) analysis of gene expression in HSCs, CMPs, GMPs, CFU monocytes (CFUM), and monocytes from GSE24759 (51) identified ~200 myeloid commitment and ~300 terminal monocytic differentiation genes. MYC target genes identified by others using ChIP-Seq (98), validated by separate analyses (Supplemental Figure 4). Also, Pu.1 localized at monocyte differentiation but not commitment genes by ChIP-Seq (Supplemental Figure 4). Gene sets were also validated in our separate gene expression database of normal hematopoiesis (Supplemental Figure 5). Gene lists are in Supplemental Tables 2–4. (C) CNAML expresses monocyte differentiation genes at levels higher than in normal HSCs, CMPs, or GMPs, but ~4-fold lower than seen in normal monocytes. 100 CNAML shown (truncated from 989 analyzed) (49). P values, 2-sided Mann-Whitney U test. (D) NPM1, RUNX1, and biallelic CEBPA mutations in CNAML cells are highly recurrent but mutually exclusive. n = 101 (analysis of data from The Cancer Genome Atlas [TCGA]).
PU.1 localizes at monocyte terminal differentiation, but not myeloid commitment, genes.
PU.1, RUNX1, and CEBPA, highly expressed in AML cells, would be expected to activate granulomonocytic gene expression programs. We identified 3 such programs: (i) proliferation program: approximately 300 genes identified in the literature as target genes of MYC, the master transcription factor regulator of cell growth and division (50) (Supplemental Table 2 and Figure 2B); we further validated that these genes are MYC targets by analyzing separate public ChIP sequencing (MYC ChIP-Seq) data from Encode (Supplemental Figure 4A); (ii) myeloid-commitment program: approximately 200 genes significantly upregulated in normal common myeloid progenitors (CMPs) and GMPs versus HSCs/granulocytes/monocytes (Supplemental Table 3 and Figure 2B), identified by applying the Comparative Marker Selection algorithm to a public dataset of gene expression at different stages of myelopoiesis (51); and (iii) terminal monocyte differentiation program: more than 300 genes significantly upregulated in normal monocytes versus HSCs/CMPs/GMPs (Supplemental Table 4 and Figure 2B), identified using the same method.
We then validated that the proliferation, commitment, and monocyte differentiation genes discriminated between HSCs, committed myeloid progenitors, and monocytes, in our own separate database of gene expression in normal myelopoiesis (48, 49) (Supplemental Figure 5). Then, using public data on Pu.1 binding to genomic sites in hematopoietic progenitors and monocytes (Pu.1 ChIP-Seq) (52), we noted that Pu.1 localized at the monocyte differentiation but not at the myeloid commitment genes (Supplemental Figure 4B). Accordingly, expression of monocyte differentiation genes and PU.1 positively correlated (correlation coefficients 0.01 to 0.66) (Figure 2B), but expression of commitment genes and PU.1 negatively correlated (correlation coefficients –0.65 to –0.06) (Figure 2B). Proliferation and monocyte differentiation gene expression negatively correlated (Supplemental Figure 6).
The monocyte terminal differentiation program is suppressed in NPM1-mutated AML cells.
Consistent with the similar expression of PU.1, CEBPA, and RUNX1 in AML cells and normal monocytes (Figure 2A), proliferation and myeloid commitment programs were also similarly expressed, in both pattern and magnitude (Figure 2C). Monocyte terminal differentiation genes, however, were markedly suppressed in the AML cells, with levels approximately 4-fold lower than in normal monocytes (Figure 2, A and C). Repression of the monocyte terminal differentiation program despite PU.1/CEBPA/RUNX1 expression similar to or higher than in monocytes/granulocytes (Figure 2A) implies at least partial loss of function in this master transcription factor circuit — shown previously to occur by mutated or translocated RUNX1 and biallelically mutated CEBPA (37–39), and shown to occur here via the actions of mutant NPM1. Notably, RUNX1, biallelic CEBPA, and NPM1 mutations, although very frequent in AML, are mutually exclusive (Figure 2D).
Mutant NPM1 dislocates PU.1 into cytoplasm, and Pu.1 nuclear relocation transitions proliferative precursors to terminal monocytic fates.
We then used 2 separate model systems to show that (i) mutant NPM1 causes cytoplasmic dislocation of PU.1; and to reaffirm that (ii) Pu.1 nuclear relocation in a Pu.1-null myeloid context is sufficient to suppress key commitment/precursor genes, activate key monocyte terminal differentiation genes, and trigger terminal monocytic fates.
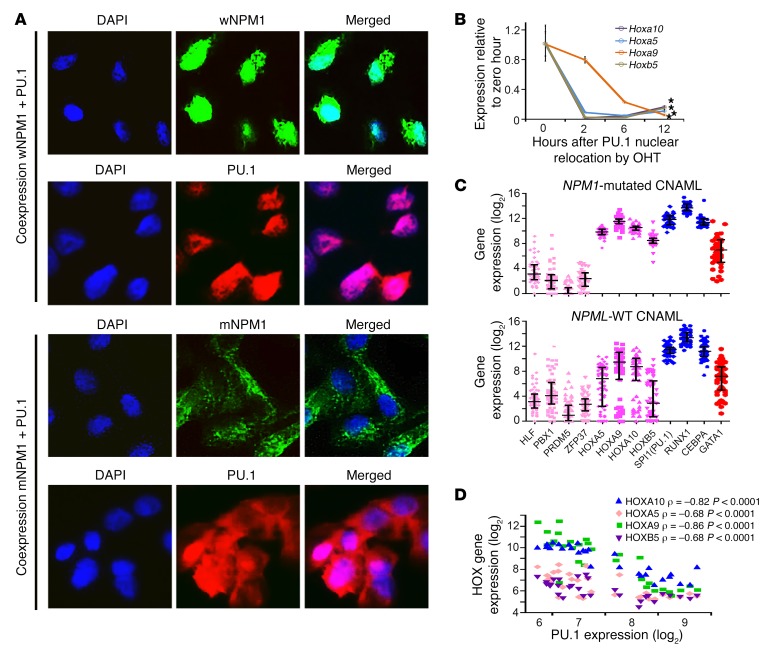
The first model was HEK293 cells cotransfected with expression vectors for NPM1 and PU.1, or mutant NPM1 and PU.1. In the cells cotransfected to express NPM1 and PU.1, both NPM1 and PU.1 were almost exclusively localized in the nucleus, as expected (Figure 3A). However, in the cells cotransfected to express mutant NPM1 and PU.1, both mutant NPM1 and PU.1 were mostly in the cytoplasm (Figure 3A). These data suggest that mutant NPM1 is responsible for the dislocation of PU.1 into cytoplasm.
Figure 3. Two models were used to show that mutant NPM1 dislocates PU.1 into cytoplasm, and that Pu.1 nuclear relocation in Pu.1-null myeloid precursors represses key precursor genes (e.g., Hoxa9) and activates terminal monocytic fates.
(A) Mutant NPM1, but not WT NPM1 (wNPM1), translocates PU.1 into cytoplasm. HEK293 cells were cotransfected with expression vectors for NPM1 and PU.1 or mutated NPM1 (exon 12 TCTG insertion) and PU.1. After staining with anti-NPM1 and anti-PU1 antibodies, IF was used to evaluate cellular location of NPM1 and PU.1. Images by Nikon Eclipse 400 microscope; original magnification, ×630. (B) Addition of estrogen (OHT) translocates Pu.1 into the nucleus in Pu.1–/– myeloid precursors retrovirally transduced to express Pu.1-ER (53), activating terminal monocytic fates (Supplemental Figure 7) and suppressing Hox gene expression. Hox gene expression measured by quantitative real-time PCR (QRT-PCR); mean ± SD, 3 independent experiments. *P < 0.01 (significant after Bonferroni’s correction), 2-sided t test, 12 hours versus 0 hours. (C) Master transcription factor and HOX gene expression in NPM1-mutated and WT AML cells. Gene expression by RNA-Seq, primary AML bone marrow cells (The Cancer Genome Atlas). (D) Negative correlation between HOX and PU.1 gene expression in normal myelopoiesis. Gene expression in normal hematopoietic hierarchy from GSE24759 (HSCs, n = 14; CMPs, n = 4; GMPs, n = 4; CFUM, n = 4; monocytes, n = 5) (51). Pearson’s correlation coefficients.
The second model was Pu.1-KO (Pu.1–/–) murine hematopoietic precursors that were retrovirally transduced to express Pu.1 fused with the estrogen receptor (Pu.1-ER) and generated, as described previously (53): Pu.1-ER is in the cytoplasm unless estrogen is added, which causes its translocation into the nucleus. Reproducing previous data, Pu.1-ER translocation from cytoplasm into nuclei (Supplemental Figure 7A) activated key monocyte differentiation genes (e.g., the macrophage colony-stimulating factor receptor [MCSFR]) (Supplemental Figure 7B), induced morphologic changes in monocyte differentiation (Supplemental Figure 7C), and terminated proliferation (Supplemental Figure 7D). We showed previously that knockdown of Runx1 prevents the Pu.1-driven terminal monocytic differentiation (17, 20, 21). Thus, Pu.1 nuclear restoration, in a myeloid context containing Runx1, transitions indefinitely replicating precursors to terminally differentiated monocytes.
The Pu.1–/– cells modeled another characteristic of NPM1-mutated AML cells: high expression of homeobox genes (e.g., Hoxa9, Hoxb5) (Figure 3, B and C). During normal myelopoiesis, there is a strong negative correlation between HOX gene and PU.1 expression (Pearson’s correlation coefficients –0.68 to –0.86, P < 0.001) (Figure 3D), but, incongruously, the AML cells expressed both simultaneously at high levels (Figure 3C). The high HOX gene expression in NPM1-mutated AMLs does not appear to be driven by the master transcription factors that produce HSCs, since levels of these master transcription factors (HLF, PBX1, PRDM5) were approximately one-thousandth the levels of PU.1/RUNX1/CEBPA (Figure 3C). Instead, there was rapid suppression of Hoxa5, Hoxa9, Hoxa10, and Hoxb5 upon Pu.1-ER translocation into nuclei of Pu.1–/– cells (Figure 3B), suggesting that PU.1 cytoplasmic dislocation also can explain this feature of NPM1-mutated AMLs.
Nuclear retention of mutant NPM1 and PU.1 triggers monocytic differentiation.
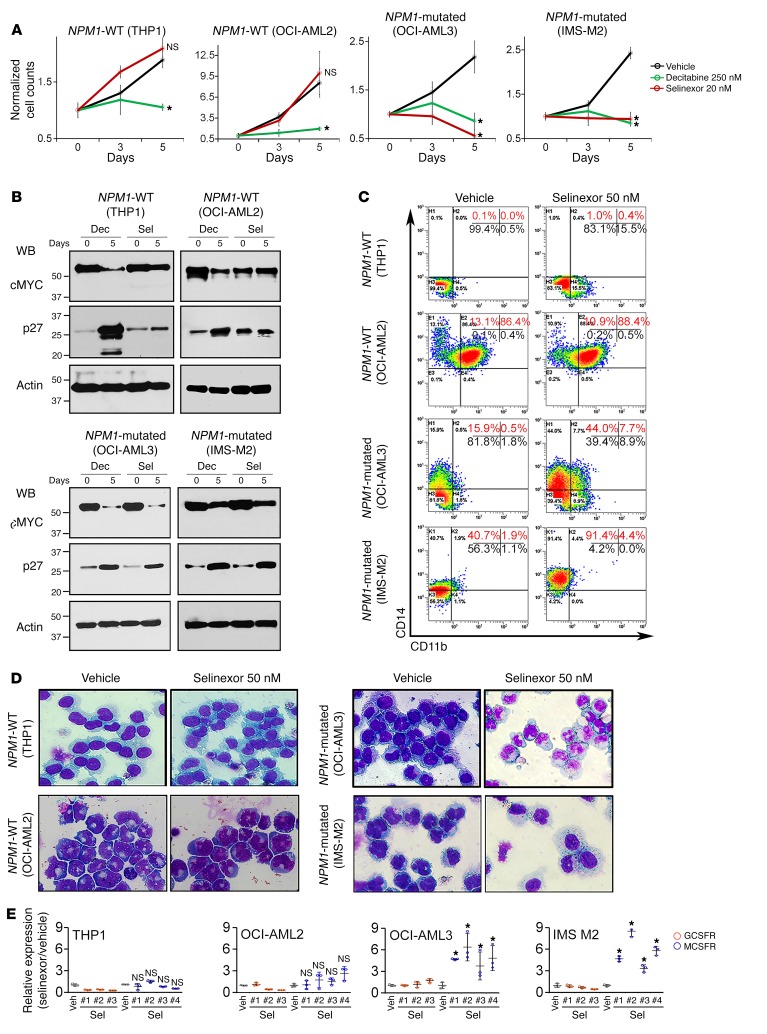
Protein macromolecules such as NPM1 require transport factors to enter (importins) and exit (exportins) nuclei. A specific exportin, XPO1 (CRM1), has been shown to mediate nuclear export of mutant NPM1 (5), and consistent with this finding, XPO1 was the major exportin we found in the NPM1/mutant NPM1 protein interactomes (Supplemental Table 1). XPO1 interactions with transported cargo can be inhibited by the small molecule selective inhibitor of nuclear export (SINE) drug selinexor (KPT330) (54). Treatment of NPM1-mutated AML cells (OCI-AML3 and IMS-M2) with 10–20 nM selinexor rapidly relocated both mutant NPM1 and PU.1 to nuclei, as shown both by WBs of nuclear and cytoplasmic fractions (Figure 4, A and B) and by IF (Figure 4C). The selinexor-induced nuclear retention of PU.1 terminated NPM1-mutated AML cell proliferation (Figure 5A) by monocytic differentiation, as shown by downregulated protein levels of MYC (the master transcription factor regulator of cell growth and division) (Figure 5B), upregulated protein levels of p27/CDKN1B (a cyclin-dependent kinase inhibitor that mediates terminal differentiation) (Figure 5B), upregulated expression of the monocyte lineage marker CD14 and MCSFR (CSF1R) (Figure 5, C and D) but not expression of the granulocyte lineage marker CD11b or the granulocyte colony-stimulating factor receptor (GCSFR, CSF3R) (Figure 5, C and D), and morphologic changes of monocyte differentiation (bean-shaped nuclei, lower nuclear/cytoplasmic ratio) (Figure 5E and Supplemental Figure 8), without inducing early apoptosis (no increase in annexin V staining) (Supplemental Figure 9). Thus, selinexor induced a constellation of events in NPM1-mutated AML cells consistent with terminal monocytic differentiation. The same treatment did not induce differentiation of NPM1-WT AML cells (THP1, OCI-AML2) (Figure 5, A–E).
Figure 4. The nuclear export inhibitor selinexor sequestered both mutant NPM1 and PU.1 in nuclei of NPM1-mutated AML cells.
(A) Experiment schema. Cell fate outcomes are shown in Figure 5. (B) Selinexor rapidly relocalized mutant NPM1 and much of PU.1 into nuclei of NPM1-mutated AML cells. WT (THP1) and NPM1-mutated AML cells (OCI-AML3, IMS-M2) were treated with 20 nM selinexor and cell fractions (C, cytoplasm; N, nucleus; NM, nuclear matrix ) were evaluated by WB. Blue boxes show expected location of NPM1 and PU.1 in nuclear fractions. (C) IF for NPM1 and PU.1 in vehicle- versus selinexor-treated NPM1-mutated AML cells. DAPI was used to stain for nuclei. Images by Nikon Eclipse 400 microscope; original magnification, ×630.
Figure 5. Nuclear retention of mutant NPM1 and PU.1 by selinexor triggered terminal monocytic differentiation of NPM1-mutated, but not WT, AML cells.
(A) Cell counts of NPM1-mutated (OCI-AML3, IMS-M2) and NPM1-WT (OCI-AML2, THP1) AML cells. Decitabine was used to deplete DNMT1. Cell counts by automated counter. Mean ± SD of 3 independent experiments. *P < 0.01 (significant after Bonferroni’s correction), t test, 2-sided, selinexor or decitabine versus vehicle on day 5; NS, P > 0.025. (B) Protein levels of MYC (master transcription factor driver of proliferation) and p27/CDKN1B (cyclin-dependent kinase inhibitor mediating cell cycle exits by differentiation). WB. Dec, decitabine; Sel, selinexor. (C) Monocyte lineage marker CD14 and granulocyte lineage marker CD11b expression. Flow cytometry. (D) Cell morphology, day 5. Giemsa stain. Leica DMR microscope; original magnification, ×630. Quantified in Supplemental Figure 8. (E) MCSFR/CSF1R or GCSFR/CSF3R expression. QRT-PCR, multiple primer sets were used for each gene (#1–3/4). Mean ± SD 3 independent experiments. *P < 0.01 (significant after Bonferroni’s correction), 2-sided t test, selinexor versus vehicle (Veh); NS, P > 0.0125.
Low-dose selinexor in a patient-derived xenotransplant model of dual NPM1/FLT3-mutated AML.
Immunodeficient (NSG) mice were xenotransplanted with NPM1/FLT3-mutated primary AML cells (a subset of NPM1-mutated AMLs with poor prognoses) (55). After confirmation of bone marrow AML engraftment to at least 20% in 3 randomly selected mice, mice were randomized to treatment with vehicle or selinexor (2 mg/kg) 4 times per week (Supplemental Figure 10A). The 2-mg/kg dose was expected to produce plasma Cmax of approximately 200 nM based on previous pharmacokinetic studies and was ~10-fold lower than the usual dose of more than 20 mg/kg used in mice for nonspecific cytotoxic intent (54, 56, 57). On approximately day 75, vehicle-treated mice demonstrated signs of distress, and the experiment was terminated for analysis: selinexor-treated mice had no signs of distress and significantly lower bone marrow AML burden (~70% human CD45+ cells) than vehicle-treated mice (>95% human CD45+ cells), with preservation of some murine hematopoiesis, as shown by blood counts, bone marrow flow cytometry for murine CD45+ cells, and morphology (Supplemental Figure 10, B–G). There was also a substantial AML burden in the spleens of vehicle-treated mice, with a more than 50-fold increase in splenic weight versus normal NSG spleen (~0.018 g) (extramedullary AML features in monocytic AMLs); this burden was decreased approximately 3-fold after treatment with selinexor (Supplemental 10D). IF confirmed restoration of some PU.1 into nuclei in AML cells from selinexor- versus vehicle-treated mice (Supplemental Figure 10E). Monocytic differentiation induction of the AML cells was evident by flow cytometry for human CD14 and by inspection of Giemsa-stained bone marrow cytospin preparations (Supplemental Figure 10, F and G).
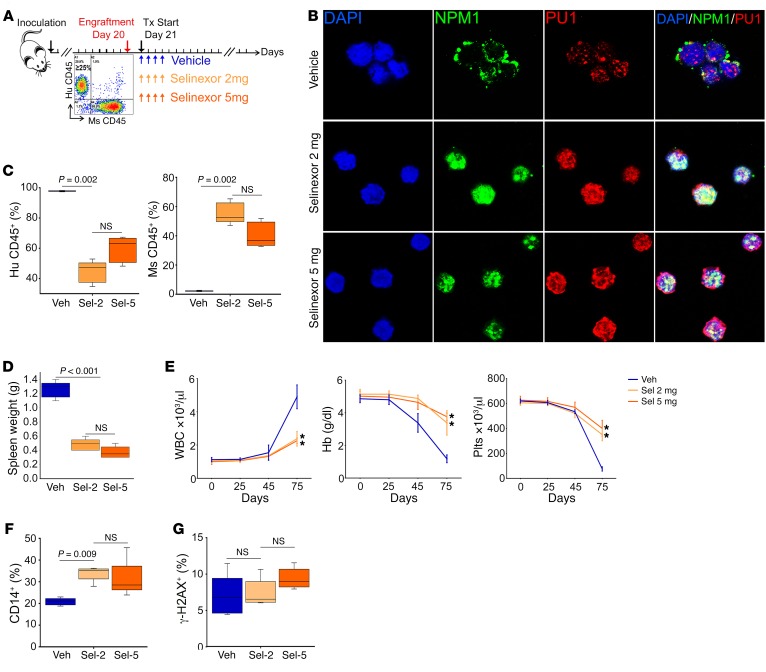
Although there was substantial reduction in spleen AML burden, reduction in bone marrow AML burden was modest. We therefore examined whether the disconnect between in vitro and in vivo potency reflected pharmacologic/pharmacodynamic factors that could be overcome with a higher but still noncytotoxic dose of selinexor, by comparing the effects of 2 mg/kg and 5 mg/kg selinexor (Figure 6A). Consistent with a molecularly targeted effect that was saturated with a dose of 2 mg/kg, the higher dose of 5 mg/kg was not more efficacious: the two doses produced similar restorations of PU.1 into nuclei in bone marrow AML cells (Figure 6B); 2 mg/kg selinexor reduced bone marrow AML burden from more than 95% to approximately 45% (Figure 6C), while 5 mg/kg reduced it to approximately 65% (the difference was not statistically significant); and both doses produced a greater than 2-fold reduction in spleen AML burden versus vehicle (the difference was not statistically significant) (Figure 6D). A noncytotoxic, differentiation-based mode of action for both doses was indicated by significant and similar approximately 2-fold increase in the monocyte lineage differentiation marker CD14 (Figure 6F) and no increase in expression of the apoptosis/DNA-damage marker γ-H2AX in bone marrow AML cells (Figure 6G), and preservation of platelet and hemoglobin levels while receiving active therapy for approximately 50 days. There were eventual declines in platelets and hemoglobin, but these were driven by AML progression, as demonstrated by concurrent increases in circulating myeloblasts (Figure 6E).
Figure 6. The differentiation-restoring effect of selinexor in vivo was saturated at a dose of 2 mg/kg.
2 mg/kg selinexor (Sel-2) was compared with 5 mg/kg (Sel-5) in a patient-derived xenotransplant model of dual NPM1/FLT3-mutated AML. (A) Experiment schema. After confirmation of bone marrow AML engraftment to ≥20% in 3 randomly selected mice, remaining mice were randomized to vehicle, 2 mg/kg selinexor, or 5 mg/kg selinexor, by oral gavage 4 times per week starting on day 21 (n = 5/group). Treatment (Tx) continued until appearance of signs of distress in vehicle-treated mice (day 75), when the experiment was terminated for analyses. *P < 0.01. (B) IF for PU.1 and NPM1 location in bone marrow AML cells. DAPI was used to stain for nuclei. Images by Leica SP8 inverted confocal microscope; original magnification, ×630. (C) Bone marrow AML burden. Flow cytometry for human (Hu) CD45+ (AML) and murine (Ms) CD45+ (normal) cells. Median ± IQR. P values, Mann-Whitney U test, 2-sided. Significance after Bonferroni’s correction was P < 0.025. (D) Spleen AML burden. Median ± IQR. P values, 2-sided Mann-Whitney U test. Normal NSG spleen weight is ~0.018 g. (E) Serial blood counts. Increasing WBC were circulating myeloblasts. Tail vein phlebotomy, blood counts by HemaVet. Mean ± SD. *P < 0.01 (significant after Bonferroni’s correction), Sel-2 or Sel-5 versus vehicle on day 75, 2-sided t test. (F) CD14 monocyte-lineage differentiation marker expression on bone marrow AML cells. Flow cytometry. Median ± IQR. P values, Mann-Whitney U test, 2-sided. Significance after Bonferroni’s correction was P < 0.025. (G) γ-H2AX apoptosis/DNA damage marker expression on bone marrow AML cells. Flow cytometry. Median ± IQR; P values, 2-sided Mann-Whitney U test (NS, P > 0.025). Hb, hemoglobin; Plts, platelets.
In short, a higher dose of the nuclear export inhibitor did not appear to be the solution to improving the differentiation-restoring benefit in NPM1/FLT3-mutated AML in vivo, the genetic subset of NPM1-mutated AML that accounts for most clinical refractory/relapsed disease.
Coregulator interactions of CEBPA and RUNX1 and repression of granulocyte differentiation genes.
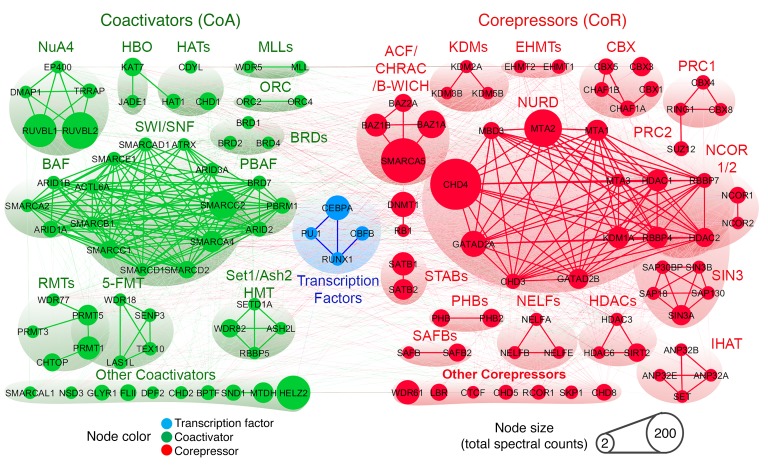
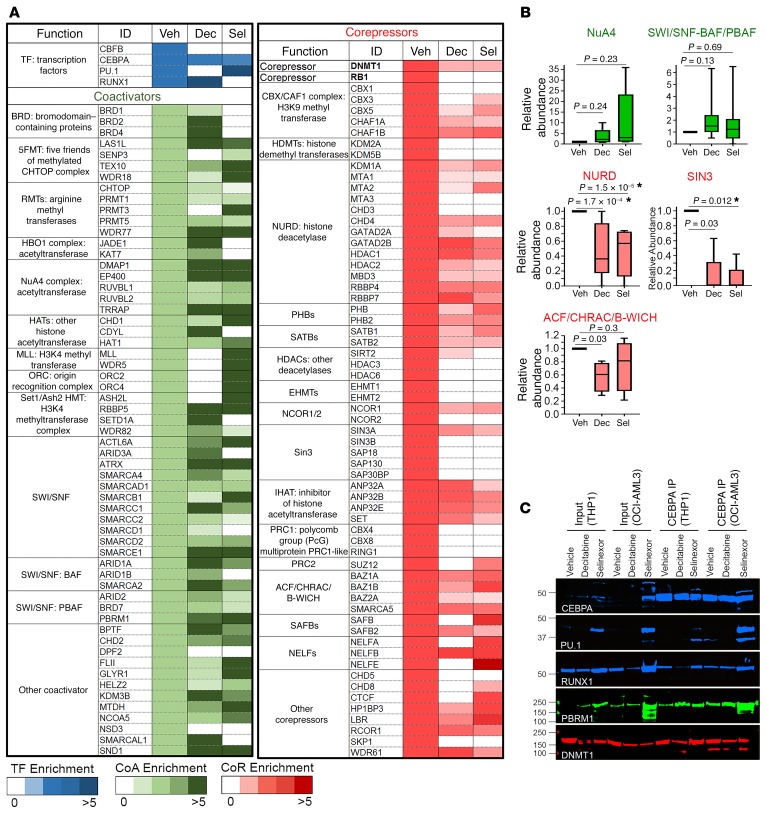
We therefore queried whether the master transcription factors CEBPA and RUNX1, which remained nuclear in NPM1-mutated AML cells, could be used for a complementary approach to differentiation restoration. CEBPA and RUNX1 are expected to activate granulocytic fates (25, 27); however, the granulocyte differentiation program, like the monocyte differentiation program, is suppressed in AML versus normal granulocytes (Supplemental Figure 11 and Supplemental Table 5). To investigate how, we examined the coregulator interactions of nuclear CEBPA and RUNX1 in NPM1-mutated AML cells using affinity purification–LC-MS/MS and WB analysis. The CEBPA and RUNX1 protein interactomes were enriched for coregulators that repress transcription (corepressors, e.g., DNMT1, NURD, SIN3A complex, CBX) over coactivators that activate genes (e.g., SWI/SNF, NUA4, SETD1A) (Figure 7, Supplemental Figure 12, and Supplemental Tables 6 and 7). We showed previously a mechanism by which PU.1 synergizes with its master transcription factor partners: the transcription regulating domains of PU.1 and RUNX1 interacted to exclude corepressors and recruit coactivators (20, 21). In keeping with this motif, PU.1 introduction into the CEBPA/RUNX1 interactomes by selinexor switched CEBPA and RUNX1 interactions in NPM1-mutated AML cells from corepressors (e.g., DNMT1, NURD, SIN3A) to coactivators (e.g., SWI/SNF, NUA4, SETD1A), as shown by IP–LC-MS/MS and by IP-WB (Figure 8 and Supplemental Figure 12).
Figure 7. Coregulator interactions of nuclear CEBPA in NPM1-mutated AML cells.
Endogenous CEBPA was affinity purified from nuclear fractions of OCI-AML3 cells; coregulator (coactivator and corepressor) interactions were analyzed by LC-MS/MS and WB; and suggested CEBPA interactions in this context were biased toward corepressors. Quantification in Supplemental Table 6.
Figure 8. Impact of PU.1 nuclear retention by selinexor, or DNMT1 depletion by decitabine, on coregulator interactions of nuclear CEBPA in NPM1-mutated AML cells.
20 nM selinexor or 0.25 μM decitabine was added to OCI-AML3 cells at 0 and 24 hours, and cells were harvested at 48 hours. Endogenous CEBPA was affinity purified from nuclear fractions, and coregulator interactions were analyzed by LC-MS/MS and WB. Quantification in Supplemental Table 6. (A) Depletion of the corepressor DNMT1 by decitabine, or nuclear retention of PU.1 by selinexor, rebalanced toward coactivators. (B) Relative abundances of coregulator complexes with vehicle versus treatments. The individual proteins constituting the complexes are listed in A. Median ± IQR. *P < 0.0125 (significant after Bonferroni’s correction), Mann-Whitney U test, 2-sided. (C) CEBPA IP-WB to show coimmunoprecipitating master transcription factors (PU.1, RUNX1), a coactivator (PBRM1), and a corepressor (DNMT1). NPM1-mutated (OCI-AML3) and WT (THP1) AML cells.
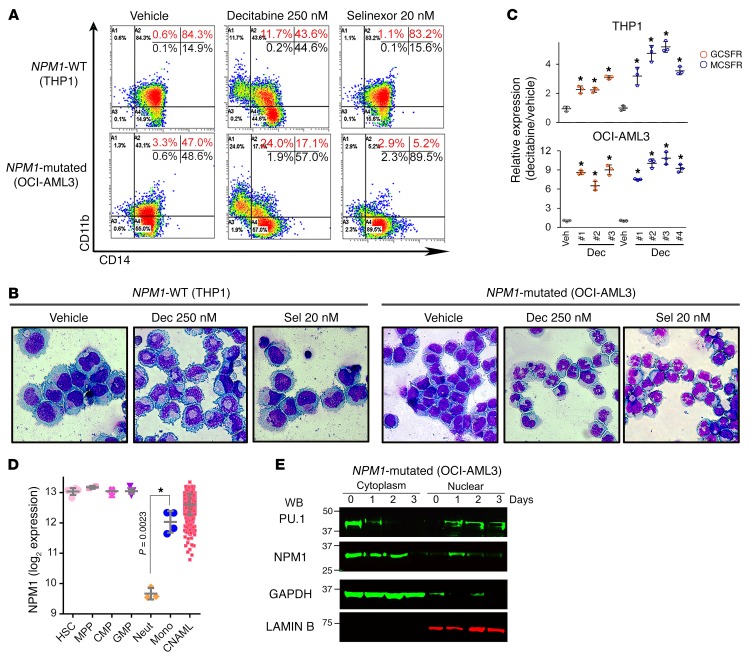
We then evaluated use of the clinical small molecule decitabine to directly deplete the corepressor enzyme and scaffold protein DNMT1 from the CEBPA/RUNX1 interactomes. DNMT1 depletion reconfigured CEBPA/RUNX1 interactions from corepressors to coactivators (Figure 8 and Supplemental Figure 12). This activated terminal granulocytic fates: CD11b was upregulated (~20% of cells) (Figure 9A), granulocytic nuclear segmentation was induced in many cells (Figure 9B and Supplemental Figure 8), GCSFR was upregulated more than 6-fold (Figure 9C), MYC was downregulated (Figure 5B), p27/CDKN1B was upregulated (Figure 5B), and proliferation terminated (Figure 5A). Moreover, NPM1 expression decreases naturally during granulocyte lineage differentiation (Figure 9D), and there was a progressive decrease in NPM1/mutant NPM1 protein levels, progressive increase in PU.1 nuclear retention (Figure 9E and Supplemental Figure 13), CD14 upregulation in approximately 60% of the cells (Figure 9A), monocytic morphology changes in many cells (Figure 9B and Supplemental Figure 8), and a more than 6-fold upregulation of MCSFR (Figure 9C).
Figure 9. Depletion of DNMT1 from the CEBPA/RUNX1 interactome by decitabine (0.25 μM/day, twice) induced granulocyte/monocyte differentiation, while PU.1 nuclear retention by selinexor (20 nM/day, 5 times) induced monocytic differentiation of NPM1-mutated AML cells (OCI-AML3).
THP1 cells are NPM1-WT AML cells with high nuclear content of both PU.1 and CEBPA. (A) Expression of the granulocyte lineage marker CD11b and the monocyte lineage marker CD14 in NPM1-mutated or WT AML cells treated with decitabine or selinexor. Flow cytometry on day 5. (B) Cell morphology, day 5. Giemsa stain. Leica DMR microscope; original magnification, ×630. Wider-field version shown in Supplemental Figure 8. (C) Expression of the GCSFR (CSF3R) and MCSFR. QRT-PCR, day 5. Mean ± SD; 3 independent experiments. Results with selinexor are shown in Figure 5. *P < 0.01 (significant after Bonferroni’s correction), Decitabine versus vehicle, 2-sided t test. (D) NPM1 mRNA expression during normal myelopoiesis. Gene expression data were integrated and normalized as previously described (48, 49). Mean ± SD; P value, 2-sided t test. (E) NPM1 decreased, and nuclear PU.1 increased, after decitabine treatment. Serial WBs of nuclear and cytoplasmic fractions of NPM1-mutated AML cells (OCI-AML3) after treatment with 250 nM decitabine on days 0 and 1 (additional data in Supplemental Figure 13).
Combination differentiation-restoring therapy.
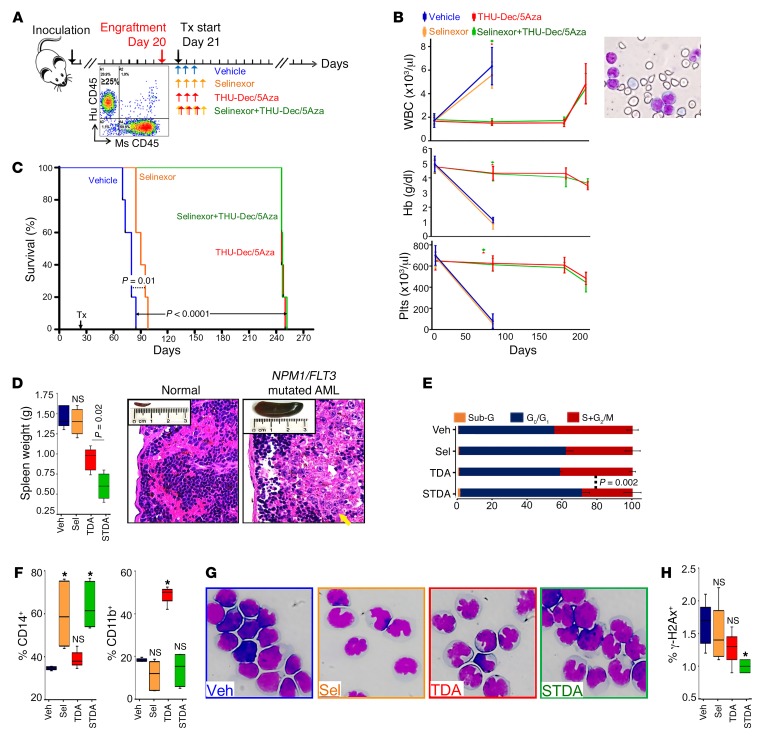
Immunodeficient mice were xenotransplanted with NPM1/FLT3-mutated primary AML cells (55). After bone marrow AML engraftment to at least 20% was confirmed in 3 randomly selected mice (Figure 10A), mice were randomized to treatment with (i) vehicle as control; (ii) nuclear export inhibition by 2 mg/kg selinexor by oral gavage 4 times per week; (iii) DNMT1 depletion by 0.1 mg/kg decitabine subcutaneously 3 times per week alternating with 1 mg/kg 5-azacytidine subcutaneously 3 times per week, with both drugs combined with 10 mg/kg tetrahydrouridine administered intraperitoneally to inhibit their otherwise rapid degradation in vivo by cytidine deaminase (a regimen optimized for noncytotoxic DNMT1 depletion in vivo, as previously described; refs. 58–63); and (iv) combination nuclear export–inhibiting and DNMT1-depleting treatment (Figure 10A). Mice were closely followed and euthanized if there were signs of distress — blood counts at time of distress confirmed onset of anemia, thrombocytopenia, and circulating AML (peripheral myeloblasts) (Figure 10B). Nuclear export inhibition alone delayed distress onset by 10 days versus vehicle, a significant (P = 0.01, log-rank) but limited benefit (Figure 10C). DNMT1 depletion and combination nuclear export inhibition/DNMT1 depletion, however, extended distress-free survival by more than 160 days versus vehicle in all the treated mice (Figure 10C). At euthanasia, there were similar, more than 90% bone marrow AML burdens in all treatment groups (Supplemental Figure 14); however, spleen AML burdens were decreased by a significantly greater extent by combination nuclear export inhibition/DNMT1 depletion versus the other treatment groups (~2-fold versus DNMT1 depletion alone, P = 0.02; Figure 10D) (extramedullary AML is a feature of monocytic AMLs, and spleen weights were >80-fold higher in vehicle-treated mice than normal NSG spleen). Growth fractions of bone marrow AML cells (SG2/M, cell cycle distribution measured by flow cytometry) were also smallest with combination treatment versus DNMT1 depletion (mean 29.4% versus 41.9%, P = 0.002) (Figure 10E and Supplemental Figure 15). A noncytotoxic differentiation-based mechanism of action was indicated in all treatment groups: with nuclear export inhibition by approximately 2-fold upregulation of the monocyte lineage marker CD14 (Figure 10F and Supplemental Figure 16) and monocytoid appearance of bone marrow AML cells (Figure 10G); with DNMT1 depletion by greater than 2-fold upregulation of granulocyte lineage marker CD11b or CD15 (Figure 10F and Supplemental Figure 17) and abnormal but recognizable nuclear segmentation (Figure 10G); with combination treatment by even greater monocytic differentiation with more than 2-fold upregulation of CD14 (Figure 10F and Supplemental Figure 16) and monocytic morphology of bone marrow AML cells (Figure 10G); with all treatments by preservation of normal blood counts on active therapy for more than 8 months (Figure 10B), no increase in expression of the apoptosis/DNA damage marker γ-H2AX (Figure 10H and Supplemental Figure 18), and trivial sub-G1 fraction in bone marrow AML cells at time of distress (Figure 10E and Supplemental Figure 15).
Figure 10. Combination differentiation-restoring treatment in vivo.
(A) Experiment schema. Immunodeficient mice were xenotransplanted with NPM1/FLT3-mutated primary AML cells (55). After bone marrow engraftment to ≥20% AML was confirmed in 3 randomly selected mice, mice were randomly assigned to treatment with (i) vehicle; (ii) nuclear export inhibition — 2 mg/kg selinexor 4 times per week by oral gavage; (iii) DNMT1 depletion — 0.1 mg/kg decitabine, 3 times per week alternating with 1 mg/kg 5-azacytidine 3 times per week subcutaneously, combined with THU 10 mg/kg intraperitoneally (to inhibit in vivo degradation of decitabine/5-azacytidine (Dec/5Aza) by cytidine deaminase); or (iv) combination nuclear export inhibition/DNMT1 depletion. Mice were euthanized after appearance of signs of distress. (B) Serial blood counts. The increase in WBC was due to myeloblasts (right). Tail vein phlebotomy; blood counts by HemaVet. Mean ± SD. (C) Survival (time to distress). P values, log-rank test. (D) Spleen AML burden at euthanasia. Median ± IQR. NS, P > 0.01, 2-sided Mann-Whitney U test. Photos show a spleen from a normal NSG mouse versus a vehicle-treated mouse, with H&E-stained spleen sections showing AML infiltration (yellow arrow) and necrosis (white arrow) (original magnification, ×400). Normal NSG spleen weight is ~0.018 g. (E) Cell cycle distribution of marrow AML cells at euthanasia. Mean ± SD for percentage of cells in each cell cycle phase. P value, unpaired t test 2-sided. Raw data are shown in Supplemental Figure 14. (F) Monocyte (CD14) and granulocyte (CD11b) lineage differentiation marker expression in marrow AML cells at euthanasia. Flow cytometry. Median ± IQR. *P < 0.01 (significant after Bonferroni’s correction), NS, P > 0.01, Mann-Whitney U test, 2-sided. Raw data are shown in Supplemental Figures 15 and 16. (G) Morphology of marrow AML cells at euthanasia. Giemsa stain. Leica DMR microscope; original magnification, ×630. (H) Apoptosis/DNA damage marker γ-H2AX expression in marrow AML cells at euthanasia. Flow cytometry. Median ± IQR. *P < 0.01 (significant after Bonferroni’s correction), NS, P > 0.01, Mann-Whitney U test, 2-sided. Raw data including positive control are shown in Supplemental Figure 17. Veh, vehicle; Sel, selinexor; TDA, THU-Dec/5Aza; STDA, selinexor + THU-Dec/Aza.
Resistance in vivo and in vitro was by avoidance of pharmacodynamic effect.
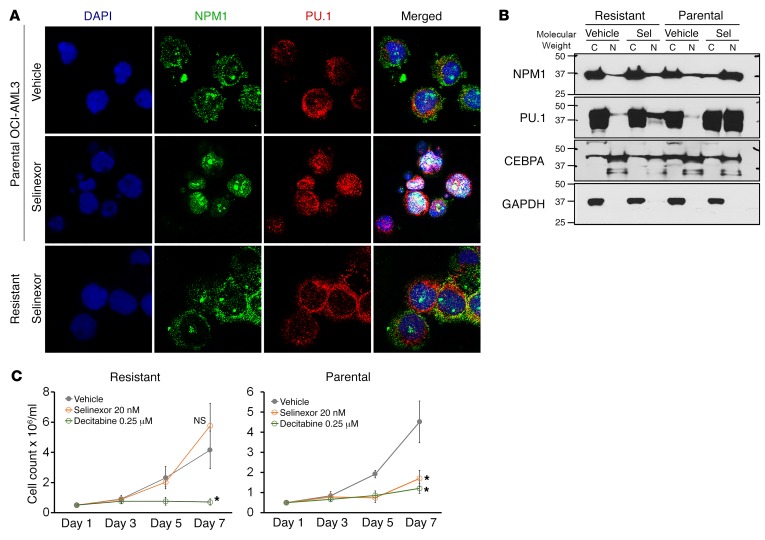
The NPM1/FLT3-mutated AML cells that resisted and progressed through several months of in vivo therapy to cause distress in the mice in the above experiment were analyzed for achievement of intended molecular pharmacodynamic effects — nuclear retention of mutant NPM1/PU.1 by selinexor and DNMT1 depletion by decitabine/5-azacytidine. In resistant cells, selinexor had failed to relocate mutant NPM1/PU.1 into nuclei (Supplemental Figure 19A). This was also seen in vitro: NPM1-mutated AML cells (OCI-AML3) selected for resistance to selinexor over several months of in vitro culture (exponential proliferation in selinexor up to 50 nM added every 3 days) demonstrated persistent cytoplasmic dislocation of mutant NPM1/PU.1, as shown both by IF (Figure 11A) and by WB of cytoplasmic and nuclear fractions (Figure 11B). The selinexor-resistant cells were still sensitive to noncytotoxic concentrations of decitabine (Figure 11C), as expected from the mechanism data shown earlier (Figures 7–9). Similarly, DNMT1 was not depleted from AML cells harvested from bone marrow at time of euthanasia (Supplemental Figure 19B), consistent with previous documentation by us and others that in vitro resistance to decitabine and 5-azacytidine is by selection for malignant cells that avoid DNMT1 depletion (58–63).
Figure 11. Resistance is by avoidance of selinexor-induced nuclear relocation of mutant NPM1/PU.1. OCI-AML3 NPM1-mutated cells were selected for resistance to selinexor by culture in selinexor, with up to 50 nM added every 3 days.
(A) NPM1 and PU.1 localization in the resistant cells by IF. DAPI was used to stain for nuclei. Images by Leica SP8 inverted confocal microscope; magnification, ×630. (B) NPM1 and PU.1 cytoplasmic versus nuclear localization in the resistant cells. WB of nuclear and cytoplasmic fractions. (C) Parental and selinexor-resistant OCI-AML3 cells were sensitive to noncytotoxic concentrations of decitabine. Cell counts by automated counter. Mean ± SD for 3 independent experiments. *P < 0.01 (significant after Bonferroni’s correction), selinexor or decitabine versus vehicle on day 7, 2-sided t tests.
Thus, resistance both in vitro and in vivo was mediated by prevention of intended molecular pharmacodynamic effects, underscoring the importance of the targeted pathways to the malignant phenotype. A summary of the overall data is provided in Figure 12.
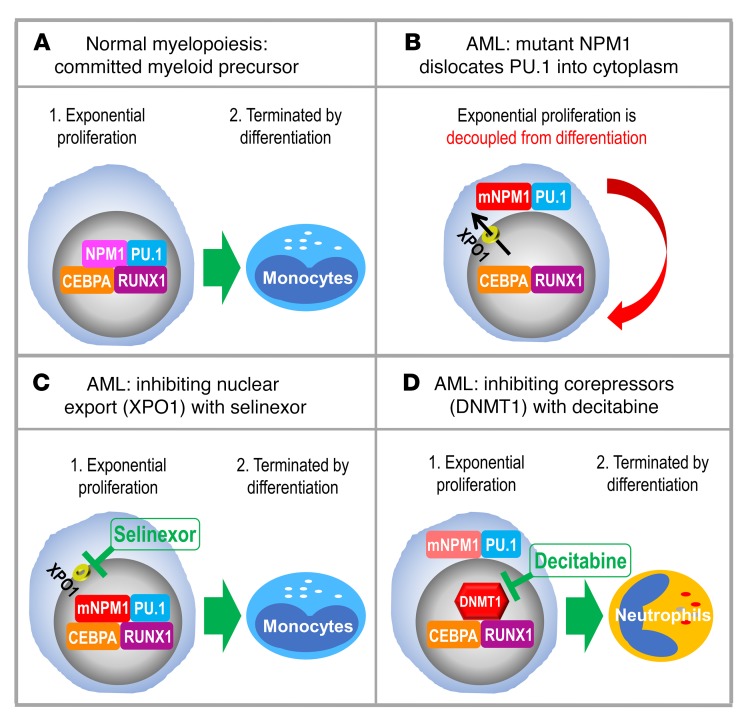
Figure 12. Summary.
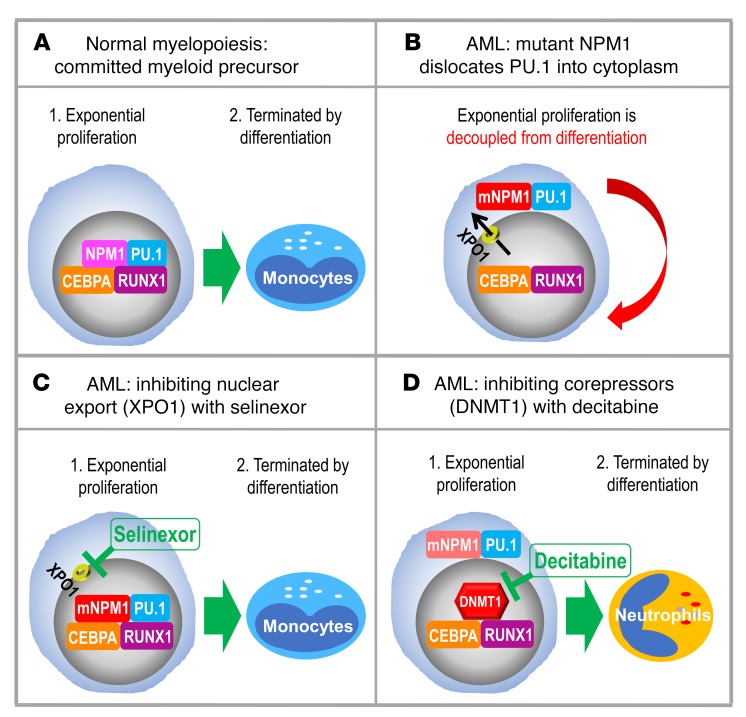
(A) Master transcription factors PU.1/CEBPA/RUNX1 collaborate to recruit coactivators and activate granulomonocytic differentiation genes. (B) Cytoplasmic dislocation of PU.1 by mutant NPM1 disrupts the collaboration, causing corepressor recruitment to nuclear CEBPA/RUNX1 and repression instead of activation of differentiation genes. (C) Inhibiting nuclear export with selinexor retains mutant NPM1/PU.1 in nuclei and activates monocyte differentiation genes, as expected with a high nuclear PU.1/CEBPA ratio. (D) Inhibiting corepressors (e.g., DNMT1) recruited to nuclear CEBPA/RUNX1 activates granulocyte differentiation genes, as expected with a low nuclear PU.1/CEBPA ratio. The granulocytic direction of differentiation moreover naturally downregulates mutant NPM1 to promote eventual PU.1 nuclear retention.
Discussion
Unbiased analyses of the NPM1 protein interactome revealed that it is a cofactor for PU.1, providing a mechanistic explanation for why others have found that NPM1 is essential for monocyte/macrophage differentiation and function (64). Crucially, the NPM1/PU.1 interaction causes PU.1 functional deficiency when NPM1 is mutated, because mutant NPM1 dislocates PU.1 into the cytoplasm with it.
PU.1, RUNX1, and CEBPA constitute a collaborating master transcription factor circuit that has as its purpose driving cells to terminal granulomonocytic fates (20–27, 29, 32–36). This ensemble is similarly expressed in AML cells versus granulocytes/monocytes, but loss of function in AML cells is evidenced by suppression of hundreds of monocyte and granulocyte terminal differentiation genes versus monocytes/granulocytes, even as commitment and proliferation programs are similarly activated (21, 65–67). That PU.1 partial loss of function permits activation of myeloid commitment genes but represses terminal differentiation genes has been demonstrated in murine models: Pu.1-deficient HSCs could commit into the monocytic lineage, but subsequent activation of terminal differentiation was suppressed, producing leukemic hematopoiesis — replicating lineage-committed cells impeded in their further maturation (42–47). This suspension of cells at an intermediate, inherently replicative stage of their advance along lineage differentiation axes seems to hinge on partial but not complete loss of function in the PU.1/CEBPA/RUNX1 circuit, since experimentally, complete inactivation of PU.1, CEBPA, or RUNX1 kills AML cells, even as partial loss of function of any one of these is leukemogenic (17, 43, 68–72); and accordingly, NPM1, RUNX1, and biallelic CEBPA mutations, though highly recurrent in AML, are mutually exclusive (37–39).
PU.1, CEBPA, and RUNX1 have been shown to promote exponential replication kinetics by binding to MYC enhancers to produce high-grade activation of MYC (the master transcription factor coordinator of cell proliferation) and by co-binding with MYC at its target genes (73–82). This contrasts with the quiescence imposed by stem cell master transcription factors such as HLF in HSCs (73–82). In computational analyses, such skewing of intrinsic replication rates logarithmically favors decoupling replication from forward differentiation in lineage progenitors as the most efficient strategy for malignant transformation (83). NPM1 mutations are such a decoupling event, since suppression of mutant NPM1 by siRNA unleashes forward differentiation that terminates leukemia-initiating capacity (84), and the connection with PU.1 shown here provides a mechanism.
Why does neoplastic evolution select to mutate NPM1 instead of PU.1 directly? We do not know for certain, but possibilities include that mutant NPM1 creates the graded PU.1 loss of function that has been shown to be necessary for leukemogenesis (17, 43, 68–72) and/or that dislocation of proteins other than PU.1 contributes to transformation. Even though mutant NPM1 dislocates several proteins, that PU.1 is key among these is suggested by the following: (i) Pu.1 partial loss of function is sufficient to transform normal into leukemic myelopoiesis (42–47, 72); (ii) Pu.1 nuclear reintroduction is sufficient to transition indefinitely replicating Pu.1-null myeloid precursors to terminal monocytic fates (17, 20, 21); (iii) PU.1 cytoplasmic dislocation can explain repression of more than 300 monocyte differentiation genes in AMLs, since these genes are demonstrable PU.1 targets by ChIP-Seq and their expression positively correlates with PU.1 in normal myelopoiesis; (iv) PU.1 is absolutely required for the monocytic fates triggered by nuclear export inhibition of NPM1-mutated AML cells (20–24, 29, 32–35); and (v) AML cells that avoid these nuclear export inhibitor–induced fates do so by avoiding PU.1 nuclear relocation.
PU.1 cytoplasmic dislocation can moreover explain previously poorly understood features of NPM1-mutated AMLs: (i) high HOX gene expression, since Pu.1-helmed differentiation advances suppress Hox genes; (ii) origin of NPM1 mutations in lineage-committed progenitors and not HSCs (9–11), since Pu.1 elimination from HSCs is antiproliferative/anticompetitive (42), while its knockdown from lineage-committed myeloid progenitors is leukemogenic (42–47); and (iii) mutual exclusivity of NPM1 with RUNX1 or biallelic CEBPA mutations (37–39), since some function of this master transcription factor hub is needed for existence as a lineage progenitor (17, 43, 68–72).
Nuclear export of NPM1 is mediated by the nuclear export protein XPO1. That inhibitors of XPO1 binding to cargo (e.g., KPT185, KPT8602) are 5- to 10-fold more potent in NPM1-mutated than NPM1-WT AML cells has already been reported (56, 85). However, the molecular mechanisms and pathways underlying this several-fold sensitivity were not known, and in clinical trials, selinexor (KPT330) has been evaluated in unselected AML genotypes and with traditional cytotoxic intent — dosages were escalated toward maximum tolerated levels of approximately 55–70 mg/m2 (93.5–119 mg fixed doses) and administered 1–2 times per week in 3- to 4-week cycles, to achieve plasma Cmax greater than 700 nM (54, 56, 57, 86), leading to a recommended phase II dose of 60 mg (~35 mg/m2) twice per week in 4-week cycles. The molecular mechanism information in this report suggests an alternative application of selinexor or its more potent analogs that selects for patients with refractory/relapsed NPM1-mutated AML and then uses substantially lower, better-tolerated doses for a defined molecular pharmacodynamic objective of locking PU.1 in the nucleus, and for a downstream pathway objective of activating monocytic terminal differentiation — cell cycle exits by terminal differentiation can spare normal HSCs (good therapeutic index) and do not require the master transcription factor regulator of apoptosis (cytotoxicity) p53 (40, 63, 65, 67, 87). Standard antimetabolite/cytotoxic therapy, on the other hand, intends to upregulate p53, a goal undermined by genetic inactivation of p53 (e.g., by TP53 mutation/deletion, MDM2/4 gain) in many AMLs that confers resistance to clinical concentrations of cytotoxic drugs both in vitro and in vivo, even as the same concentrations destroy normal HSCs (poor therapeutic index) (3, 88).
Nevertheless, the time-to-distress benefit of pharmacodynamically directed dosing of selinexor in a patient-derived xenotransplant model of NPM1/FLT3-mutated AML, a subset of NPM1-mutated AMLs with especially poor prognoses, was limited. This could reflect that the AML cells contained other genetic alterations, e.g, mutated FLT3, that arrest differentiation by other mechanisms — CEBPA is phosphorylated by the FLT3 pathway, modification that abrogates CEBP family interactions with coactivators (89) and impedes CEBPA-driven granulocytic differentiation (90). Underscoring this theme, corepressors (e.g., DNMT1) that oppose coactivators to repress rather than activate genes were enriched in the protein interactomes of nuclear CEBPA and RUNX1 in NPM1-mutated AML cells, and altogether more than 500 granulocyte and monocyte terminal differentiation genes were repressed. We showed previously that PU.1 and RUNX1 collaborate by excluding corepressors and recruiting coactivators (20, 21), a motif akin to corepressor/coactivator exchange at nuclear receptors upon binding of their cognate ligands. Accordingly, PU.1 introduction into the CEBPA/RUNX1 interactomes by selinexor toggled CEBPA/RUNX1 interactions from corepressors to coactivators. Directly depleting the corepressor DNMT1 from the CEBPA/RUNX1 interactome using noncytotoxic concentrations of the clinical drug decitabine also rebalanced toward coactivators and activated terminal granulocytic fates, as expected with a low nuclear PU.1/CEBPA ratio (23). Moreover, NPM1 expression naturally declines with granulocytic differentiation, possibly explaining why this treatment also decreased mutant NPM1 and increased nuclear PU.1. Thus, leukemogenic alterations to RUNX1, FLT3, KMT2A, and now NPM1 have been shown to converge onto corepressor/coactivator imbalance in the PU.1/CEBPA/RUNX1 master transcription factor hub as a common final pathway by which terminal differentiation is repressed in replicating progenitors (reviewed in ref. 40); this explains meaningful clinical activity of noncytotoxic DNMT1 depletion by decitabine (or its pro-drug 5-azacytidine) in patients with myeloid malignancies containing sundry mutations and translocations (20, 21, 65–67, 91–94) and likely contributes to the greater efficacy of this approach compared with selinexor alone in the in vivo model containing both NPM1 and FLT3 mutations. Underscoring the importance of the targeted pathways to the malignant phenotype, resistance in vitro and in vivo was by AML cells that evaded nuclear export inhibition by selinexor and DNMT1 depletion by decitabine/5-azacytidine (58–63).
Together, our results indicating that mutant NPM1 dislocates PU.1 into cytoplasm could guide pharmacodynamically directed dosing of clinical small molecules to reverse the dislocation and its effects on coactivator/corepressor content in the granulomonocyte master transcription factor hub, to thereby resume journeys of NPM1-mutated AML cells to terminal monocytic or granulocytic fates. This noncytotoxic (p53-independent) pathway of action distinguishes such treatments from conventional cytotoxic induction/consolidation, suggesting evaluation would be appropriate in the approximately 50% of patients with NPM1-mutated AML and chemorefractory disease.
Methods
See also Supplemental Methods for methods we have previously described.
Sources of cell lines and animals.
OCI-AML2 and OCI-AML3 were purchased from Deutsche Sammlung von Mikroorganismen und Zellkulturen (DSMZ), and THP1 cell lines were purchased from ATCC. IMS-M2 cells were a gift from Maria Paola Martelli and Brunangelo Falini. The cell lines, including OCI-AML3 selected for resistance to selinexor, were additionally authenticated (Genetica Cell Line Testing). NSG mice were purchased from the Jackson Laboratory.
IF.
Cells were cytospinned onto glass slides and fixed in cold methanol for 30 minutes at –20°C. The fixed cells were blocked in 10% goat serum for 1 hour at room temperature, then incubated overnight at 4°C with the primary antibodies PU.1 (1:100, sc-352, Santa Cruz Biotechnology) and NPM1 (1:100, sc-47725, Santa Cruz Biotechnology). Cells were washed in 1% goat serum with 0.1% Tween-20, followed by incubation with secondary antibodies Alexa Fluor 488 goat anti-mouse (1:250, A1101, Invitrogen) or Alexa Fluor 568 goat anti-rabbit IgG (1:500, A11036, Invitrogen) for 1 hour at room temperature in the dark. Cells were washed in 1% goat serum with 0.1% Tween-20 and 1× PBS. Nuclei of cells were stained with 0.25 μg/ml DAPI for 3 minutes before mounting with fluorescence mounting medium (Dako). Images were taken with a Leica DM RBE microscope connected to a Cambridge Research and Instrumentation Nuance multispectral imaging camera running Nuance version 3.0.2 software (PerkinElmer). Confirmatory images were acquired using a Leica SP8 inverted confocal microscope (Leica Microsystems) running Leica Application Suite X software. Of note, we found that paraformaldehyde fixation of cells (fixation with 4% paraformaldehyde for 10 minutes at room temperature, washing with 1× PBS, and incubation with 0.2 % Tween-100 for another 10 minutes at room temperature) did not permit IF detection of PU.1.
Treatment of a patient-derived xenotransplant model of dual NPM1/FLT3-mutated AML with nuclear export inhibition and/or DNMT1 depletion.
Patient-derived primary AML cells containing both NPM1 and FLT3-ITD mutations were obtained from PRoXe (catalog DFAM-61786-V2) (55). AML cells were transplanted by tail vein injection (3.0 × 10⁶/mouse) into nonirradiated 6- to 8-week-old NSG mice. Mice were anesthetized with isoflurane before transplantation. After confirmation of bone marrow AML engraftment to ≥20% in at least 3 randomly selected mice, remaining mice were randomized to treatment with vehicle (PBS), nuclear export inhibition by 2–5 mg/kg oral selinexor 4 times per week (n = 5 per group), DNMT1 inhibition (depletion) by 10 mg/kg tetrahydrouridine (THU) given intraperitoneally, followed by 0.1 mg/kg subcutaneous decitabine or 1 mg/kg subcutaneous 5-azacytidine 3 times per week (the decitabine and 5-azacytidine were alternated each week; the subcutaneous route of administration of decitabine and 5-azacytidine was to produce low Cmax and long half-life suited to noncytotoxic DNMT1 depletion; tetrahydrouridine was used to inhibit cytidine deaminase, which otherwise rapidly deaminates decitabine and 5-azacytidine in vivo) (59–61, 67). Tail vein blood samples for blood count measurement by HemaVet were obtained prior to leukemia inoculation and at intervals thereafter as indicated in the figures. Mice were observed daily for signs of pain or distress — e.g., weight loss that exceeded 20% of initial total body weight, lethargy, vocalization, loss of motor function in any limb —and were euthanized according to an IACUC-approved protocol if such signs were noted.
Bioinformatic and statistical analysis.
Protein interaction networks were constructed using Cytoscape 3.4. Briefly, identified proteins were represented as nodes in the network. The size of each node relates to the normalized relative quantification value as defined in “Label free relative protein quantitation (LFQ)”: protein node shape was set to “circle”; the length and width (diameter) of the circle were formatted by the continuous mapping function of the software to represent the normalized relative quantification value. Physical protein-protein interaction networks were predicted using STRING v10.0 (http://string.db.org/) with high confidence (parameter value 0.70). Predicted protein-protein interactions were represented as Edges/Links connecting protein nodes; the thickness of each edge represented the statistical significance of the string prediction (Supplemental Tables 6 and 7). Different colors were assigned to protein function complexes, with blue for transcription factors, green for coactivators, and red for corepressors.
Myeloid commitment and monocyte and granulocyte terminal differentiation genes were identified by applying the Comparative Marker Selection (V10) tool in Morpheus (https://software.broadinstitute.org/morpheus/) (95), an algorithm for identifying genes that discriminate between classes of samples, to a public database of gene expression at different stages of hematopoiesis (GSE24759; ref. 51), to identify probes that significantly discriminated (500 probes in each direction) between CMPs/GMPs versus HSCs/monocytes/granulocytes (commitment genes), monocytes versus HSCs/CMPs/GMPs (monocyte terminal differentiation genes) and granulocytes versus HSCs/CMPs/GMPs (granulocyte terminal differentiation genes). Statistical significance was determined by the 1,000 permutations test and a P value cutoff of ≤0.02. Expression of the commitment and monocyte differentiation genes was correlated with PU.1 expression in the same samples (Pearson’s correlation coefficient).
Expression of myeloid master transcription factors and myeloid differentiation programs in AML cells versus the normal hematopoietic hierarchy were compared using an integrated dataset, BloodPool, that we assembled and built as described previously (48, 49).
GEO database numbers for analyzed ChIP-Seq reads were (52, 96) as follows: GSM538017 (Pu.1 ChIP-Seq in bone marrow macrophages), GSM537983 (Pu.1 ChIP-Seq in peritoneal macrophages), and GSM1692857 (Pu.1 ChIP-Seq in hematopoietic progenitors). Aligned ChIP-Seq reads were imported, analyzed, and visualized using EaSeq (97). All values were normalized to reads per million per 1 kbp.
Statistics.
Wilcoxon’s rank-sum, Mann Whitney U, and t tests were 2-sided and performed at the 0.05 significance level or lower (Bonferroni’s corrections were applied for instances of multiple parallel testing). SDs and interquartile ranges (IQR) for each set of measurements were calculated and represented as y-axis error bars on each graph. Graph Prism (GraphPad) or SAS statistical software (SAS Institute Inc.) was used to perform statistical analysis including correlation analyses.
Study approval.
Bone marrow samples for research were obtained from patients with AML according to a study protocol approved by the Cleveland Clinic Institutional Review Board, with written informed consent obtained prior to inclusion in the study. Experiments using patient-derived xenotransplant models of AML were approved by the Cleveland Clinic IACUC.
Author contributions
XG and YS generated hypotheses, designed experiments, and obtained funding. XG, QE, RZM, MH, FE, TR, NR, BP, BTP, and CVC carried out experiments, and generated and/or analyzed data. QE, RB, YL, and BKJ also contributed to experimental design. ZH, DW, CA, YL, MPM, BF, HC, JM, and YS provided cells and reagents. XG and YS wrote the manuscript. All authors reviewed/commented on the work/manuscript.
Supplementary Material
Acknowledgments
We thank the Harinder Singh laboratory for the gift of Pu.1-ER cells. This work was supported by grants from VeloSano to XG; P30 CA043703 from the NIH/National Cancer Institute and philanthropic funds from the James Oberle family, Robert and Jennifer McNeil, Leszek and Jolanta Czarnecki, and Dane and Louise Miller to YS; and Associazione Italiana Ricerca Cancro (AIRC) IG 2016 no. 18568 and European Research Council (ERC) Advanced Grant 2016 no. 740230 to BF. Work in the BP laboratory was supported through a center grant from the Novo Nordisk Foundation (Novo Nordisk Foundation Center for Stem Cell Biology, DanStem; grant NNF17CC0027852). KaryoPharm Therapeutics provided the selinexor compound.
Version 1. 07/17/2018
In-Press Preview
Version 2. 08/27/2018
Electronic publication
Version 3. 10/01/2018
Print issue publication
Footnotes
Conflict of interest: CA and YL have ownership in KaryoPharm and YS has ownership in EpiDestiny. CA and YL receive income from KaryoPharm. YS hold patents involving tetrahydrouridine, decitabine, and 5-azacytidine (US patents 9,259,469 B2; 9,265,785 B2; 9,895,391 B2).
Reference information: J Clin Invest. 2018;128(10):4260–4279.https://doi.org/10.1172/JCI97117.
Contributor Information
Xiaorong Gu, Email: gux@ccf.org.
Quteba Ebrahem, Email: ebrahemq@ccf.org.
Reda Z. Mahfouz, Email: mahfour@ccf.org.
Metis Hasipek, Email: Hasipem@ccf.org.
Francis Enane, Email: fenane@iu.edu.
Tomas Radivoyevitch, Email: radivot@ccf.org.
Nicolas Rapin, Email: nicolas.rapin@bric.ku.dk.
Bartlomiej Przychodzen, Email: przychb@ccf.org.
Zhenbo Hu, Email: huzhenbo@wfmc.edu.cn.
Ramesh Balusu, Email: rbalusu@kumc.edu.
Claudiu V. Cotta, Email: Cottac@ccf.org.
David Wald, Email: dnw@case.edu.
Christian Argueta, Email: cargueta@karyopharm.com.
Yosef Landesman, Email: ylandesman@karyopharm.com.
Maria Paola Martelli, Email: mpmartelli@libero.it.
Brunangelo Falini, Email: faliniem@unipg.it.
Hetty Carraway, Email: Carrawh@ccf.org.
Bo T. Porse, Email: bo.porse@finsenlab.dk.
Babal K. Jha, Email: Jhab@ccf.org.
Yogen Saunthararajah, Email: saunthy@ccf.org.
References
- 1.Falini B, et al. Cytoplasmic nucleophosmin in acute myelogenous leukemia with a normal karyotype. N Engl J Med. 2005;352(3):254–266. doi: 10.1056/NEJMoa041974. [DOI] [PubMed] [Google Scholar]
- 2.Smith ML, Hills RK, Grimwade D. Independent prognostic variables in acute myeloid leukaemia. Blood Rev. 2011;25(1):39–51. doi: 10.1016/j.blre.2010.10.002. [DOI] [PubMed] [Google Scholar]
- 3.How J, et al. The prognostic impact of FLT3-ITD and NPM1 mutations in patients with relapsed acute myeloid leukemia and intermediate-risk cytogenetics. Blood Cancer J. 2013;3:e116. doi: 10.1038/bcj.2013.14. [DOI] [PMC free article] [PubMed] [Google Scholar]
- 4.Grisendi S, et al. Role of nucleophosmin in embryonic development and tumorigenesis. Nature. 2005;437(7055):147–153. doi: 10.1038/nature03915. [DOI] [PubMed] [Google Scholar]
- 5.Falini B, et al. Both carboxy-terminus NES motif and mutated tryptophan(s) are crucial for aberrant nuclear export of nucleophosmin leukemic mutants in NPMc+ AML. Blood. 2006;107(11):4514–4523. doi: 10.1182/blood-2005-11-4745. [DOI] [PubMed] [Google Scholar]
- 6.Lindström MS. NPM1/B23: A Multifunctional chaperone in ribosome biogenesis and chromatin remodeling. Biochem Res Int. 2011;2011:195209. doi: 10.1155/2011/195209. [DOI] [PMC free article] [PubMed] [Google Scholar]
- 7.Falini B, Nicoletti I, Martelli MF, Mecucci C. Acute myeloid leukemia carrying cytoplasmic/mutated nucleophosmin (NPMc+ AML): biologic and clinical features. Blood. 2007;109(3):874–885. doi: 10.1182/blood-2006-07-012252. [DOI] [PubMed] [Google Scholar]
- 8.Hutten S, Kehlenbach RH. CRM1-mediated nuclear export: to the pore and beyond. Trends Cell Biol. 2007;17(4):193–201. doi: 10.1016/j.tcb.2007.02.003. [DOI] [PubMed] [Google Scholar]
- 9.Jan M, et al. Clonal evolution of preleukemic hematopoietic stem cells precedes human acute myeloid leukemia. Sci Transl Med. 2012;4(149):149ra118. doi: 10.1126/scitranslmed.3004315. [DOI] [PMC free article] [PubMed] [Google Scholar]
- 10.Corces-Zimmerman MR, Hong WJ, Weissman IL, Medeiros BC, Majeti R. Preleukemic mutations in human acute myeloid leukemia affect epigenetic regulators and persist in remission. Proc Natl Acad Sci U S A. 2014;111(7):2548–2553. doi: 10.1073/pnas.1324297111. [DOI] [PMC free article] [PubMed] [Google Scholar]
- 11.Shlush LI, et al. Identification of pre-leukaemic haematopoietic stem cells in acute leukaemia. Nature. 2014;506(7488):328–333. doi: 10.1038/nature13038. [DOI] [PMC free article] [PubMed] [Google Scholar]
- 12.Martelli MP, et al. Absence of nucleophosmin leukaemic mutants in B and T cells from AML with NPM1 mutations: implications for the cell of origin of NPMc+ AML. Leukemia. 2008;22(1):195–198. doi: 10.1038/sj.leu.2404857. [DOI] [PubMed] [Google Scholar]
- 13.Goardon N, et al. Coexistence of LMPP-like and GMP-like leukemia stem cells in acute myeloid leukemia. Cancer Cell. 2011;19(1):138–152. doi: 10.1016/j.ccr.2010.12.012. [DOI] [PubMed] [Google Scholar]
- 14.Taussig DC, et al. Leukemia-initiating cells from some acute myeloid leukemia patients with mutated nucleophosmin reside in the CD34(-) fraction. Blood. 2010;115(10):1976–1984. doi: 10.1182/blood-2009-02-206565. [DOI] [PMC free article] [PubMed] [Google Scholar]
- 15.Quek L, et al. Genetically distinct leukemic stem cells in human CD34- acute myeloid leukemia are arrested at a hemopoietic precursor-like stage. J Exp Med. 2016;213(8):1513–1535. doi: 10.1084/jem.20151775. [DOI] [PMC free article] [PubMed] [Google Scholar]
- 16.Dovey OM, et al. Molecular synergy underlies the co-occurrence patterns and phenotype of NPM1-mutant acute myeloid leukemia. Blood. 2017;130(17):1911–1922. doi: 10.1182/blood-2017-01-760595. [DOI] [PMC free article] [PubMed] [Google Scholar]
- 17.Ng KP, Hu Z, Ebrahem Q, Negrotto S, Lausen J, Saunthararajah Y. Runx1 deficiency permits granulocyte lineage commitment but impairs subsequent maturation. Oncogenesis. 2013;2:e78. doi: 10.1038/oncsis.2013.41. [DOI] [PMC free article] [PubMed] [Google Scholar]
- 18.Arends CM, et al. Hematopoietic lineage distribution evolutionary dynamics of clonal hematopoiesis. Leukemia. doi: 10.1038/s41375-018-0047-7. [DOI] [PubMed] [Google Scholar]
- 19.Vierbuchen T, Wernig M. Molecular roadblocks for cellular reprogramming. Mol Cell. 2012;47(6):827–838. doi: 10.1016/j.molcel.2012.09.008. [DOI] [PMC free article] [PubMed] [Google Scholar]
- 20.Hu Z, et al. RUNX1 regulates corepressor interactions of PU.1. Blood. 2011;117(24):6498–6508. doi: 10.1182/blood-2010-10-312512. [DOI] [PMC free article] [PubMed] [Google Scholar]
- 21.Gu X, et al. Runx1 regulation of Pu.1 corepressor/coactivator exchange identifies specific molecular targets for leukemia differentiation therapy. J Biol Chem. 2014;289(21):14881–14895. doi: 10.1074/jbc.M114.562447. [DOI] [PMC free article] [PubMed] [Google Scholar]
- 22.Hohaus S, Petrovick MS, Voso MT, Sun Z, Zhang DE, Tenen DG. PU.1 (Spi-1) and C/EBP alpha regulate expression of the granulocyte-macrophage colony-stimulating factor receptor alpha gene. Mol Cell Biol. 1995;15(10):5830–5845. doi: 10.1128/MCB.15.10.5830. [DOI] [PMC free article] [PubMed] [Google Scholar]
- 23.Dahl R, et al. Regulation of macrophage and neutrophil cell fates by the PU.1:C/EBPalpha ratio and granulocyte colony-stimulating factor. Nat Immunol. 2003;4(10):1029–1036. doi: 10.1038/ni973. [DOI] [PubMed] [Google Scholar]
- 24.Zhang DE, et al. Function of PU.1 (Spi-1), C/EBP, and AML1 in early myelopoiesis: regulation of multiple myeloid CSF receptor promoters. Curr Top Microbiol Immunol. 1996;211:137–147. doi: 10.1007/978-3-642-85232-9_14. [DOI] [PubMed] [Google Scholar]
- 25.Petrovick MS, Hiebert SW, Friedman AD, Hetherington CJ, Tenen DG, Zhang DE. Multiple functional domains of AML1: PU.1 and C/EBPalpha synergize with different regions of AML1. Mol Cell Biol. 1998;18(7):3915–3925. doi: 10.1128/MCB.18.7.3915. [DOI] [PMC free article] [PubMed] [Google Scholar]
- 26.Smith LT, Hohaus S, Gonzalez DA, Dziennis SE, Tenen DG. PU.1 (Spi-1) and C/EBP alpha regulate the granulocyte colony-stimulating factor receptor promoter in myeloid cells. Blood. 1996;88(4):1234–1247. [PubMed] [Google Scholar]
- 27.Zhang DE, et al. CCAAT enhancer-binding protein (C/EBP) and AML1 (CBF alpha2) synergistically activate the macrophage colony-stimulating factor receptor promoter. Mol Cell Biol. 1996;16(3):1231–1240. doi: 10.1128/MCB.16.3.1231. [DOI] [PMC free article] [PubMed] [Google Scholar]
- 28.McKercher SR, et al. Targeted disruption of the PU.1 gene results in multiple hematopoietic abnormalities. EMBO J. 1996;15(20):5647–5658. [PMC free article] [PubMed] [Google Scholar]
- 29.Scott EW, Simon MC, Anastasi J, Singh H. Requirement of transcription factor PU.1 in the development of multiple hematopoietic lineages. Science. 1994;265(5178):1573–1577. doi: 10.1126/science.8079170. [DOI] [PubMed] [Google Scholar]
- 30.Zhang DE, Zhang P, Wang ND, Hetherington CJ, Darlington GJ, Tenen DG. Absence of granulocyte colony-stimulating factor signaling and neutrophil development in CCAAT enhancer binding protein alpha-deficient mice. Proc Natl Acad Sci U S A. 1997;94(2):569–574. doi: 10.1073/pnas.94.2.569. [DOI] [PMC free article] [PubMed] [Google Scholar]
- 31.Okuda T, van Deursen J, Hiebert SW, Grosveld G, Downing JR. AML1, the target of multiple chromosomal translocations in human leukemia, is essential for normal fetal liver hematopoiesis. Cell. 1996;84(2):321–330. doi: 10.1016/S0092-8674(00)80986-1. [DOI] [PubMed] [Google Scholar]
- 32.Sorrells TR, Johnson AD. Making sense of transcription networks. Cell. 2015;161(4):714–723. doi: 10.1016/j.cell.2015.04.014. [DOI] [PMC free article] [PubMed] [Google Scholar]
- 33.Feng R, et al. PU.1 and C/EBPalpha/beta convert fibroblasts into macrophage-like cells. Proc Natl Acad Sci U S A. 2008;105(16):6057–6062. doi: 10.1073/pnas.0711961105. [DOI] [PMC free article] [PubMed] [Google Scholar]
- 34.Lis R, et al. Conversion of adult endothelium to immunocompetent haematopoietic stem cells. Nature. 2017;545(7655):439–445. doi: 10.1038/nature22326. [DOI] [PMC free article] [PubMed] [Google Scholar]
- 35.Sandler VM, et al. Reprogramming human endothelial cells to haematopoietic cells requires vascular induction. Nature. 2014;511(7509):312–318. doi: 10.1038/nature13547. [DOI] [PMC free article] [PubMed] [Google Scholar]
- 36.Sugimura R, et al. Haematopoietic stem and progenitor cells from human pluripotent stem cells. Nature. 2017;545(7655):432–438. doi: 10.1038/nature22370. [DOI] [PMC free article] [PubMed] [Google Scholar]
- 37.Mendler JH, et al. RUNX1 mutations are associated with poor outcome in younger and older patients with cytogenetically normal acute myeloid leukemia and with distinct gene and MicroRNA expression signatures. J Clin Oncol. 2012;30(25):3109–3118. doi: 10.1200/JCO.2011.40.6652. [DOI] [PMC free article] [PubMed] [Google Scholar]
- 38.Alpermann T, et al. Molecular subtypes of NPM1 mutations have different clinical profiles, specific patterns of accompanying molecular mutations and varying outcomes in intermediate risk acute myeloid leukemia. Haematologica. 2016;101(2):e55–e58. doi: 10.3324/haematol.2015.133819. [DOI] [PMC free article] [PubMed] [Google Scholar]
- 39.Dufour A, et al. Acute myeloid leukemia with biallelic CEBPA gene mutations and normal karyotype represents a distinct genetic entity associated with a favorable clinical outcome. J Clin Oncol. 2010;28(4):570–577. doi: 10.1200/JCO.2008.21.6010. [DOI] [PubMed] [Google Scholar]
- 40.Velcheti V, Radivoyevitch T, Saunthararajah Y. Higher-level pathway objectives of epigenetic therapy: A solution to the p53 problem in cancer. Am Soc Clin Oncol Educ Book. 2017;37:812–824. doi: 10.14694/EDBK_174175. [DOI] [PubMed] [Google Scholar]
- 41.Döhner K, et al. Mutation analysis of the transcription factor PU.1 in younger adults (16 to 60 years) with acute myeloid leukemia: a study of the AML Study Group Ulm (AMLSG ULM) Blood. 2003;102(10):3850–3851. doi: 10.1182/blood-2003-08-2654. [DOI] [PubMed] [Google Scholar]
- 42.Iwasaki H, et al. Distinctive and indispensable roles of PU.1 in maintenance of hematopoietic stem cells and their differentiation. Blood. 2005;106(5):1590–1600. doi: 10.1182/blood-2005-03-0860. [DOI] [PMC free article] [PubMed] [Google Scholar]
- 43.Rosenbauer F, et al. Acute myeloid leukemia induced by graded reduction of a lineage-specific transcription factor, PU.1. NatGenet. 2004;36(6):624–630. doi: 10.1038/ng1361. [DOI] [PubMed] [Google Scholar]
- 44.Henkel GW, McKercher SR, Leenen PJ, Maki RA. Commitment to the monocytic lineage occurs in the absence of the transcription factor PU.1. Blood. 1999;93(9):2849–2858. [PubMed] [Google Scholar]
- 45.McKercher SR, Henkel GW, Maki RA. The transcription factor PU.1 does not regulate lineage commitment but has lineage-specific effects. J Leukoc Biol. 1999;66(5):727–732. doi: 10.1002/jlb.66.5.727. [DOI] [PubMed] [Google Scholar]
- 46.DeKoter RP, Kamath MB, Houston IB. Analysis of concentration-dependent functions of PU.1 in hematopoiesis using mouse models. Blood Cells Mol Dis. 2007;39(3):316–320. doi: 10.1016/j.bcmd.2007.06.004. [DOI] [PMC free article] [PubMed] [Google Scholar]
- 47.Houston IB, Kamath MB, Schweitzer BL, Chlon TM, DeKoter RP. Reduction in PU.1 activity results in a block to B-cell development, abnormal myeloid proliferation, and neonatal lethality. Exp Hematol. 2007;35(7):1056–1068. doi: 10.1016/j.exphem.2007.04.005. [DOI] [PMC free article] [PubMed] [Google Scholar]
- 48.Rapin N, et al. Comparing cancer vs normal gene expression profiles identifies new disease entities and common transcriptional programs in AML patients. Blood. 2014;123(6):894–904. doi: 10.1182/blood-2013-02-485771. [DOI] [PubMed] [Google Scholar]
- 49.Bagger FO, et al. BloodSpot: a database of gene expression profiles and transcriptional programs for healthy and malignant haematopoiesis. Nucleic Acids Res. 2016;44(D1):D917–D924. doi: 10.1093/nar/gkv1101. [DOI] [PMC free article] [PubMed] [Google Scholar]
- 50.Kim J, et al. A Myc network accounts for similarities between embryonic stem and cancer cell transcription programs. Cell. 2010;143(2):313–324. doi: 10.1016/j.cell.2010.09.010. [DOI] [PMC free article] [PubMed] [Google Scholar]
- 51.Novershtern N, et al. Densely interconnected transcriptional circuits control cell states in human hematopoiesis. Cell. 2011;144(2):296–309. doi: 10.1016/j.cell.2011.01.004. [DOI] [PMC free article] [PubMed] [Google Scholar]
- 52.Heinz S, et al. Simple combinations of lineage-determining transcription factors prime cis-regulatory elements required for macrophage and B cell identities. Mol Cell. 2010;38(4):576–589. doi: 10.1016/j.molcel.2010.05.004. [DOI] [PMC free article] [PubMed] [Google Scholar]
- 53.Walsh JC, et al. Cooperative and antagonistic interplay between PU.1 and GATA-2 in the specification of myeloid cell fates. Immunity. 2002;17(5):665–676. doi: 10.1016/S1074-7613(02)00452-1. [DOI] [PubMed] [Google Scholar]
- 54.Etchin J, et al. Activity of a selective inhibitor of nuclear export, selinexor (KPT-330), against AML-initiating cells engrafted into immunosuppressed NSG mice. Leukemia. 2016;30(1):190–199. doi: 10.1038/leu.2015.194. [DOI] [PMC free article] [PubMed] [Google Scholar]
- 55.Townsend EC, et al. The Public Repository of Xenografts enables discovery and randomized phase ii-like trials in mice. Cancer Cell. 2016;29(4):574–586. doi: 10.1016/j.ccell.2016.03.008. [DOI] [PMC free article] [PubMed] [Google Scholar]
- 56.Ranganathan P, et al. Preclinical activity of a novel CRM1 inhibitor in acute myeloid leukemia. Blood. 2012;120(9):1765–1773. doi: 10.1182/blood-2012-04-423160. [DOI] [PMC free article] [PubMed] [Google Scholar]
- 57.Yee KWL, et al. A phase I dose-escalation study of the oral selective inhibitor of nuclear export (SINE) KPT-330 (selinexor) in patients (pts) with relapsed/refractory acute myeloid leukemia (AML) J Clin Oncol. 2014;32(15 suppl):7032 [Google Scholar]
- 58.Ebrahem Q, et al. Mechanisms of resistance to 5-azacytidine/decitabine in MDS-AML and pre-clinical in vivo proof of principle of rational solutions to extend response. Blood. 2015;126(23):678 [Google Scholar]
- 59.Ebrahem Q, Mahfouz RZ, Ng KP, Saunthararajah Y. High cytidine deaminase expression in the liver provides sanctuary for cancer cells from decitabine treatment effects. Oncotarget. 2012;3(10):1137–1145. doi: 10.18632/oncotarget.597. [DOI] [PMC free article] [PubMed] [Google Scholar]
- 60.Molokie R, et al. Oral tetrahydrouridine and decitabine for non-cytotoxic epigenetic gene regulation in sickle cell disease: a randomized phase 1 study. PLoS Med. 2017;14(9):e1002382. doi: 10.1371/journal.pmed.1002382. [DOI] [PMC free article] [PubMed] [Google Scholar]
- 61.Lavelle D, et al. Effects of tetrahydrouridine on pharmacokinetics and pharmacodynamics of oral decitabine. Blood. 2012;119(5):1240–1247. doi: 10.1182/blood-2011-08-371690. [DOI] [PMC free article] [PubMed] [Google Scholar]
- 62.Terse P, et al. Subchronic oral toxicity study of decitabine in combination with tetrahydrouridine in CD-1 mice. Int J Toxicol. 2014;33(2):75–85. doi: 10.1177/1091581814524994. [DOI] [PMC free article] [PubMed] [Google Scholar]
- 63.Saunthararajah Y. Key clinical observations after 5-azacytidine and decitabine treatment of myelodysplastic syndromes suggest practical solutions for better outcomes. Hematology Am Soc Hematol Educ Program. 2013;2013:511–521. doi: 10.1182/asheducation-2013.1.511. [DOI] [PubMed] [Google Scholar]
- 64.Guery L, et al. Fine-tuning nucleophosmin in macrophage differentiation and activation. Blood. 2011;118(17):4694–4704. doi: 10.1182/blood-2011-03-341255. [DOI] [PMC free article] [PubMed] [Google Scholar]
- 65.Saunthararajah Y, et al. Evaluation of noncytotoxic DNMT1-depleting therapy in patients with myelodysplastic syndromes. J Clin Invest. 2015;125(3):1043–1055. doi: 10.1172/JCI78789. [DOI] [PMC free article] [PubMed] [Google Scholar]
- 66.Negrotto S, et al. CpG methylation patterns and decitabine treatment response in acute myeloid leukemia cells and normal hematopoietic precursors. Leukemia. 2012;26(2):244–254. doi: 10.1038/leu.2011.207. [DOI] [PMC free article] [PubMed] [Google Scholar]
- 67.Ng KP, et al. p53 independent epigenetic-differentiation treatment in xenotransplant models of acute myeloid leukemia. Leukemia. 2011;25(11):1739–1750. doi: 10.1038/leu.2011.159. [DOI] [PMC free article] [PubMed] [Google Scholar]
- 68.Goyama S, et al. Transcription factor RUNX1 promotes survival of acute myeloid leukemia cells. J Clin Invest. 2013;123(9):3876–3888. doi: 10.1172/JCI68557. [DOI] [PMC free article] [PubMed] [Google Scholar]
- 69.Ohlsson E, et al. Initiation of MLL-rearranged AML is dependent on C/EBPα. J Exp Med. 2014;211(1):5–13. doi: 10.1084/jem.20130932. [DOI] [PMC free article] [PubMed] [Google Scholar]
- 70.Aikawa Y, et al. Essential role of PU.1 in maintenance of mixed lineage leukemia-associated leukemic stem cells. Cancer Sci. 2015;106(3):227–236. doi: 10.1111/cas.12593. [DOI] [PMC free article] [PubMed] [Google Scholar]
- 71.Zhou J, et al. PU.1 is essential for MLL leukemia partially via crosstalk with the MEIS/HOX pathway. Leukemia. 2014;28(7):1436–1448. doi: 10.1038/leu.2013.384. [DOI] [PMC free article] [PubMed] [Google Scholar]
- 72.Will B, et al. Minimal PU.1 reduction induces a preleukemic state and promotes development of acute myeloid leukemia. Nat Med. 2015;21(10):1172–1181. doi: 10.1038/nm.3936. [DOI] [PMC free article] [PubMed] [Google Scholar]
- 73.Nygren JM, Bryder D, Jacobsen SE. Prolonged cell cycle transit is a defining and developmentally conserved hemopoietic stem cell property. J Immunol. 2006;177(1):201–208. doi: 10.4049/jimmunol.177.1.201. [DOI] [PubMed] [Google Scholar]
- 74.Schwartz GN, et al. Proliferation kinetics of subpopulations of human marrow cells determined by quantifying in vivo incorporation of [2H2]-glucose into DNA of S-phase cells. Blood. 2003;102(6):2068–2073. doi: 10.1182/blood-2003-01-0139. [DOI] [PubMed] [Google Scholar]
- 75.van der Wath RC, Wilson A, Laurenti E, Trumpp A, Liò P. Estimating dormant and active hematopoietic stem cell kinetics through extensive modeling of bromodeoxyuridine label-retaining cell dynamics. PLoS ONE. 2009;4(9):e6972. doi: 10.1371/journal.pone.0006972. [DOI] [PMC free article] [PubMed] [Google Scholar]
- 76.Wilson A, et al. c-Myc controls the balance between hematopoietic stem cell self-renewal and differentiation. Genes Dev. 2004;18(22):2747–2763. doi: 10.1101/gad.313104. [DOI] [PMC free article] [PubMed] [Google Scholar]
- 77.Reavie L, et al. Regulation of hematopoietic stem cell differentiation by a single ubiquitin ligase-substrate complex. Nat Immunol. 2010;11(3):207–215. doi: 10.1038/ni.1839. [DOI] [PMC free article] [PubMed] [Google Scholar]
- 78.Laurenti E, et al. Hematopoietic stem cell function and survival depend on c-Myc and N-Myc activity. Cell Stem Cell. 2008;3(6):611–624. doi: 10.1016/j.stem.2008.09.005. [DOI] [PMC free article] [PubMed] [Google Scholar]
- 79.Zhang J, et al. Differential requirements for c-Myc in chronic hematopoietic hyperplasia and acute hematopoietic malignancies in Pten-null mice. Leukemia. 2011;25(12):1857–1868. doi: 10.1038/leu.2011.220. [DOI] [PMC free article] [PubMed] [Google Scholar]
- 80.Arnold I, Watt FM. c-Myc activation in transgenic mouse epidermis results in mobilization of stem cells and differentiation of their progeny. Curr Biol. 2001;11(8):558–568. doi: 10.1016/S0960-9822(01)00154-3. [DOI] [PubMed] [Google Scholar]
- 81.Li J. Quiescence regulators for hematopoietic stem cell. Exp Hematol. 2011;39(5):511–520. doi: 10.1016/j.exphem.2011.01.008. [DOI] [PubMed] [Google Scholar]
- 82.Komorowska K, et al. Hepatic leukemia factor maintains quiescence of hematopoietic stem cells and protects the stem cell pool during regeneration. Cell Rep. 2017;21(12):3514–3523. doi: 10.1016/j.celrep.2017.11.084. [DOI] [PubMed] [Google Scholar]
- 83.Ashkenazi R, Gentry SN, Jackson TL. Pathways to tumorigenesis — modeling mutation acquisition in stem cells and their progeny. Neoplasia. 2008;10(11):1170–1182. doi: 10.1593/neo.08572. [DOI] [PMC free article] [PubMed] [Google Scholar]
- 84.Balusu R, et al. Targeting levels or oligomerization of nucleophosmin 1 induces differentiation and loss of survival of human AML cells with mutant NPM1. Blood. 2011;118(11):3096–3106. doi: 10.1182/blood-2010-09-309674. [DOI] [PMC free article] [PubMed] [Google Scholar]
- 85.Hing ZA, et al. Next-generation XPO1 inhibitor shows improved efficacy and in vivo tolerability in hematological malignancies. Leukemia. 2016;30(12):2364–2372. doi: 10.1038/leu.2016.136. [DOI] [PMC free article] [PubMed] [Google Scholar]
- 86.Garzon R, et al. A phase 1 clinical trial of single-agent selinexor in acute myeloid leukemia. Blood. 2017;129(24):3165–3174. doi: 10.1182/blood-2016-11-750158. [DOI] [PMC free article] [PubMed] [Google Scholar]
- 87.Saunthararajah Y, et al. p53-Independent, normal stem cell sparing epigenetic differentiation therapy for myeloid and other malignancies. Semin Oncol. 2012;39(1):97–108. doi: 10.1053/j.seminoncol.2011.11.011. [DOI] [PMC free article] [PubMed] [Google Scholar]
- 88.Quintás-Cardama A, et al. p53 pathway dysfunction is highly prevalent in acute myeloid leukemia independent of TP53 mutational status. Leukemia. 2017;31(6):1296–1305. doi: 10.1038/leu.2016.350. [DOI] [PubMed] [Google Scholar]
- 89.Kowenz-Leutz E, Pless O, Dittmar G, Knoblich M, Leutz A. Crosstalk between C/EBPbeta phosphorylation, arginine methylation, and SWI/SNF/Mediator implies an indexing transcription factor code. EMBO J. 2010;29(6):1105–1115. doi: 10.1038/emboj.2010.3. [DOI] [PMC free article] [PubMed] [Google Scholar]
- 90.Radomska HS, et al. Block of C/EBP alpha function by phosphorylation in acute myeloid leukemia with FLT3 activating mutations. J Exp Med. 2006;203(2):371–381. doi: 10.1084/jem.20052242. [DOI] [PMC free article] [PubMed] [Google Scholar]
- 91.Saleh MFM, Saunthararajah Y. Severe pyoderma gangrenosum caused by myelodysplastic syndrome successfully treated with decitabine administered by a noncytotoxic regimen. Clin Case Rep. 2017;5(12):2025–2027. doi: 10.1002/ccr3.1221. [DOI] [PMC free article] [PubMed] [Google Scholar]
- 92.Liu Y, et al. Successful use of very low dose subcutaneous decitabine to treat high-risk myelofibrosis with Sweet syndrome that was refractory to 5-azacitidine. Leuk Lymphoma. 2014;55(2):447–449. doi: 10.3109/10428194.2013.802315. [DOI] [PubMed] [Google Scholar]
- 93.Hu Z, Saunthararajah Y. CEBPE activation in PML-RARA cells by arsenic. Blood. 2012;119(9):2177–2179. doi: 10.1182/blood-2011-12-395350. [DOI] [PubMed] [Google Scholar]
- 94.Wang J, Saunthararajah Y, Redner RL, Liu JM. Inhibitors of histone deacetylase relieve ETO-mediated repression and induce differentiation of AML1-ETO leukemia cells. Cancer Res. 1999;59(12):2766–2769. [PubMed] [Google Scholar]
- 95.Reich M, Liefeld T, Gould J, Lerner J, Tamayo P, Mesirov JP. GenePattern 2.0. Nat Genet. 2006;38(5):500–501. doi: 10.1038/ng0506-500. [DOI] [PubMed] [Google Scholar]
- 96.Goode DK, et al. Dynamic gene regulatory networks drive hematopoietic specification and differentiation. Dev Cell. 2016;36(5):572–587. doi: 10.1016/j.devcel.2016.01.024. [DOI] [PMC free article] [PubMed] [Google Scholar]
- 97.Lerdrup M, Johansen JV, Agrawal-Singh S, Hansen K. An interactive environment for agile analysis and visualization of ChIP-sequencing data. Nat Struct Mol Biol. 2016;23(4):349–357. doi: 10.1038/nsmb.3180. [DOI] [PubMed] [Google Scholar]
- 98.Riddell J, et al. Reprogramming committed murine blood cells to induced hematopoietic stem cells with defined factors. Cell. 2014;157(3):549–564. doi: 10.1016/j.cell.2014.04.006. [DOI] [PMC free article] [PubMed] [Google Scholar]
Associated Data
This section collects any data citations, data availability statements, or supplementary materials included in this article.


