

Abstract
Tumor relapse is the leading cause of death in breast cancer, largely due to the fact that recurrent tumors are frequently resistant to chemotherapy. We previously reported that downregulation of the proapoptotic protein Par-4 promotes tumor recurrence in genetically engineered mouse models of breast cancer recurrence. In the present study, we examined the mechanism and functional significance of Par-4 downregulation in recurrent tumors. We found that epithelial-to-mesenchymal transition (EMT) promotes epigenetic silencing of Par-4 in recurrent tumors. Par-4 silencing proceeded through binding of the EMT transcription factor Twist to the Par-4 promoter, where Twist induced a unique bivalent chromatin domain. This bivalent configuration conferred plasticity at the Par-4 promoter, and Par-4 silencing could be reversed with pharmacologic inhibitors of Ezh2 and HDAC1/2. Using an epigenome editing approach to reexpress Par-4 by specifically reversing the histone modifications found in recurrent tumors, we found that Par-4 reexpression sensitized recurrent tumors to chemotherapy in vitro and in vivo. Upon reexpression, Par-4 bound to the protein phosphatase PP1, caused widespread changes in phosphorylation of cytoskeletal proteins, and cooperated with microtubule-targeting drugs to induce mitotic defects. These results identify Twist-induced epigenetic silencing of Par-4 as a targetable axis that promotes chemoresistance in recurrent breast cancer.
Keywords: Oncology
Keywords: Apoptosis pathways, Breast cancer, Epigenetics
Introduction
Breast cancer remains the second-leading cause of cancer-related deaths among women in the United States, with an expected 40,920 deaths in 2018 (1). Although adjuvant therapies, including cytotoxic chemotherapy and molecularly targeted therapies, have reduced the mortality associated with breast cancer, up to 25% of patients will develop tumor relapse (2, 3). Mortality from breast cancer is largely due to the emergence of recurrent tumors that are resistant to treatment (4).
Multiple lines of evidence suggest that the epithelial-to-mesenchymal transition (EMT) promotes recurrence and chemoresistance in breast cancer (5). In cell culture models, the induction of EMT promotes cell survival in response to cytotoxic chemotherapies (6–8). In a mouse model for breast cancer, overexpression of the EMT transcription factor Snail accelerates recurrence following Her2 inhibition (9), and EMT has been shown to promote chemoresistance in mouse models of breast cancer (10) and pancreatic cancer (11). Furthermore, patient data support a role for EMT in promoting chemoresistance. Residual, treatment-resistant breast cancer cells acquire EMT characteristics following chemotherapy (12), and expression of EMT markers on circulating or disseminated tumor cells is associated with a poor prognosis (5, 13). Taken together, these findings suggest that EMT promotes chemoresistance in recurrent breast cancer. However, the specific mechanisms underlying chemoresistance in recurrent tumors remain understudied. Understanding these mechanisms is essential to developing novel strategies to resensitize chemoresistant tumors and improve clinical outcomes for patients with recurrent tumors.
Using a genetically engineered mouse (GEM) model that recapitulates key features of breast cancer recurrence, we previously showed that the tumor suppressor Par-4 (prostate apoptosis response 4, also known as Pawr, or proapoptotic WT1 regulator) is downregulated in recurrent tumors that arise following targeted Her2 withdrawal or chemotherapy administration (14). Mechanistically, we found that Par-4 downregulation accelerates recurrence by promoting residual tumor cell survival in mice and in breast cancer patients following neoadjuvant chemotherapy (14). However, the mechanism of Par-4 downregulation remains unexplored, as does any function for Par-4 in regulating the response of recurrent tumors to chemotherapy. In light of the fact that Par-4 is a proapoptotic protein that is required for cell death in response to chemotherapies (15, 16), and because recurrence in these GEM models is associated with EMT (9), we hypothesized that Par-4 downregulation may provide a mechanistic link between EMT and chemoresistance in recurrent tumors.
In the present study we used these GEM models to examine the mechanism and functional significance of Par-4 downregulation in recurrent tumors. We found that Par-4 is downregulated in recurrent tumors by direct recruitment of the EMT transcription factor Twist to the Par-4 promoter. Twist induces Par-4 silencing through a noncanonical mechanism that involves acquisition of a bivalent configuration at the Par-4 promoter, in which both the active histone modification H3K4me3 and the repressive modification H3K27me3 are present. The bivalent Par-4 promoter in recurrent tumors is in a poised state, and Par-4 can be reexpressed using inhibitors of histone deacetylases (HDACs) 1 and 2 and the histone methyltransferase Ezh2. Functionally, we found that specific reexpression of Par-4 in recurrent tumors using epigenome editing sensitizes these tumors to microtubule-targeting chemotherapy both in vitro and in vivo. Our data suggest that Par-4 downregulation represents one possible link between EMT and chemoresistance in recurrent breast cancer. Epigenetic therapies designed to reexpress Par-4 may sensitize treatment-resistant recurrent tumors to chemotherapies, improving the survival of patients with recurrent breast cancer.
Results
Par-4 downregulation is associated with EMT during breast cancer recurrence.
We have previously used mouse mammary tumor models with inducible expression of Her2 (17), Myc (18), or Wnt1 (19) to study mechanisms of mouse breast cancer recurrence. We showed that in these models tumor recurrence is invariably associated with downregulation of the proapoptotic protein Par-4, and Par-4 downregulation promotes recurrence (14). To investigate the mechanisms underlying Par-4 downregulation in recurrent tumors, we generated a panel of primary and recurrent tumors from MMTV-rtTA;TetO-HER2/neu (MTB;TAN) mice (17). Doxycycline (dox) administration to MTB;TAN mice led to the development of primary invasive mammary adenocarcinomas (Figure 1A). One cohort of mice was sacrificed with primary tumors; a second cohort of mice was removed from dox to induce tumor regression, and mice were monitored for the development of recurrent tumors. Approximately 85% of mice with regressed tumors developed Her2-independent recurrent tumors with a median recurrence latency of 154 days (Figure 1, A–C). Primary and recurrent tumors were harvested for molecular analyses or digested to generate tumor cell cultures.
Figure 1. Recurrent tumors downregulate Par-4 and undergo EMT.

(A) Representative tumor volume curves showing primary tumor formation following dox administration, tumor regression following dox withdrawal, and spontaneous tumor recurrence in MTB;TAN mice. (B) Kaplan-Meier plots showing recurrence-free survival following doxycycline withdrawal in a large cohort (n = 39) of MTB;TAN tumors. (C) qPCR analysis of the Her2/neu transgene in primary (n = 7) and recurrent (n = 7) MTB;TAN tumors. (D) Western blot showing the expression of Par-4 and EMT markers in a panel of primary and recurrent MTB;TAN tumors. (E) qPCR analysis of Par-4 in primary (n = 7) and recurrent (n = 7) MTB;TAN tumors. (F) Western blot showing the expression of Par-4 and EMT markers in cultured cells derived from primary and recurrent MTB;TAN tumors. (G) Representative micrographs (original magnification: ×10) of primary and recurrent tumor cells showing morphological evidence of EMT in recurrent tumor cells. Error bars denote mean ± SEM, ***P < 0.001. Significance determined by Student’s t test.
Several pieces of evidence suggest that recurrent tumors arising in these mice are bona fide recurrent tumors derived from residual tumor cells that survive Her2 downregulation, rather than de novo tumors that arise spontaneously. First, doxycycline-naive MTB;TAN mice do not form spontaneous tumors (Supplemental Figure 1A; supplemental material available online with this article; https://doi.org/10.1172/JCI99481DS1), suggesting that recurrent tumors form as a consequence of Her2 expression and primary tumorigenesis. Second, we used an orthotopic transplant model in which fluorescently labeled primary tumor cells from MTB;TAN mice are injected into mammary fat pads of recipient mice on dox. Following primary tumor formation, dox withdrawal leads to tumor regression, and recurrent tumors arise with similar kinetics to the autochthonous model (Supplemental Figure 1B). Importantly, these recurrent orthotopic tumors retain the fluorescent label (Supplemental Figure 1C), indicating that they are derived from primary tumors.
Consistent with previous results, Western blot and quantitative PCR (qPCR) analysis of primary and recurrent MTB;TAN tumors showed that all recurrent tumors had downregulated Par-4 protein (Figure 1D) and mRNA (Figure 1E). Importantly, tumor recurrence in the orthotopic model is also accompanied by Par-4 downregulation (Supplemental Figure 1D). To gain insight into the mechanism of Par-4 downregulation, we first considered the observation that recurrent tumors arising in MTB;TAN mice undergo EMT (17). Given that EMT is accompanied by widespread epigenetic and gene expression changes (20), we hypothesized that Par-4 downregulation may be a result of EMT. Consistent with this hypothesis, recurrent tumors had silenced the epithelial protein E-cadherin and upregulated the mesenchymal intermediate filament protein vimentin (Figure 1D). Recurrent tumors had also upregulated the EMT transcription factors Snail and Twist (Figure 1D). These results indicate that Par-4 downregulation is associated with EMT in recurrent mouse mammary tumors.
Par-4 downregulation is associated with EMT in human breast cancer.
We next asked whether Par-4 downregulation is associated with EMT in human breast cancer. To approach this question, we first tested whether Par-4 downregulation is correlated with a genetic signature of EMT using RNA-seq data from a panel of 86 human breast cancer cell lines (21). We ranked genes on the basis of their correlation with Par-4 and then performed gene set enrichment analysis (GSEA) to identify pathways associated with low Par-4 expression. A signature for EMT (HALLMARK_EPITHELIAL_MESENCHYMAL_TRANSITION) was the gene set most significantly associated with Par-4 downregulation (Supplemental Figure 2A; P < 0.001, Normalized Enrichment Score = –2.07335). Furthermore, mesenchymal or mesenchymal-related gene sets represented 4 of the top 10 curated GSEA pathways associated with Par-4 downregulation (Supplemental Table 1).
We next examined the correlation between Par-4 expression and the expression of individual epithelial (Cdh1, Krt8, Krt18, Cldn7, Cldn3, Cldn4) or mesenchymal genes (Snai1, Zeb1, Twist1, Zeb2, Vim, Snai2). Par-4 expression was positively correlated with a subset of epithelial genes, and negatively correlated with all the mesenchymal genes (Supplemental Figure 2B) in breast cancer cell lines. To extend this analysis, we analyzed RNA-seq data of human breast cancers from The Cancer Genome Atlas (TCGA) (22). Par-4 expression was positively correlated with E-cadherin and negatively correlated with EMT transcription factors Twist1, Twist2, and Snail (Supplemental Figure 2C). In both the cell line and tumor data sets, unsupervised hierarchical clustering separated epithelial and mesenchymal genes, and Par-4 clustered with the epithelial genes (Supplemental Figure 2, B and C). Taken together, these results suggest that Par-4 downregulation is associated with EMT in human breast cancer.
EMT transcription factors Twist and Snail downregulate Par-4.
In light of the association between Par-4 downregulation and EMT in recurrent mouse tumors and primary human breast cancers, we hypothesized that EMT may directly lead to Par-4 downregulation. To provide a tractable system to investigate the mechanisms underlying Par-4 downregulation, we isolated tumor cells from 2 primary tumors and 2 recurrent tumors. Cells cultured from these tumors resembled intact tumors: recurrent tumor cells had lower expression of Par-4 and E-cadherin, and higher expression of vimentin, Snail, and Twist, as compared with primary tumor cells (Figure 1F). In addition, whereas primary tumor cells exhibited an epithelial morphology, recurrent tumor cells adopted a spindle-shaped morphology characteristic of EMT (Figure 1G). Thus, cells derived from primary and recurrent tumors maintain the molecular and morphologic characteristics of the tumors from which they were derived, and provide a suitable model for studying Par-4 regulation.
We induced EMT in primary tumor cells using TGF-β, which signals through SMAD transcription factors to induce the expression of EMT transcription factors such as Zeb1, Twist, and Snail (23). Treatment of primary tumor cells with TGF-β led to the acquisition of an elongated, spindle-cell morphology (Figure 2A), confirming that TGF-β induces EMT in these cells. Furthermore, TGF-β treatment led to a decrease in E-cadherin expression, and an increase in expression of vimentin, Snail, and Twist (Figure 2B). We then examined Par-4 expression and found that Par-4 protein (Figure 2B) and mRNA (Figure 2C) levels were decreased following induction of EMT by TGF-β. These results suggest that TGF-β–induced EMT is accompanied by Par-4 downregulation.
Figure 2. EMT is sufficient to suppress Par-4 expression.

(A) Immunofluorescence staining for E-cadherin (red) or vimentin (green) in primary tumor cells treated with either PBS or 10 ng/ml TGF-β (original magnification: ×10). (B) Western blot showing the expression of Par-4 and the EMT markers E-cadherin, vimentin, Twist, and Snail in primary tumor cells treated with vehicle or 10 ng/ml TGF-β. (C) qPCR analysis of Par-4, E-cadherin, and vimentin transcripts in primary tumor cells treated with vehicle or 10 ng/ml TGF–β. Results are shown as mean ± SEM relative to the vehicle in primary tumor cell line 1.
We next sought to dissect the specific EMT transcription factors that mediate Par-4 downregulation. EMT is driven by the coordinate action of several transcription factors, including Snail, Slug, Twist, Zeb1, and Zeb2 (6, 24). Notably, Snail and Twist have been shown to promote EMT in breast cancer and are correlated with poor clinical outcome (9, 25, 26). To evaluate whether Snail and/or Twist transcription factors are sufficient to repress Par-4 expression, we transduced 2 primary tumor cell lines with retrovirus expressing Twist, Flag-tagged Snail, or an empty vector as a control. Twist expression induced EMT in both primary tumor cell lines, as evidenced by decreased E-cadherin and increased vimentin expression (Figure 3, A–C). Twist expression in both cell lines was accompanied by downregulation of Par-4 protein (Figure 3B) and mRNA (Figure 3C). Similar to Twist, ectopic Snail expression resulted in decreased expression of E-cadherin and increased expression of vimentin (Figure 3, D–F), confirming the induction of EMT, as well as a reduction in Par-4 protein (Figure 3E) and mRNA levels (Figure 3F). The magnitude of Par-4 mRNA repression by Twist and Snail was similar to the repression of E-cadherin mRNA, a bona fide target of these transcription factors (Figure 3, C and F) (27, 28). Interestingly, expression of Twist and Snail in primary cell line 2 induced substantial reductions in E-cadherin mRNA levels, but only a partial reduction in E-cadherin protein (Figure 3B vs. Figure 3C, and Figure 3E vs. Figure 3F). Although the basis for this discrepancy is unknown, this may suggest that primary cell line 2 undergoes a partial EMT program in response to Snail and Twist expression (29). Taken together, these results indicate that the EMT transcription factors Twist and Snail are sufficient to induce Par-4 downregulation in primary tumor cells.
Figure 3. Snail and Twist directly suppress Par-4 expression.

(A) qPCR analysis showing Twist expression in primary tumor cells transduced with retrovirus expressing Twist or an empty vector as a control. (B) Western blot showing the expression of Par-4, E-cadherin, vimentin, and Twist in control and Twist-expressing primary tumor cells. (C) qPCR analysis of Par-4, E-cadherin, and vimentin expression in control and Twist-expressing primary tumor cells. (D) qPCR analysis showing Snail expression in primary tumor cells transduced with retrovirus expressing Snail or an empty vector as a control. (E) Western blot showing the expression of Par-4, E-cadherin, vimentin, and Snail in control and Snail-expressing primary tumor cells. (F) qPCR analysis of Par-4, E-cadherin, and vimentin expression in control and Snail-expressing primary tumor cells. (G) ChIP analysis of Twist occupancy at the Par-4 promoter, the E-cadherin promoter, and at a gene desert on chromosome 12. Data are presented as fold enrichment over IgG IP. Error bars denote mean ± SEM.
To determine whether Par-4 is a direct transcriptional target of Twist and Snail, we next asked whether these transcription factors directly bind to the Par-4 promoter. To investigate this, we performed chromatin immunoprecipitation followed by qPCR (ChIP-qPCR) with antibodies against Twist or the Flag epitope on Snail. Immunoprecipitated DNA was amplified with a primer set targeting approximately 400 bp upstream of the Par-4 transcriptional start site (TSS). We were unable to detect Snail enrichment at either the Par-4 promoter or at the E-cadherin promoter, suggesting that Snail may regulate these genes indirectly, possibly through upregulation of Twist (data not shown). In contrast, we found that Twist binding was enriched approximately 3.5-fold at the upstream region of the Par-4 promoter in Twist-expressing cells, similar to the magnitude of Twist enrichment at the E-cadherin promoter (27) (Figure 3G). We did not observe enrichment of Twist at the TSS of Par-4, or at a gene desert region on chromosome 12 (data not shown and Figure 3G). Taken together, we conclude that Twist binds directly to the Par-4 promoter, and this is associated with Par-4 repression.
EMT is necessary for Par-4 downregulation in recurrent tumors.
We next sought to determine whether EMT is required to maintain Par-4 downregulation in recurrent tumor cells. Knockdown of Snail and Twist individually was unable to revert EMT (data not shown), suggesting that these transcription factors have redundant functions in the maintenance of EMT (30, 31). In contrast, NF-κB signaling is required for both the induction and maintenance of EMT in breast cancer (32). Therefore, we tested whether inhibition of NF-κB could reverse EMT, and whether this was associated with Par-4 upregulation. We transduced 2 recurrent tumor cell lines with a lentivirus expressing dominant-negative IκB, in which serines 32 and 36 were mutated to alanine (IκB S32/36A). These mutations prevent IκB kinase–dependent (IKK-dependent) phosphorylation and degradation of IκB, thereby sequestering NF-κB subunits p50 and RelA in the cytosol and inhibiting downstream NF-κB signaling (33). We confirmed that dominant-negative IκB expression in recurrent tumor cells inhibited NF-κB signaling, as evidenced by the stabilization of IκB, loss of IκB phosphorylation, and a decrease in the expression of a panel of NF-κB target genes (Figure 4, A and B). Inhibition of the NF-κB pathway reversed EMT — cells adopted an epithelial morphology (Figure 4C) and the expression of mesenchymal genes decreased, whereas the expression of E-cadherin increased (Figure 4, A and B). We next examined Par-4 expression and found that the reversal of EMT through inhibition of the NF-κB pathway led to a profound increase in Par-4 (Figure 4A). Notably, the reversal of EMT and reexpression of Par-4 was stronger in recurrent cell line 1, suggesting that EMT maintenance in recurrent tumor cell line 2 may be partly independent of the NF-κB pathway.
Figure 4. EMT is required for Par-4 downregulation in recurrent tumors.

(A) Western blot showing the expression of Par-4, E-cadherin, IκB, and p-IκB (S32) in recurrent tumor cells expressing a dominant-negative IκB mutant (S32/36A). (B) qPCR analysis of EMT markers (Vim, Snail, Twist, Cdh1) and NF-κB target genes (Bcl2, Ccl5, Vcam, Mmp2, Mmp9, Mmp13) in recurrent tumor cells expressing a dominant-negative IκB mutant protein. (C) Representative micrographs (original magnification: ×10) of recurrent tumor cells expressing an empty vector or a dominant-negative IκB mutant (S32/S36A). Error bars denote mean ± SEM.
Having demonstrated that EMT is associated with Par-4 downregulation, we next asked whether Par-4 expression regulates EMT. To do this, we expressed Par-4 in recurrent tumor cells using an inducible system in which Par-4 is fused to a destabilizing domain from FKBP12 (L106P-Par-4). The synthetic ligand Shld1 rapidly stabilizes L106P-Par-4 in a concentration-dependent manner. We previously identified a Shld1 concentration that restores Par-4 expression in recurrent tumor cells to levels similar to those observed in primary tumors (14) (Supplemental Figure 3A). Par-4 reexpression in recurrent tumor cells did not reverse expression of EMT markers or inhibit the expression of NF-κB targets (Supplemental Figure 3B). Furthermore, ectopic expression of Par-4 in Twist-transformed primary tumor cells also failed to reverse EMT (Supplemental Figure 3, C and D) or decrease NF-κB target genes (Supplemental Figure 3E). Taken together, these results indicate that maintenance of EMT through continued NF-κB signaling is required for Par-4 downregulation in recurrent tumor cells, but Par-4 reexpression does not influence the maintenance of EMT.
Twist represses Par-4 expression by inducing bivalent histone modifications.
EMT transcription factors regulate gene expression by binding to target genes and recruiting epigenetic regulators, including histone modifying enzymes and DNA methyltransferases, to alter the pattern of active and repressive marks at these promoters (20). For example, Snail can recruit the histone methyltransferases G9a and PRC2 to the E-cadherin promoter, which then deposits repressive methylation marks at H3K9 (H3K9me2/3) and H3K27 (H3K27me3), respectively (25). Alternatively, recruitment of histone deacetylase–containing (HDAC-containing) complexes, such as NuRD and Sin3a, can repress genes through removing the active acetylation mark at H3K9 (H3K9ac) and H3K27 (H3K27ac) (34). In some cases, repressive histone modifications are also associated with recruitment of DNA methyltransferases (DNMTs), which induce cytosine methylation in CpG dinucleotides of promoters to induce stable gene silencing. Given that Twist directly binds to the Par-4 promoter to repress Par-4 expression, we next wished to identify the epigenetic modifications underlying this repression. Because the mechanism of E-cadherin silencing during EMT has been extensively studied, we examined the E-cadherin promoter as a control for these experiments.
The Par-4 promoter contains a CpG island that was previously found to be methylated in endometrial tumors and in Ras-transformed fibroblasts (35, 36). We therefore asked whether Par-4 is silenced in recurrent tumor cells through DNA promoter hypermethylation. We used bisulfite sequencing to examine methylation of the Par-4 and E-cadherin promoters in 2 primary and 2 recurrent tumor cell lines. We found that a CpG island in the E-cadherin promoter was hypermethylated in recurrent but not primary tumor cells (Figure 5A); this region of the E-cadherin promoter has previously been shown to be methylated following EMT (37). In contrast, there was a low level of CpG methylation in the Par-4 promoter in primary tumor cells, and this did not increase in recurrent tumor cells (Figure 5A). These results indicate that promoter hypermethylation does not contribute to Par-4 repression in recurrent tumors, and further suggest that Par-4 and E-cadherin are repressed through different mechanisms in recurrent tumors.
Figure 5. Par-4 is epigenetically repressed in recurrent tumors through bivalent histone modifications.

(A) Methylation of CpG dinucleotides (circles) within the region surrounding the TSS of Par-4 (–1 to +248) or the TSS of the E-cadherin promoter (–217 to +148). Bisulfite-treated DNA from primary and recurrent tumor cells was transformed into bacteria and 10 replicate colonies were sequenced (rows). Open circles denote unmethylated CpG dinucleotides, closed circles denote methylated CpG dinucleotides. (B) ChIP-qPCR analysis showing enrichment of histone marks H3K4me3, H3K9ac, H3K27me3, H3K9me2, and RNApol2 within the Par-4 promoter (left) in primary and recurrent tumor cells. The E-cadherin promoter (right) is shown to demonstrate the pattern of histone modification at a stably silenced gene. (C) ChIP-seq analysis showing enrichment of histone marks H3K4me3, H3K9ac, H3K27me3, and RNApol2 at the Par-4 promoter in primary and recurrent tumor cells. (D) ChIP-qPCR analysis showing enrichment of histone marks H3K4me3, H3K9ac, H3K27me3, H3K9me2, and RNApol2 at the Par-4 promoter (left) in control or Twist-expressing primary cell line 1. Enrichments for the E-cadherin promoter (right) is included as a control. (E) Western blot analysis showing Par-4 expression in recurrent tumor cells treated for 48 hours with inhibitors of EZH2 (1 μM EPZ6438) or HDACs (1 μM SAHA), either alone or in combination. Primary tumor cell lysate is shown as a control for Par-4 expression. Error bars denote mean ± SEM.
We next sought to characterize the histone modifications present at the Par-4 and E-cadherin promoters in recurrent tumor cells. We performed ChIP for the active marks H3K9ac and H3K4me3 and the repressive marks H3K27me3 and H3K9me2 (38–40). We also measured RNA Pol II occupancy as a measure of transcriptional activity. Consistent with the published data on E-cadherin silencing (20), we found that in recurrent cells the E-cadherin promoter exhibited a loss of both active marks, and a reciprocal gain of both repressive marks (Figure 5B, right). In contrast, ChIP analysis of these marks at the Par-4 promoter showed a loss of the active mark H3K9ac in recurrent cells, but no decrease in the active mark H3K4me3 (Figure 5B). Similarly, the repressive modification H3K27me3 was increased at the Par-4 promoter in recurrent cells, whereas levels of the H3K9me2 modification were low but variable in recurrent cells (Figure 5B). In light of this variability, we examined H3K9me2 levels in a larger cohort of primary and recurrent tumor cells, and found that levels of this repressive mark at the Par-4 promoter were not significantly increased in recurrent tumor cells (Supplemental Figure 4, A–C). Together, these results suggest that altered histone modifications at the Par-4 promoter (specifically, a reduction in H3K9ac and an increase in H3K27me3) are responsible for epigenetic silencing in recurrent tumors. Furthermore, these results suggest that the Par-4 promoter is in a bivalent state in recurrent cells, in which both active (H3K4me3) and repressive (H3K27me3) marks are present (41). The presence of both active and repressive marks at the Par-4 promoter was confirmed by genome-wide ChIP-seq analysis (Figure 5C). This bivalent configuration is consistent with the low levels of H3K9me2 and the lack of increase in CpG methylation at the Par-4 promoter in recurrent cells; both of these are associated with more permanent repressive states (e.g., at the E-cadherin promoter), and their absence suggests that Par-4 silencing may be readily reversible in recurrent cells (42).
Next, we sought to determine whether Twist expression in primary tumor cells also induces a bivalent configuration at the Par-4 promoter. We performed ChIP for active and repressive marks in primary tumor cells transduced with Twist or an empty vector. Twist expression led to a loss of all active marks and a gain in repressive marks at the E-cadherin promoter (Figure 5D, right). In contrast, Twist expression induced a bivalent configuration at the Par-4 promoter, with high levels of both H3K4me3 and K3K27me3 (Figure 5D, left). Distinct from recurrent tumor cells, Twist-expressing cells exhibited an increase in H3K9me2 levels at the Par-4 promoter, suggesting that Twist expression by itself does not fully recapitulate the mechanism of Par-4 silencing in recurrent tumors. Taken together, these data suggest that Twist directly binds to the Par-4 promoter and induces bivalent histone modifications to repress Par-4 transcription in recurrent tumors.
Par-4 silencing in recurrent tumors can be reversed with pharmacologic inhibitors.
The finding that the Par-4 promoter is in a bivalent configuration in recurrent tumor cells suggested that Par-4 silencing might be readily reversible. We next evaluated whether pharmacologic agents that restored H3K9 acetylation (H3K9ac) or blocked H3K27 methylation (H3K27me3) would reverse Par-4 silencing. Recurrent tumor cells were treated with the pan-HDAC inhibitor SAHA (vorinostat) or the EZH2 inhibitor EPZ6438 (tazemetostat), and Par-4 levels were measured by Western blot. EPZ6438 treatment led to a modest upregulation of Par-4, whereas SAHA treatment induced more profound Par-4 upregulation, producing levels equivalent to those found in primary tumors (Figure 5E). Similar results were obtained with the selective HDAC1/2 inhibitor romidepsin (Supplemental Figure 5A). In contrast, treatment with SAHA or EPZ6438 induced only a slight increase in E-cadherin expression in recurrent tumors (Supplemental Figure 5B and data not shown). In fact, treatment with both SAHA and 5-aza-dC, a DNMT inhibitor, was required to reexpress E-cadherin in recurrent tumor cells, and even this combined treatment led to only modest E-cadherin upregulation (Supplemental Figure 5B). Taken together, these results suggest that the bivalent mode of Par-4 silencing in recurrent tumors renders it relatively more accessible to reexpression through pharmacological inhibitors, compared with a more stably silenced gene, such as E-cadherin.
Par-4 reexpression sensitizes recurrent tumors to microtubule-targeting drugs.
Par-4 expression is required for cell death in response to a number of chemotherapeutic agents, including doxorubicin (43), vincristine (44), and 5-FU (16). In light of our finding that Par-4 is downregulated following EMT, we speculated that Par-4 silencing might provide a novel mechanism of chemoresistance in recurrent tumors that have undergone EMT. To address this, we first asked whether recurrent tumors arising in MTB;TAN mice are resistant to chemotherapy, and then tested whether Par-4 silencing is functionally important for mediating this resistance.
We previously showed that primary orthotopic MTB;TAN tumors are sensitive to a chemotherapy regimen consisting of Adriamycin, Cytoxan, and Taxol (AC+T), which is commonly used to treat patients with breast cancer (14). To determine if recurrent MTB;TAN tumors are more resistant to chemotherapy, we compared the response of orthotopic primary and recurrent tumors to this chemotherapy regimen. Primary or recurrent tumor cells were injected orthotopically into mice and AC+T treatment was initiated when tumors reached 5 mm in diameter. In contrast to primary tumors, orthotopic recurrent tumors exhibited only modest responses to the AC+T regimen. The majority of tumors reached study endpoint within 20 days, and none of the mice survived long enough to complete therapy (Figure 6A). In contrast, all orthotopic primary tumors survived through AC+T, with a median survival of 31 days (Figure 6A). This suggests that recurrent tumors are relatively resistant to chemotherapy as compared with primary tumors.
Figure 6. Par-4 reexpression sensitizes recurrent tumor cells to microtubule-targeting drugs.

(A) Kaplan-Meier survival curves for mice injected with recurrent tumor cell line 1 (black) or primary tumor cell line 1 (red) and treated with the chemotherapy regimen AC+T (n = 12 recurrent tumors, n = 9 primary tumors) or vehicle (n = 6 recurrent tumors, n = 8 primary tumors). Significance was evaluated using the Mantel-Cox log-rank test. (B and C) Concentration response curves for recurrent tumor cell line 1 with inducible Par-4 expression treated with increasing concentrations of docetaxel (B) or vincristine (C) in the absence (–Shld1) or presence (+Shld1) of Par-4 expression. The IC50 is shown with 95% confidence intervals. Significance was evaluated by Student’s unpaired t test. (D) Cell viability of recurrent tumor cell line 1 with inducible Par-4 expression (top) treated with vehicle (left), 10 nM docetaxel (middle), or 8 nM vincristine (right) in the absence (–Shld1) or presence (+Shld1) of Par-4 expression. Recurrent tumor cells with inducible YFP expression (bottom) are shown to control for the effects of Shld1 administration. (E and F) Growth curves for recurrent tumor cell treated with either 10 nM docetaxel (E) or 8 nM vincristine (F) in the absence (–Shld1) or presence (+Shld1) of Par-4 expression. Significance was evaluated by 3-way ANOVA (Shld1 × drug × time). Asterisks show statistical significance between drug treatment with or without Shld1. Error bars denote mean ± SEM. *P < 0.05, **P < 0.01, ***P < 0.001.
We next asked whether Par-4 silencing may partially mediate this chemoresistance. To address this, we tested the effect of reexpressing Par-4 with the inducible L106P-Par-4 system to evaluate the response of recurrent tumor cells to chemotherapy in vitro. Recurrent tumor cells were treated with increasing concentrations of the microtubule-targeting drugs vincristine or docetaxel in the presence or absence of Shld1, and cell viability was measured. Par-4 reexpression sensitized recurrent tumor cells to both drugs, resulting in an approximately 8-fold increase in the potency of docetaxel (IC50 for vehicle control, 72 nM [95% CI, 22.5–287 nM]; IC50 for Shld1, 9.3 nM [95% CI, 3.47–21.5 nM]; P = 0.01) and an approximately 2-fold increase in the potency of vincristine (IC50 for vehicle control, 8.3 nM [95% CI, 5.9–11.9 nM]; IC50 for Shld1, 4.2 nM [95% CI, 3.08–5.87 nM]; P = 0.006) (Figure 6, B and C). We next performed assays examining the effect of Par-4 expression on cell survival in response to low therapeutic doses of docetaxel or vincristine. Treatment with Shld1 or each chemotherapeutic drug alone had minimal effects on cell viability (Figure 6, D–F and Supplemental Figure 6A). In contrast, Par-4 expression dramatically increased cell death in response to these drugs (Figure 6, D–F and Supplemental Figure 6A). Notably, the vast majority of recurrent tumor cells was killed by a low dose of docetaxel in the presence of Par-4 expression (Figure 6, D and E). Importantly, Shld1 administration to recurrent tumor cells expressing a control construct (L106P-YFP) had minimal effect on cell viability in response to chemotherapy, confirming that chemosensitization was mediated through Par-4 expression and not due to off-target effects of Shld1 (Figure 6D and Supplemental Figure 6B).
EMT can promote resistance to chemotherapy by altering the expression of a number of pro- and antiapoptotic genes (23, 45). To gain insight into whether additional genes may mediate chemoresistance in recurrent tumors, we examined the expression of a panel of apoptotic genes in 2 primary and 2 recurrent tumor cell lines. None of the antiapoptotic genes was upregulated in recurrent tumor cells (Supplemental Figure 7). Among proapoptotic genes, Par-4 and Bik were consistently downregulated in recurrent tumor cells (Supplemental Figure 7), suggesting that the silencing of Par-4 in recurrent tumors is specific and not observed for all proapoptotic genes. Taken together, these results indicate that Par-4 reexpression sensitizes recurrent tumor cells to cytotoxic chemotherapies, and suggest that Par-4 silencing mediates chemoresistance of these recurrent tumor cells.
Par-4 reexpression sensitizes recurrent tumors to microtubule-targeting chemotherapy in vivo.
We next sought to reexpress endogenous Par-4 using a novel epigenetic engineering approach. This approach utilizes a catalytically dead Cas9 nuclease fused to the histone acetyltransferase core of p300 (dCas9-p300). In the presence of a single guide RNA (sgRNA) targeting a gene’s promoter, the dCas9-p300 complex localizes to the target gene promoter and acetylates H3K27 and H3K9, thereby promoting the transcription of that gene (46). We infected recurrent tumor cell line 2 with lentivirus expressing dCas9-p300 and 1 of 2 sgRNAs targeting the Par-4 promoter (sgPar-4/1 or sgPar-4/2), or a nontargeting sgRNA as a control (NT). Importantly, the sgRNAs targeting Par-4 were specifically designed for a region of the Par-4 promoter that is hypoacetylated in recurrent tumors, such that this editing approach directly reverses the epigenetic modifications that mediate Par-4 silencing in recurrent tumors. Expression of each sgRNA resulted in robust reexpression of Par-4 protein (Figure 7A) and mRNA (Figure 7B). Furthermore, ChIP analysis confirmed that sgRNA expression led to increased acetylation of H3K9 and H3K27 at the Par-4 promoter (Figure 7C).
Figure 7. Epigenome editing to reverse Par-4 silencing prolongs survival of mice with recurrent tumors.

(A and B) Western blot (A) and qPCR (B) analysis of Par-4 expression in recurrent tumor cells expressing dCas9-p300 and either a control sgRNA (NT) or 1 of 2 sgRNAs targeting the Par-4 promoter. (C) ChIP-qPCR showing H3K9ac and H3K27ac enrichment at the Par-4 promoter in recurrent tumor cells expressing dCas9-p300 and a nontargeting sgRNA or 1 of 2 sgRNAs targeting the Par-4 promoter. (D) Schema of AC+T treatment in the orthotopic model. A total of 12 mice were injected bilaterally into the fourth mammary glands. Once tumors reached approximately 75 mm3, mice were randomized into either untreated (n = 3 mice, 6 tumors per cohort) or AC+T (n = 9 mice, 18 tumors per cohort) groups. Mice were sacrificed once tumors reached at least 1,800 mm3 in size. (E) Mean growth rate measurements for treatment-naive recurrent tumors expressing control sgRNA (NT) or 1 of 2 sgRNAs targeting the Par-4 promoter. P values were calculated by 1-way ANOVA and Tukey’s post hoc test. (F) Area under the curve measurements for chemotherapy-treated recurrent tumors expressing control sgRNA (NT) or 1 of 2 sgRNAs targeting the Par-4 promoter. P values were calculated by 1-way ANOVA and Tukey’s post hoc test. Differences between experimental and control tumors are shown. (G) Kaplan-Meier plots showing endpoint survival of recurrent tumors expressing a control sgRNA (NT) or sgRNAs targeting the Par-4 promoter. P values, hazards ratios, and 95% confidence intervals are indicated as compared with sgNT. Statistical significance was determined by Mantel-Cox log rank test. Note that the survival curve for the control cohort (NT) represents the same tumors as shown in the black dashed line in Figure 6A. (H) qPCR analysis of Par-4 expression in untreated and treated orthotopic recurrent tumors expressing sgNT, sgPar-4/1, or sgPar-4/2. Significance was determined by 1-way ANOVA and Tukey’s post hoc test. Error bars denote mean ± SEM.
We next injected recurrent tumor cells expressing control NT sgRNA, sgPar-4/1, or sgPar-4/2 into the fourth mammary gland of recipient nu/nu mice and allowed tumors to form. Following tumor formation, mice were left untreated or treated with a clinically relevant chemotherapy regimen consisting of Adriamycin (doxorubicin) and Cytoxan (cyclophosphamide) (AC) for 2 weeks, followed by Taxol (paclitaxel) (T) for 2 weeks (Figure 7D). Par-4 reexpression was maintained in tumors not exposed to AC+T, though the magnitude of Par-4 reexpression in sgPar-4/1 and sgPar-4/2 tumors in vivo was somewhat blunted as compared with tumor cells in vitro, perhaps reflecting stromal contribution to Par-4 levels in vivo (Supplemental Figure 8A). Consistent with this, Par-4 reexpression in the absence of chemotherapy did not significantly affect the growth rate of these tumors (Figure 7E). In contrast, in the presence of chemotherapy, reexpression of Par-4 with sgPar-4/1 slowed tumor growth and improved the survival of mice as compared with control tumors (Figure 7, F and G and Supplemental Figure 8B). Similar results were obtained with cells expressing sgPar-4/2, though the effects observed with this sgRNA did not reach statistical significance (Figure 7, F and G and Supplemental Figure 8C). Notably, tumors in this cohort exhibited a bimodal distribution of growth rates, suggesting that some tumors may have circumvented the growth suppressive effects of Par-4 reexpression. Indeed, when we examined Par-4 expression in chemotherapy-treated tumors at endpoint, we found that tumors expressing both sgRNAs targeting Par-4 had lost reexpression of Par-4 (Figure 7H and Supplemental Figure 8, D and E), implying that chemotherapy may select against cells reexpressing Par-4. Taken together, these results suggest that Par-4 reexpression slows the growth of chemotherapy-treated tumors during the early stages of tumor growth, thereby providing a selective pressure such that at later stages these tumors have lost Par-4 reexpression. In aggregate, these findings demonstrate that Par-4 expression through epigenome editing resensitizes recurrent tumor cells to chemotherapy.
Par-4 reexpression in recurrent tumor cells alters phosphorylation of cytoskeleton-associated proteins.
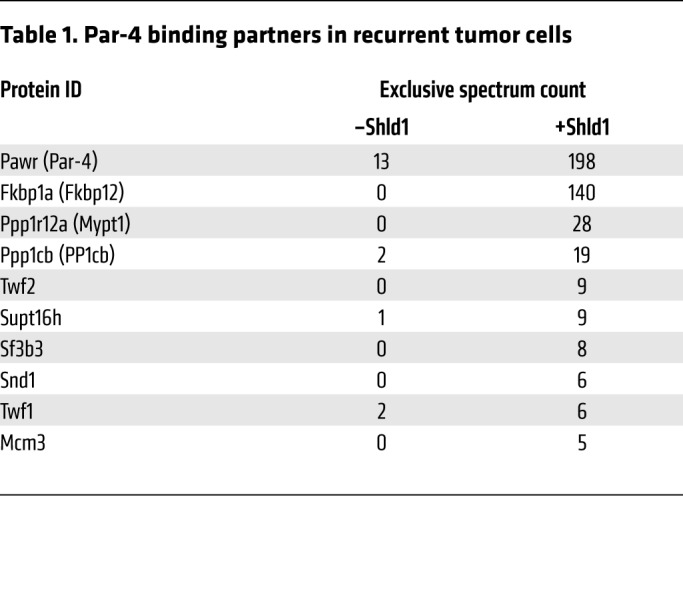
We next sought to determine the mechanism by which Par-4 reexpression sensitizes recurrent tumor cells to microtubule-targeting drugs. Par-4 mediates most of its cellular effects through protein-protein interactions, often via a leucine zipper domain on its C-terminus (47). Therefore we reasoned that identifying binding partners of Par-4 may shed light on the cellular effects of Par-4 reexpression in recurrent tumors. Recurrent tumor cells expressing L106P-Par-4 were left untreated or treated with Shld1 for 24 hours, and L106P-Par-4 was immunoprecipitated using an antibody against the Flag epitope. These immunoprecipitated proteins were subjected to mass spectrometry, and proteins that specifically interact with Par-4 were identified by comparing protein abundance in immunoprecipitates from control and Par-4–expressing cells. In addition to Par-4 itself and the L106P degradation domain protein (FKBP12), this analysis identified 8 proteins that specifically interact with Par-4 (Table 1). The 2 most abundant Par-4–interacting proteins were MYPT1 and PP1cβ, which are a regulatory and catalytic subunit of the protein phosphatase 1 (PP1) holoenzyme (48). We confirmed that each of these proteins interacts with Par-4 using coimmunoprecipitation (Supplemental Figure 9, A and B).
Table 1. Par-4 binding partners in recurrent tumor cells.
Given our finding that Par-4 interacts with a protein phosphatase, we next asked whether Par-4 expression alters the phosphorylation of any cellular proteins. To evaluate this, we measured phosphoprotein levels by quantitative mass spectrometry in recurrent tumor cells expressing L106P-Par-4 treated with Shld1 or vehicle for 16 hours (Figure 8A). A total of 105 proteins (119 phosphopeptides) demonstrated significant changes in phosphorylation following Par-4 expression (P < 0.05, fold change >2), with 69 proteins (81 phosphopeptides) showing decreased phosphorylation upon Par-4 expression and 36 proteins (38 phosphopeptides) showing increased phosphorylation (Figure 8B and Supplemental Table 2). Gene ontology analysis of significantly altered phosphoproteins showed that proteins involved in actin and microtubule binding were enriched among proteins whose phosphorylation was changed following Par-4 expression (Figure 8, C and D). Proteins whose phosphorylation decreased following Par-4 expression tended to be associated with microtubules, whereas proteins whose phosphorylation increased were mainly associated with the actin cytoskeleton (Figure 8D). Notably, many of the proteins whose phosphorylation changed in response to Par-4 have been associated with resistance to chemotherapies, including Stathmin (49), Marcks (50), Map1b (51), Kif20 (52), and HDAC6 (53). For instance, Marcks is known to be phosphorylated on a cluster of closely spaced serine residues (Ser159, 163, 167, and 170 in human; the corresponding residues in mouse are Ser152, 156, 160, and 163), and high levels of phosphorylation at these sites promote paclitaxel resistance in human breast cancer cells (50). We found that Par-4 expression led to a reduction in Marcks phosphorylation at Ser156 and Ser160, suggesting that reduced Marcks phosphorylation may mediate, at least in part, Par-4–induced chemosensitization (Supplemental Figure 9, C–F). We next expressed Par-4 by transducing recurrent tumor cells with retrovirus expressing Par-4 or by treating L106P-Par-4–expressing cells with Shld1, and then assessed Par-4 subcellular localization using immunofluorescence staining for Par-4 and phalloidin staining for F-actin. In both cases, reexpressed Par-4 partially localized near actin stress fibers, but did not noticeably alter the pattern of phalloidin staining (Supplemental Figure 10, A and B). This is consistent with our observation that Par-4 expression alters the phosphorylation of cytoskeletal proteins and with the published finding that Par-4 can localize to the actin cytoskeleton (54).
Figure 8. Reexpressed Par-4 alters the phosphorylation of cytoskeletal proteins and cooperates with microtubule-targeting drugs to induce mitotic defects.

(A) Western blot analysis showing L106P-Par-4 expression following 16-hour treatment with either vehicle or 1 μM Shld1 in biological triplicate. (B) Phosphopeptides were enriched from lysates of recurrent tumor cells treated with vehicle or Shld1 for 16 hours and then quantified by mass spectrometry. A total of 105 phosphoproteins were significantly altered following Par-4 expression, representing 1.56% of all measured phosphoproteins. Of the 105 altered phosphoproteins, 69 were downregulated and 36 upregulated. (C) Gene ontology analysis of downregulated and upregulated phosphoproteins. Dot color represents P value and dot size indicates the number of proteins in each category relative to the total number of altered proteins. (D) Volcano plot illustrating phosphoprotein enrichment and P values for all measured phosphoproteins following 16 hours of Shld1 or vehicle. Proteins are annotated if they were significantly altered (log2 fold change >1 and P <0.05) and are associated either with actin (red) or microtubules (blue) gene ontology families. (E) Quantification of abnormal mitoses in cells from recurrent tumor cell line 2, treated with vehicle, 100 nM Shld1, 10 nM vincristine, or with Shld1 and vincristine together, as determined by live microscopy. P values were determined by 1-way ANOVA and Tukey’s post hoc analysis and are shown as compared with vehicle. Error bars denote mean ± SEM. **P < 0.01, ***P < 0.001.
We previously showed that Par-4 expression in recurrent tumor cell lines induces multinucleation due to cytokinesis failure (14). Because microtubule-targeting drugs work in part by disrupting mitosis, we hypothesized that Par-4 expression may sensitize cells to these drugs by potentiating their mitotic defects. To evaluate this, we used time-lapse imaging to quantify the frequency of mitotic defects in chemotherapy-treated cells in the presence or absence of Par-4 expression. Cells were labeled with H2B-mCherry to visualize their nuclei and then treated with Shld1, vincristine, or both Shld1 and vincristine, and imaged over 18 hours. Analysis of 60 mitoses in each treatment showed that whereas Par-4 reexpression and vincristine alone each induced mitotic defects in a subset of cells, the combination induced defects in more than 90% of cell divisions (Figure 8E).
Discussion
In the present study, we explored the mechanism and functional significance of Par-4 downregulation in recurrent tumors. We found that Par-4 downregulation is associated with the epithelial-to-mesenchymal transition (EMT). Inducing EMT through TGF-β treatment in primary tumor cells is accompanied by Par-4 suppression, whereas reversing EMT in recurrent tumor cells leads to Par-4 upregulation. We identified Twist as the transcription factor that mediates this silencing. Twist binds directly to the Par-4 promoter, where it induces epigenetic silencing of Par-4 through induction of a unique bivalent chromatin configuration with both active and repressive histone modifications. This bivalent configuration confers plasticity on the Par-4 promoter, and Par-4 can be reexpressed through pharmacologic targeting of histone-modifying enzymes. Functionally, reexpression of Par-4 sensitizes recurrent tumor cells to cytotoxic chemotherapy, and this may be mediated through alterations in protein phosphorylation at the actin cytoskeleton. Taken together, these results suggest that Par-4 silencing promotes chemoresistance in recurrent breast cancers that have undergone EMT.
The emergence of recurrent tumors is frequently associated with chemotherapy resistance, and several lines of evidence suggest that EMT may functionally link recurrence and chemoresistance. The findings we present here offer a mechanistic explanation for this relationship. We previously found that Par-4 downregulation promotes breast cancer recurrence; we show here that Par-4 downregulation is mediated through EMT and represents one mechanism by which recurrent tumors acquire chemoresistance. This suggests that recurrent tumors that arise following EMT are inherently resistant to chemotherapy, due in part to the fact that they have silenced Par-4.
Our results also uncover a novel mode of epigenetic silencing induced by EMT. The mechanism by which EMT induces epigenetic silencing of E-cadherin has been extensively studied, and involves complete and permanent silencing through acquisition of repressive histone marks and DNA methylation. In contrast, Par-4 silencing by EMT is partial, reversible, and mediated through acquisition of a bivalent chromatin configuration. Specifically, Par-4 silencing in recurrent tumor cells and in Twist-expressing primary tumor cells is associated with maintenance of H3K4me3, in contrast to the E-cadherin promoter, which loses H3K4me3. The basis for the difference between Par-4 and E-cadherin silencing remains unknown. One possibility is that the H3K4 demethylase LSD1, which has been shown to be involved in E-cadherin silencing (20), may not be recruited to the Par-4 promoter during EMT. Regardless of the mechanism, the different modes of silencing have functional implications. Par-4 silencing can be rapidly reversed with drugs targeting epigenetic enzymes, including the FDA-approved HDAC inhibitors vorinostat and romidepsin, suggesting that therapeutic approaches to chemosensitize tumors by reexpressing Par-4 may be achievable. The prevalence of bivalent promoters has been shown to increase in treatment-resistant ovarian cancers (55) as well as in tumors that undergo EMT (56), suggesting that promoter bivalency is a common mode of gene regulation in both drug resistance and EMT. It is important to note that there may be other mechanisms by which Par-4 can be silenced in recurrent tumors. In this regard, it will be informative to analyze additional recurrent tumors — and recurrent tumors arising in distinct models — to determine whether a bivalent chromatin configuration at the Par-4 promoter is a general feature of relapsed tumors.
Our mechanistic studies suggest that Par-4 may promote cell death in response to chemotherapy by altering protein phosphorylation at the cytoskeleton. A number of commonly used chemotherapies, including taxol and vincristine, target the cytoskeleton. In addition, the role of the cytoskeleton in the response and resistance to chemotherapies has been well established. Our results suggest that Par-4 alters the phosphorylation of a number of cytoskeleton-associated proteins, including Stathmin, Marcks, and others, that have been implicated in chemotherapy resistance (49–53). Par-4 has been shown to recruit a binding partner, ZIPK, to the actin cytoskeleton (57). Our results expand upon this by suggesting that Par-4 binds to the phosphatase PP1, localizes near actin filaments, and alters the phosphorylation of actin-associated proteins. Future work will be required to determine if Par-4 relocalizes PP1 to the actin cytoskeleton, and whether PP1 is required to mediate phosphorylation changes observed following Par-4 expression. Finally, it is important to note that Par-4 has been shown to promote cell death by inhibiting a number of survival pathways, including bcl-2 and Akt (58, 59), and our results do not exclude a role for these pathways in mediating the function of reexpressed Par-4 in recurrent tumors.
In conclusion, our results identify Par-4 silencing as a potential targetable link between EMT and chemoresistance in recurrent breast cancer, and suggest a novel mechanism for Par-4 function in promoting death in response to chemotherapy. These results suggest that approaches to upregulate Par-4 by reversing its silencing may resensitize tumors to chemotherapy, improving the survival of patients with recurrent breast cancer.
Methods
Cell lines and reagents.
Three primary (primary 1, primary 2, and primary 3) and 4 recurrent (recurrent 1, recurrent 2, recurrent 3, and recurrent 4) tumor cell lines were generated as previously described (14). Briefly, primary and recurrent tumors were excised from MTB;TAN mice and minced into small chunks. Tumor chunks were digested with warmed digestion buffer containing 300 U/ml collagenase (StemCell) and 100 U/ml hyaluronidase (StemCell) at 37°C for 4 hours. Cells were resuspended in Dispase II (5 mg/ml) and DNase I (100 μg/ml) and filtered before plating. All cell lines were maintained in DMEM and supplemented with 2 mM l-glutamine, 100 U/ml penicillin-streptomycin, 10% super calf serum, 10 ng/ml EGF, and 5 μg/ml insulin. Primary cell lines 1 and 2 were additionally supplemented with 2 μg/ml doxycycline, 5 μg/ml prolactin, 1 μM progesterone, and 1 μg/ml hydrocortisone. All cells were grown in a humidified incubator at 37°C with 5% CO2. Primary tumor cell lines exposed to TGF-β (10 ng/ml; R&D Systems) were grown for at least 14 days, until morphological evidence of EMT by brightfield microscopy, before analysis. Recurrent tumor cells expressing L106P-Par-4 or L106P-YFP were previously described (14). Cells were treated with Shld1 at 300 nM except where indicated to induce Par-4 expression.
The following drugs were used: 5-Aza-2′-deoxycytidine (MilliporeSigma), SAHA (vorinostat; MilliporeSigma), vincristine (Tocris), docetaxel (Tocris), romidepsin (Selleck Chemicals), EPZ-6438 (Selleck Chemicals), and Shld1 (Clontech). Drugs were solubilized per manufacturer recommendations and utilized at concentrations stated within the text. Matching vehicle controls were used for each experiment.
Cell viability assays.
For chemosensitization experiments, recurrent cell line 2 expressing L106P-Par-4 or L106P-YFP was plated at 40,000 cells per well in triplicate on 12-well plates designated for 1, 3, or 5 days of treatment. Six wells were used for cell counting, whereas the remaining 6 wells were analyzed by crystal violet staining. Once cells attached, media was replaced with either 300 nM Shld1 or ethanol (vehicle control) for 16 hours before chemotherapeutic drugs were added (vincristine, 8 nM; docetaxel, 20 nM; or untreated). Cell number for each time point was determined by counting cells on a hemocytometer. The remaining wells were incubated with 0.5% crystal violet for 5 minutes, rinsed, and imaged by a scanner. For colony formation assays, 1,500 cells from either L106-YFP or L106P-Par-4 recurrent tumor cell line 2 were plated on 10-cm plates and treated with 10 nM vincristine, 10 nM docetaxel, or vehicle control, and either 100 nM Shld1 or ethanol vehicle. Plates were analyzed after 8 days by crystal violet staining.
For concentration response curves, recurrent cell line 1 expressing L106P-Par-4 was plated on a 96-well plate at 2,500 cells per well in triplicate. Cells were allowed to grow for 16 hours in the presence of 300 nM Shld1 or ethanol before treatment with varying doses of chemotherapeutic drugs for 60 hours. Cell viability was determined using CellTiterGlo kit (Promega) according to manufacturer instructions. Concentration response curves were plotted in GraphPad Prism 7 software.
Plasmids, viral transduction, and epigenome editing.
A retroviral construct encoding Twist was obtained from Robert Weinberg (Whitehead Institute, Cambridge, MA; Addgene plasmid 1783). To generate a retroviral construct encoding Snail, we PCR amplified Snail from the expression vector p3xFLAG-mSnail (a gift from Celeste Nelson, Princeton University, Princeton, NJ; Addgene plasmid 34583) and cloned it into pBabe-puro (Robert Weinberg, Whitehead Institute, Cambridge, MA; Addgene plasmid 1764) using the following primers: forward, 5′-GTTAGGATCCATGGACTACAAAGACGATGACGACAAGCCGCGCTCTTTCCTGGTCAG-3′; reverse, 5′-GTTAGAATTCTCAGCGAGGGCCTCCGGAGC-3′. A plasmid expressing dominant-negative IκB (pCMX-IkB-alpha-M) was a gift from Inder Verma (Salk Institute, La Jolla, CA; Addgene plasmid 12329).
To reexpress Par-4 in recurrent tumor cells we used an epigenetic editing approach (46). Cells were transduced with a catalytically dead Cas9 protein fused to the catalytic core of histone acetyltransferase p300 (dCas9-p300, a gift from Charles Gersbach, Duke University, Durham, NC). sgRNAs targeting the region of the Par-4 promoter that is hypo-acetylated in recurrent tumors were cloned into pLX-sgRNA (a gift from Eric Lander and David Sabatini, Whitehead Institute, Cambridge, MA; Addgene plasmid 50662). The sgRNAs used are shown in Supplemental Table 3. For Par-4 overexpression, we infected recurrent tumor cells for 48 hours with a retroviral vector expressing WT Par-4 prior to immunofluorescence staining (14).
Retrovirus was produced by transfecting AmphoPhoenix packaging cells with the retroviral expression construct (National Gene Vector Biorepository). Lentivirus was produced by transfection of HEK293T cell line with psPAX2 and pMDG.2 (gifts from Didier Trono, EPFL, Lausanne, Switzerland; Addgene plasmids 12559 and 12660) and the lentiviral expression construct. Viral supernatant was collected 48 and 72 hours after transfection, filtered, and used to transduce target cells in the presence of 4 μg/ml polybrene (MilliporeSigma). Cells were selected in selection media containing puromycin (2 μg/ml for primary tumor cells; 4 μg/ml for recurrent tumor cells).
Western blotting and qPCR.
Western blotting was performed as previously described (14). Primary and secondary antibodies used in this study are shown in Supplemental Table 3. Membranes were imaged using a Li-Cor Odyssey infrared imaging system and analyzed in ImageStudio Lite software (Li-Cor Biosciences). RNA was extracted using the RNeasy kit (Qiagen) and cDNA was synthesized using the ImProm-II Reverse Transcription System (Promega). Expression levels of genes were assessed by qPCR on a CFX384 Touch Real-Time PCR Detection System (Bio-Rad) using the Taqman probes shown in Supplemental Table 3. Tbp and Actb were used as normalization controls.
Chromatin immunoprecipitation.
Cells were fixed in 1% ChIP-grade formaldehyde (MilliporeSigma) for 10 minutes, crosslinking was quenched with 250 mM glycine, and then cells were harvested and pelleted by centrifugation. Radioimmunoprecipitation assay lysis buffer containing Halt protease inhibitor and phosphatase inhibitor cocktail (Thermo Fisher Scientific) was added and cells were incubated for 15 minutes with frequent vortexing. Samples were sonicated and DNA was sheared to an average length of approximately 250–450 bp. Lysates were precleared with Protein A/G beads (Santa Cruz) blocked with salmon sperm (Ambion) and ChIP-grade BSA (New England BioLabs). Purified sheared DNA was immunoprecipitated overnight at 4°C with 5 μg primary antibody or isotype-control rabbit and mouse IgG (5 μg of each mixed together). Antibodies used are shown in Supplemental Table 3. Immunoprecipitated DNA was purified with Protein A/G beads and washed sequentially with wash buffers. DNA was eluted from washed beads and reverse crosslinked with concentrated NaCl overnight at 65°C. After reverse crosslinking, proteins were digested with proteinase K (MilliporeSigma) and EDTA, and DNA was purified using PCR purification columns (Qiagen). All qPCR reactions were carried out with SYBR green (Bio-Rad) using primers shown in Supplemental Table 3. Control regions of the genome were also evaluated, and included the Actb promoter and a gene desert located on chromosome 12 (both primer pairs purchased from ActiveMotif). Ct values for immunoprecipitated DNA were normalized to input DNA. For Twist ChIP, DNA was normalized to input and expressed as fold enrichment over isotype control.
Chip-Seq analysis.
Following immunoprecipitation, DNA was quantified using the fluorometric quantitation Qubit 2.0 system (Thermo Fisher Scientific) and fragment size was confirmed with Agilent Tapestation. DNA libraries were prepared using the Kapa BioSystem HyperPrep Library Kit for compatibility with Illumina sequencing. Unique indexes were added to each sample. Resulting libraries were cleaned using SPRI beads, quantified with Qubit 2.0 and Agilent Bioanalyzer, and pooled into equimolar concentrations. Pools were sequenced on an Illumina Hiseq 4000 sequencer with 50 bp single reads at a depth of approximately 55 million reads per sample. Fastq reads underwent strict quality control processing with the TrimGalore (60) package to remove low-quality bases and trim adapter sequences. Reads passing quality control were mapped to the mm10 version of the mouse genome using the Bowtie short read aligner (61). Duplicate reads were filtered and peaks were called with the MACS2 peak-calling algorithm using default parameters, except for H3K27me3 peaks, which were called using broad peak settings (62). Bam files were converted into Bigwig format by binning reads into 100 bp segments. Images were generated in the IGV desktop viewer (Broad Institute).
Bisulfite sequencing.
Bisulfite sequencing was performed using the EpiTect Bisulfite Kit (Qiagen). Briefly, genomic DNA from 2 primary and 2 recurrent tumor cell lines was bisulfite-treated according to manufacturer instructions. Target regions of interest were PCR amplified using the primers shown in Supplemental Table 3. Amplified DNA was gel purified and transformed into bacteria. Ten independent bacterial colonies were sequenced per cell line for both Par-4 and E-cadherin. DNA sequences were aligned to normal DNA sequences using DNASTAR MegAlign software.
Immunofluorescence.
Cells were plated onto poly-D-lysine–coated coverslips (Neuvitro). Cells were fixed in 4% paraformaldehyde, permeabilized with 0.5% fresh Triton-X100 (MilliporeSigma) and blocked with 3% BSA (Fisher) containing 10% normal goat serum (Invitrogen). Coverslips were incubated overnight at 4°C in 3% BSA buffer containing primary antibodies. The next day, coverslips were washed and incubated with secondary antibodies. Following secondary antibody incubation, cells to be stained for actin filaments were exposed for 20 minutes to Alexa Fluor 568 phalloidin conjugate (Thermo Fisher Scientific). Coverslips were mounted in ProLong Gold Antifade (Thermo Fisher Scientific) DAPI suspension and dried overnight at room temperature. Images were captured on a Leica SP5 inverted confocal microscope. Primary antibodies used in this study are shown in Supplemental Table 3. Secondary antibodies were obtained from Thermo Fisher Scientific and included Alexa Fluor 488 (goat anti-rabbit), Alexa Fluor 647 (goat anti-mouse), Alexa Fluor 568 (goat anti-rabbit), and Alexa Fluor 488 (goat anti-mouse).
Live cell microscopy.
Recurrent tumor cell line 2 was infected with lenti-H2B-mCherry to visualize nuclei and 100,000 cells were plated on 6-well, number 1.5 coverslip, 14-mm diameter plates (MatTek) precoated with poly-D-lysine (MilliporeSigma). Following cell adhesion, wells were treated with either vehicle or 100 nM Shld1 for 16 hours prior to treatment with 10 nM vincristine or vehicle control. Immediately following vincristine treatment, plates were placed in a live cell imaging station (Zeiss Axio Observer) heated to 37°C and with 5% CO2. Phase contrast and fluorescence images were taken every 5 minutes for 18 hours at 3 unique areas within each well. Images were recorded at ×10 magnification. For analysis, 20 cellular divisions, as determined by H2B-mCherry localization, were counted for all 3 videos in each well and the percentage of abnormal mitoses was averaged. An abnormal division was defined as a mitosis lasting longer than 1 hour (between prometaphase through abscission), a mitosis resulting in binucleation, or a mitosis ending with morphological signs of cell death.
In vivo chemosensitivity.
Recurrent tumor cells expressing dCas9-p300 plus an sgRNA targeting a control region (AAVS) or the Par-4 promoter (sgPar-4/1 or sgPar-4/2) were orthotopically injected into the inguinal (fourth) mammary gland of 6-week-old nude mice. A separate cohort of mice was injected with primary tumor cell lines. Once tumors achieved a size of approximately 75 mm3, mice began treatment. Mice were divided into untreated (n = 3 per cohort, total n = 9) or treated (n = 10 per cohort, total n = 30) groups. Treated mice received 2 mg/kg intraperitoneal doxorubicin (Adriamycin) and 80 mg/kg intraperitoneal cyclophosphamide injections twice weekly for 2 weeks followed by 10 mg/kg paclitaxel twice weekly for 2 weeks. All chemotherapeutic agents were obtained from the Duke University Hospital pharmacy. Tumor size was measured with calipers 3 times per week until tumors reached approximately 1,800 mm3. Tumor tissues from sacrificed mice were excised and flash frozen for downstream protein and mRNA analysis. Kaplan-Meier survival curves were generated for time until tumors reached study endpoint (volume of approximately 1,800 mm3). Tumor volume was calculated using the formula ((π × length × width2)/6). Tumor AUC was calculated using the formula [(vol1 + vol2)/2] × (day2 – day1). Mean growth rate was determined by using the formula (AUC – (vol1 × dayn))/(dayn2). Tumor burden was compared among treated groups by 1-way ANOVA followed by Tukey’s post hoc analysis. Graphs were generated in GraphPad Prism 7.
Statistics.
For Western blots, a single experiment is shown that is representative of results from at least 2 independent experiments. For gene expression assays, results from a single representative experiment are shown as the mean ± SEM. For statistical comparisons between 2 groups, we used a 2-tailed Student’s t test. For comparisons among multiple groups, we used a 1-way ANOVA with Tukey’s post hoc analysis, except where indicated. Differences in Kaplan-Meier survival curves were tested with the Mantel-Cox log-rank test. A P value less than 0.05 was considered significant. Graphs were generated in GraphPad Prism7, except where indicated.
Study approval.
Animal care and all animal experiments were performed with the approval of and in accordance with Duke University IACUC guidelines.
Author contributions
JVA and NWM were responsible for the conception, design, and interpretation of all experiments. DBF assisted with EMT induction in primary tumor cell lines and generation of recurrent orthotopic tumors. NWM conducted all of the experiments and performed all data acquisition. SNP and RL assisted with animal work. AED executed and analyzed cell viability assays following Shld1 administration in vitro. JWT oversaw execution and analysis of proteomics experiments. NWM and JVA wrote the manuscript. JVA supervised all work.
Supplementary Material
Acknowledgments
We thank So Young Kim from the Duke Functional Genomics Core for the generation and validation of sgRNAs targeting the Par-4 promoter, David Corcoran from the Duke Genomic Analysis and Bioinformatics Core for assistance with alignment and analysis of ChIP-seq data, Nicolas Devos and Holly Dressman from the Duke Sequencing and Genomic Technologies Core for acquisition of ChIP-seq and microarray data, James Stice and the Donald McDonnell laboratory for technical assistance with ChIP experiments, Charlie Gersbach and Isaac Hilton for assisting with the generation of dCas9-p300 expression constructs in our cell lines, Laura Dubois and Lisa St. John-Williams from the Duke Proteomics and Metabolomics Shared Resource for acquisition of proteomics data, and Yasheng Gao from the Duke Light Microscopy Core for assistance and training on confocal microscopy equipment. This work was funded by the National Cancer Institute under award numbers R01CA208042 (to JVA) and F31CA220851 (to NWM) and by startup funds from the Duke Cancer Institute, the Duke University School of Medicine, and the Whitehead Foundation (to JVA).
Version 3. 08/27/2018
Electronic publication
Version 4. 10/01/2018
Print issue publication
Footnotes
Conflict of interest: The authors have declared that no conflict of interest exists.
Reference information: J Clin Invest. 2018;128(10):4413–4428.https://doi.org/10.1172/JCI99481.
Contributor Information
Ryan Lupo, Email: ryan.lupo@duke.edu.
J. Will Thompson, Email: will.thompson@duke.edu.
References
- 1. Breast Cancer Statistics at a Glance. Surveillance, Epidemiology, and End Results (SEER) Program. National Cancer Institute. https://seer.cancer.gov/statfacts/html/breast.html Accessed August 21, 2018.
- 2.Early Breast Cancer Trialists’ Collaborative Group (EBCTCG) et al. Comparisons between different polychemotherapy regimens for early breast cancer: meta-analyses of long-term outcome among 100,000 women in 123 randomised trials. Lancet. 2012;379(9814):432–444. doi: 10.1016/S0140-6736(11)61625-5. [DOI] [PMC free article] [PubMed] [Google Scholar]
- 3.Sparano JA, et al. Long-term follow-up of the E1199 phase III trial evaluating the role of taxane and schedule in operable breast cancer. J Clin Oncol. 2015;33(21):2353–2360. doi: 10.1200/JCO.2015.60.9271. [DOI] [PMC free article] [PubMed] [Google Scholar]
- 4.Mitra A, Mishra L, Li S. EMT, CTCs and CSCs in tumor relapse and drug-resistance. Oncotarget. 2015;6(13):10697–10711. doi: 10.18632/oncotarget.4037. [DOI] [PMC free article] [PubMed] [Google Scholar]
- 5.Shibue T, Weinberg RA. EMT, CSCs, and drug resistance: the mechanistic link and clinical implications. Nat Rev Clin Oncol. 2017;14(10):611–629. doi: 10.1038/nrclinonc.2017.44. [DOI] [PMC free article] [PubMed] [Google Scholar]
- 6.Wu DW, et al. FHIT loss confers cisplatin resistance in lung cancer via the AKT/NF-κB/Slug-mediated PUMA reduction. Oncogene. 2015;34(19):2505–2515. doi: 10.1038/onc.2014.184. [DOI] [PubMed] [Google Scholar]
- 7.Vega S, Morales AV, Ocaña OH, Valdés F, Fabregat I, Nieto MA. Snail blocks the cell cycle and confers resistance to cell death. Genes Dev. 2004;18(10):1131–1143. doi: 10.1101/gad.294104. [DOI] [PMC free article] [PubMed] [Google Scholar]
- 8.Saxena M, Stephens MA, Pathak H, Rangarajan A. Transcription factors that mediate epithelial-mesenchymal transition lead to multidrug resistance by upregulating ABC transporters. Cell Death Dis. 2011;2:e179. doi: 10.1038/cddis.2011.61. [DOI] [PMC free article] [PubMed] [Google Scholar]
- 9.Moody SE, et al. The transcriptional repressor Snail promotes mammary tumor recurrence. Cancer Cell. 2005;8(3):197–209. doi: 10.1016/j.ccr.2005.07.009. [DOI] [PubMed] [Google Scholar]
- 10.Fischer KR, et al. Epithelial-to-mesenchymal transition is not required for lung metastasis but contributes to chemoresistance. Nature. 2015;527(7579):472–476. doi: 10.1038/nature15748. [DOI] [PMC free article] [PubMed] [Google Scholar]
- 11.Zheng X, et al. Epithelial-to-mesenchymal transition is dispensable for metastasis but induces chemoresistance in pancreatic cancer. Nature. 2015;527(7579):525–530. doi: 10.1038/nature16064. [DOI] [PMC free article] [PubMed] [Google Scholar]
- 12.Creighton CJ, et al. Residual breast cancers after conventional therapy display mesenchymal as well as tumor-initiating features. Proc Natl Acad Sci U S A. 2009;106(33):13820–13825. doi: 10.1073/pnas.0905718106. [DOI] [PMC free article] [PubMed] [Google Scholar]
- 13.Tsai JH, Yang J. Epithelial-mesenchymal plasticity in carcinoma metastasis. Genes Dev. 2013;27(20):2192–2206. doi: 10.1101/gad.225334.113. [DOI] [PMC free article] [PubMed] [Google Scholar]
- 14.Alvarez JV, et al. Par-4 downregulation promotes breast cancer recurrence by preventing multinucleation following targeted therapy. Cancer Cell. 2013;24(1):30–44. doi: 10.1016/j.ccr.2013.05.007. [DOI] [PMC free article] [PubMed] [Google Scholar]
- 15.Tan J, et al. Par-4 downregulation confers cisplatin resistance in pancreatic cancer cells via PI3K/Akt pathway-dependent EMT. Toxicol Lett. 2014;224(1):7–15. doi: 10.1016/j.toxlet.2013.10.008. [DOI] [PubMed] [Google Scholar]
- 16.Kline CL, Irby RB. The pro-apoptotic protein prostate apoptosis response protein-4 (Par-4) can be activated in colon cancer cells by treatment with Src inhibitor and 5-FU. Apoptosis. 2011;16(12):1285–1294. doi: 10.1007/s10495-011-0648-3. [DOI] [PubMed] [Google Scholar]
- 17.Moody SE, et al. Conditional activation of Neu in the mammary epithelium of transgenic mice results in reversible pulmonary metastasis. Cancer Cell. 2002;2(6):451–461. doi: 10.1016/S1535-6108(02)00212-X. [DOI] [PubMed] [Google Scholar]
- 18.Boxer RB, Jang JW, Sintasath L, Chodosh LA. Lack of sustained regression of c-MYC-induced mammary adenocarcinomas following brief or prolonged MYC inactivation. Cancer Cell. 2004;6(6):577–586. doi: 10.1016/j.ccr.2004.10.013. [DOI] [PubMed] [Google Scholar]
- 19.Gunther EJ, et al. Impact of p53 loss on reversal and recurrence of conditional Wnt-induced tumorigenesis. Genes Dev. 2003;17(4):488–501. doi: 10.1101/gad.1051603. [DOI] [PMC free article] [PubMed] [Google Scholar]
- 20.Tam WL, Weinberg RA. The epigenetics of epithelial-mesenchymal plasticity in cancer. Nat Med. 2013;19(11):1438–1449. doi: 10.1038/nm.3336. [DOI] [PMC free article] [PubMed] [Google Scholar]
- 21.Marcotte R, et al. Functional genomic landscape of human breast cancer drivers, vulnerabilities, and resistance. Cell. 2016;164(1-2):293–309. doi: 10.1016/j.cell.2015.11.062. [DOI] [PMC free article] [PubMed] [Google Scholar]
- 22.Cancer Genome Atlas Network Comprehensive molecular portraits of human breast tumours. Nature. 2012;490(7418):61–70. doi: 10.1038/nature11412. [DOI] [PMC free article] [PubMed] [Google Scholar]
- 23.Singh A, Settleman J. EMT, cancer stem cells and drug resistance: an emerging axis of evil in the war on cancer. Oncogene. 2010;29(34):4741–4751. doi: 10.1038/onc.2010.215. [DOI] [PMC free article] [PubMed] [Google Scholar]
- 24.Peinado H, Olmeda D, Cano A. Snail, Zeb and bHLH factors in tumour progression: an alliance against the epithelial phenotype? Nat Rev Cancer. 2007;7(6):415–428. doi: 10.1038/nrc2131. [DOI] [PubMed] [Google Scholar]
- 25.Dong C, et al. G9a interacts with Snail and is critical for Snail-mediated E-cadherin repression in human breast cancer. J Clin Invest. 2012;122(4):1469–1486. doi: 10.1172/JCI57349. [DOI] [PMC free article] [PubMed] [Google Scholar]
- 26.Fang X, et al. Twist2 contributes to breast cancer progression by promoting an epithelial-mesenchymal transition and cancer stem-like cell self-renewal. Oncogene. 2011;30(47):4707–4720. doi: 10.1038/onc.2011.181. [DOI] [PubMed] [Google Scholar]
- 27.Vesuna F, van Diest P, Chen JH, Raman V. Twist is a transcriptional repressor of E-cadherin gene expression in breast cancer. Biochem Biophys Res Commun. 2008;367(2):235–241. doi: 10.1016/j.bbrc.2007.11.151. [DOI] [PMC free article] [PubMed] [Google Scholar]
- 28.Batlle E, et al. The transcription factor snail is a repressor of E-cadherin gene expression in epithelial tumour cells. Nat Cell Biol. 2000;2(2):84–89. doi: 10.1038/35000034. [DOI] [PubMed] [Google Scholar]
- 29.Nieto MA, Huang RY, Jackson RA, Thiery JP. EMT: 2016. Cell. 2016;166(1):21–45. doi: 10.1016/j.cell.2016.06.028. [DOI] [PubMed] [Google Scholar]
- 30.Tan EJ, Thuault S, Caja L, Carletti T, Heldin CH, Moustakas A. Regulation of transcription factor Twist expression by the DNA architectural protein high mobility group A2 during epithelial-to-mesenchymal transition. J Biol Chem. 2012;287(10):7134–7145. doi: 10.1074/jbc.M111.291385. [DOI] [PMC free article] [PubMed] [Google Scholar]
- 31.Taube JH, et al. Core epithelial-to-mesenchymal transition interactome gene-expression signature is associated with claudin-low and metaplastic breast cancer subtypes. Proc Natl Acad Sci U S A. 2010;107(35):15449–15454. doi: 10.1073/pnas.1004900107. [DOI] [PMC free article] [PubMed] [Google Scholar]
- 32.Huber MA, et al. NF-kappaB is essential for epithelial-mesenchymal transition and metastasis in a model of breast cancer progression. J Clin Invest. 2004;114(4):569–581. doi: 10.1172/JCI21358. [DOI] [PMC free article] [PubMed] [Google Scholar]
- 33.Van Antwerp DJ, Martin SJ, Kafri T, Green DR, Verma IM. Suppression of TNF-alpha-induced apoptosis by NF-kappaB. Science. 1996;274(5288):787–789. doi: 10.1126/science.274.5288.787. [DOI] [PubMed] [Google Scholar]
- 34.Peinado H, Ballestar E, Esteller M, Cano A. Snail mediates E-cadherin repression by the recruitment of the Sin3A/histone deacetylase 1 (HDAC1)/HDAC2 complex. Mol Cell Biol. 2004;24(1):306–319. doi: 10.1128/MCB.24.1.306-319.2004. [DOI] [PMC free article] [PubMed] [Google Scholar]
- 35.Moreno-Bueno G, et al. Inactivation of the candidate tumor suppressor par-4 in endometrial cancer. Cancer Res. 2007;67(5):1927–1934. doi: 10.1158/0008-5472.CAN-06-2687. [DOI] [PubMed] [Google Scholar]
- 36.Pruitt K, et al. Ras-mediated loss of the pro-apoptotic response protein Par-4 is mediated by DNA hypermethylation through Raf-independent and Raf-dependent signaling cascades in epithelial cells. J Biol Chem. 2005;280(24):23363–23370. doi: 10.1074/jbc.M503083200. [DOI] [PubMed] [Google Scholar]
- 37.Fraga MF, et al. A mouse skin multistage carcinogenesis model reflects the aberrant DNA methylation patterns of human tumors. Cancer Res. 2004;64(16):5527–5534. doi: 10.1158/0008-5472.CAN-03-4061. [DOI] [PubMed] [Google Scholar]
- 38.Chi P, Allis CD, Wang GG. Covalent histone modifications--miswritten, misinterpreted and mis-erased in human cancers. Nat Rev Cancer. 2010;10(7):457–469. doi: 10.1038/nrc2876. [DOI] [PMC free article] [PubMed] [Google Scholar]
- 39.Barski A, et al. High-resolution profiling of histone methylations in the human genome. Cell. 2007;129(4):823–837. doi: 10.1016/j.cell.2007.05.009. [DOI] [PubMed] [Google Scholar]
- 40.Shilatifard A. The COMPASS family of histone H3K4 methylases: mechanisms of regulation in development and disease pathogenesis. Annu Rev Biochem. 2012;81:65–95. doi: 10.1146/annurev-biochem-051710-134100. [DOI] [PMC free article] [PubMed] [Google Scholar]
- 41.Voigt P, Tee WW, Reinberg D. A double take on bivalent promoters. Genes Dev. 2013;27(12):1318–1338. doi: 10.1101/gad.219626.113. [DOI] [PMC free article] [PubMed] [Google Scholar]
- 42.Du J, Johnson LM, Jacobsen SE, Patel DJ. DNA methylation pathways and their crosstalk with histone methylation. Nat Rev Mol Cell Biol. 2015;16(9):519–532. doi: 10.1038/nrm4043. [DOI] [PMC free article] [PubMed] [Google Scholar]
- 43.Chaudhry P, Singh M, Parent S, Asselin E. Prostate apoptosis response 4 (Par-4), a novel substrate of caspase-3 during apoptosis activation. Mol Cell Biol. 2012;32(4):826–839. doi: 10.1128/MCB.06321-11. [DOI] [PMC free article] [PubMed] [Google Scholar]
- 44.Gurumurthy S, Goswami A, Vasudevan KM, Rangnekar VM. Phosphorylation of Par-4 by protein kinase A is critical for apoptosis. Mol Cell Biol. 2005;25(3):1146–1161. doi: 10.1128/MCB.25.3.1146-1161.2005. [DOI] [PMC free article] [PubMed] [Google Scholar]
- 45.Sánchez-Tilló E, et al. The EMT activator ZEB1 promotes tumor growth and determines differential response to chemotherapy in mantle cell lymphoma. Cell Death Differ. 2014;21(2):247–257. doi: 10.1038/cdd.2013.123. [DOI] [PMC free article] [PubMed] [Google Scholar]
- 46.Hilton IB, et al. Epigenome editing by a CRISPR-Cas9-based acetyltransferase activates genes from promoters and enhancers. Nat Biotechnol. 2015;33(5):510–517. doi: 10.1038/nbt.3199. [DOI] [PMC free article] [PubMed] [Google Scholar]
- 47.Tiruttani Subhramanyam UK, Kubicek J, Eidhoff UB, Labahn J. Structural basis for the regulatory interactions of proapoptotic Par-4. Cell Death Differ. 2017;24(9):1540–1547. doi: 10.1038/cdd.2017.76. [DOI] [PMC free article] [PubMed] [Google Scholar]
- 48.Pinheiro AS, Marsh JA, Forman-Kay JD, Peti W. Structural signature of the MYPT1-PP1 interaction. J Am Chem Soc. 2011;133(1):73–80. doi: 10.1021/ja107810r. [DOI] [PMC free article] [PubMed] [Google Scholar]
- 49.Alli E, Yang JM, Ford JM, Hait WN. Reversal of stathmin-mediated resistance to paclitaxel and vinblastine in human breast carcinoma cells. Mol Pharmacol. 2007;71(5):1233–1240. doi: 10.1124/mol.106.029702. [DOI] [PubMed] [Google Scholar]
- 50.Chen CH, et al. Elevated MARCKS phosphorylation contributes to unresponsiveness of breast cancer to paclitaxel treatment. Oncotarget. 2015;6(17):15194–15208. doi: 10.18632/oncotarget.3827. [DOI] [PMC free article] [PubMed] [Google Scholar]
- 51.Laks DR, et al. A molecular cascade modulates MAP1B and confers resistance to mTOR inhibition in human glioblastoma. Neuro-oncology. 2018;20(6):764–775. doi: 10.1093/neuonc/nox215. [DOI] [PMC free article] [PubMed] [Google Scholar]
- 52.Khongkow P, et al. Paclitaxel targets FOXM1 to regulate KIF20A in mitotic catastrophe and breast cancer paclitaxel resistance. Oncogene. 2016;35(8):990–1002. doi: 10.1038/onc.2015.152. [DOI] [PMC free article] [PubMed] [Google Scholar]
- 53.Wang Z, et al. HDAC6 promotes cell proliferation and confers resistance to temozolomide in glioblastoma. Cancer Lett. 2016;379(1):134–142. doi: 10.1016/j.canlet.2016.06.001. [DOI] [PubMed] [Google Scholar]
- 54.Vetterkind S, et al. Binding of Par-4 to the actin cytoskeleton is essential for Par-4/Dlk-mediated apoptosis. Exp Cell Res. 2005;305(2):392–408. doi: 10.1016/j.yexcr.2005.01.012. [DOI] [PubMed] [Google Scholar]
- 55.Chapman-Rothe N, et al. Chromatin H3K27me3/H3K4me3 histone marks define gene sets in high-grade serous ovarian cancer that distinguish malignant, tumour-sustaining and chemo-resistant ovarian tumour cells. Oncogene. 2013;32(38):4586–4592. doi: 10.1038/onc.2012.477. [DOI] [PubMed] [Google Scholar]
- 56.Marjanovic ND, Weinberg RA, Chaffer CL. Poised with purpose: cell plasticity enhances tumorigenicity. Cell Cycle. 2013;12(17):2713–2714. doi: 10.4161/cc.26075. [DOI] [PMC free article] [PubMed] [Google Scholar]
- 57.Boosen M, Vetterkind S, Kubicek J, Scheidtmann KH, Illenberger S, Preuss U. Par-4 is an essential downstream target of DAP-like kinase (Dlk) in Dlk/Par-4-mediated apoptosis. Mol Biol Cell. 2009;20(18):4010–4020. doi: 10.1091/mbc.e09-02-0173. [DOI] [PMC free article] [PubMed] [Google Scholar]
- 58.Joshi J, et al. Par-4 inhibits Akt and suppresses Ras-induced lung tumorigenesis. EMBO J. 2008;27(16):2181–2193. doi: 10.1038/emboj.2008.149. [DOI] [PMC free article] [PubMed] [Google Scholar]
- 59.Qiu G, Ahmed M, Sells SF, Mohiuddin M, Weinstein MH, Rangnekar VM. Mutually exclusive expression patterns of Bcl-2 and Par-4 in human prostate tumors consistent with down-regulation of Bcl-2 by Par-4. Oncogene. 1999;18(3):623–631. doi: 10.1038/sj.onc.1202344. [DOI] [PubMed] [Google Scholar]
- 60. Krueger F. Trim Galore. Babraham Bioinformatics. https://www.bioinformatics.babraham.ac.uk/projects/trim_galore/ Accessed July 26, 2018.
- 61.Langmead B, Trapnell C, Pop M, Salzberg SL. Ultrafast and memory-efficient alignment of short DNA sequences to the human genome. Genome Biol. 2009;10(3):R25. doi: 10.1186/gb-2009-10-3-r25. [DOI] [PMC free article] [PubMed] [Google Scholar]
- 62.Zhang Y, et al. Model-based analysis of ChIP-Seq (MACS) Genome Biol. 2008;9(9):R137. doi: 10.1186/gb-2008-9-9-r137. [DOI] [PMC free article] [PubMed] [Google Scholar]
Associated Data
This section collects any data citations, data availability statements, or supplementary materials included in this article.