Abstract
Background:
With conflicting results in the literature, it remains unclear whether a higher field strength automatically increases the sensitivity and specificity of magnetic resonance imaging (MRI) for detecting pathological lesions in the knee. Therefore, we performed a systematic review and meta-analysis of studies comparing the diagnostic accuracy of 1.5- and 3.0-T MRI for lesions within the knee.
Methods:
Sixteen studies were included in the meta-analysis of the diagnostic accuracy of MRI for lesions of the knee joint, and areas under the curve (AUC) derived from the summary receiver operating characteristic curve analysis were determined for comparison of the diagnostic accuracy with differing magnetic field strength as well as for lesions in different tissues of the knee. Separate meta-analyses were performed for the diagnosis of lesions within articular cartilage, ligaments, and meniscus.
Results:
For lesions within the articular cartilage, the AUC for 1.5-T MRI differed significantly from that for 3.0-T MRI (Z = 3.4, P < .05). However, for lesions within the ligaments and meniscus, the AUC values for 1.5-T MRI did not differ significantly from those for 3.0-T MRI (Z = 0.32, P > .05, and Z = 0.33, P > .05, respectively).
Conclusion:
Our results indicate that both 1.5-T and 3.0-T MRI offer high diagnostic accuracy and clinical relevance for knee injuries involving the meniscus or a ligament. However, the present meta-analysis indicates that 3.0-T MRI does offer greater diagnostic accuracy than 1.5-T MRI for articular cartilage lesions.
Keywords: arthroscopy, knee, magnetic resonance imaging, systematic review and meta-analysis
1. Introduction
Methods for the detection of early morphologic changes in articular cartilage are needed to facilitate effective treatments of osteoarthritis and posttraumatic knee joint pain. The ability to identify focal and diffuse lesions in the knee could provide an explanation for patients’ symptoms as well as important guidance for determining the best therapeutic course. Magnetic resonance imaging (MRI) is one of the most commonly used modalities for assessing the integrity of tissues in the knee, including the articular cartilage, ligaments, and meniscus, because of its excellent soft-tissue contrast. However, the reported sensitivity of MRI for identifying lesions varies among the cartilage and other tissues types,[1–4] ranging from a sensitivity of 45% for cartilaginous lesions to 97.5% for defects of the inner meniscus.[4,5] Currently, 3.0-T MRI is advocated over 1.5-T MRI as offering better diagnostic performance for assessment of the knee joint.[6–9] The advantages of 3.0-T MRI include improved spatial resolution, higher signal-to-noise ratio (SNR), and smaller slice thickness achieved without a longer acquisition time for visualization of anatomical and pathological structures.[2,6] However, Van Dyck et al[10] reported the absence of any statistically significant differences in these parameters between 1.5-T and 3.0-T MRI, and a meta-analysis of articles published between 1991 and 2000 revealed no difference in the ability to detect meniscal tears with the use of MRI units with magnets varying in strength from 0.1 to 1.5 T.[11] Based on these findings, it remains unclear if a higher field strength automatically increases the sensitivity and specificity of MRI for detecting pathological lesions.
Therefore, we performed the present meta-analysis of selected studies specifically designed to compare the diagnostic accuracy of 1.5- and 3-T MRI for the differential diagnosis of knee lesions (including those in the articular cartilage, ligaments, and meniscus).
2. Materials and methods
2.1. Search strategy
In May 2017, 2 orthopedic surgeons (with 11 and 9 years of experience, respectively) performed an overall search of the PubMed (http://www.ncbi.nlm.nih.gov/pubmed) and Embase through Scopus (http://www.scopus. com/ home.url) databases from January 2005 to May 2015. The search terms were: “knee,” “meniscus,” “articular cartilage,” “ligament,” “1.5-T MR,” and “3.0-T MR.” Only papers published in full text were selected, and the language was restricted to English. Duplicates, reviews, letters, comments, case reports, and articles reporting data on items other than the investigated topic were excluded from further analysis.
2.2. Inclusion and exclusion criteria
We refined the meta-analysis to include only studies that were specifically designed to analyze the accuracy of 1.5- and/or 3-T MRI for the diagnosis of lesions of the knee. The inclusion criteria were: reporting of the involvement of the articular cartilage, cruciate ligaments, and meniscus on MRI, and evaluation of the accuracy of findings according to the arthroscopic findings as the reference standard through the reporting of true positive, false positive, true negative, and false negative values; sensitivity, specificity, negative predictive value (NPV), and positive predictive value (PPV); or receiver operating characteristic (ROC) plot or curve analysis. The exclusion criteria were: the absence of arthroscopy results as the gold standard for diagnosis of lesions, and a study population of <10 patients. All studies that fulfilled these criteria were included for data extraction.
2.3. Quality assessment and data extraction
The first author independently extracted relevant data that were validated in previous publications using a standardized data extraction form. The Quality Assessment of Diagnostic Accuracy Studies (QUADAS) was used as a guide to assess methodological quality, as the included papers were considered to be diagnostic studies.[12] All 14 QUADAS items were considered relevant to our meta-analysis. Each item was scored as “yes,” “no,” or “unclear.” The first author reviewed the full texts of the included studies.
From each of the included studies, we extracted data for publication year; name(s) and country(s) of the author(s); age of patients; number of patients; time from MRI to arthroscopy; study design (prospective or retrospective); characteristics of individuals; numbers of true positive, false negative, true negative, and false positive observations; reference standards; and blinding of investigators to results.
2.4. Ethical approval
No ethical approval was required because all the data were extracted from the previous published articles.
2.5. Statistical analyses
Statistical analyses were performed using MetaDisc version 1.4 (http://www. hrc.es/investigacion/metadiscen.htm). We calculated the area under the summary ROC curve (AUC-SROC) to confirm whether a threshold value existed. If no threshold effect was observed, the Q test for heterogeneity statistics was used and the pooled sensitivity, specificity, diagnostic odds ratio (DOR) with 95% confidence interval, and AUC-sROC were calculated based on a random-effects or fixed-effects model. Then, differences in the AUC-sROC values were assessed with Z test to analyze whether there was a significant difference between 1.5- and 3.0-T MRI for the diagnosis of lesions in the knee joint.
3. Results
3.1. Literature search and study inclusion
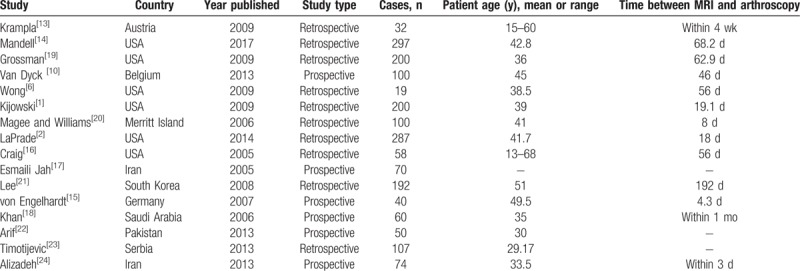
The initial search yielded 563 papers, and after application of the exclusion criteria, 48 articles were selected for full-text review. Of these, 16 clinical studies specifically designed to analyze the diagnostic accuracy of 1.5-T and/or 3.0-T MRI for lesions in the articular cartilage, ligaments, or meniscus of the knee joint were identified and included in the present meta-analysis (Fig. 1). The characteristics and numbers of patients enrolled as well as the diagnostic outcomes of these studies are summarized in Table 1. To reduce the heterogeneity among the clinical studies, we performed separate meta-analyses of studies investigating lesions in different parts of the knee, specifically the articular cartilage, ligaments, and meniscus. Arthroscopic evaluation was the reference method for the assessment of the knee joint pathology in all studies. In both the MRI and arthroscopic surgery reports, the articular surfaces of the knee were divided into 6 regions (i.e., patella, trochlea, medial femoral condyle, medial tibial plateau, lateral femoral condyle, and lateral tibial plateau).
Figure 1.
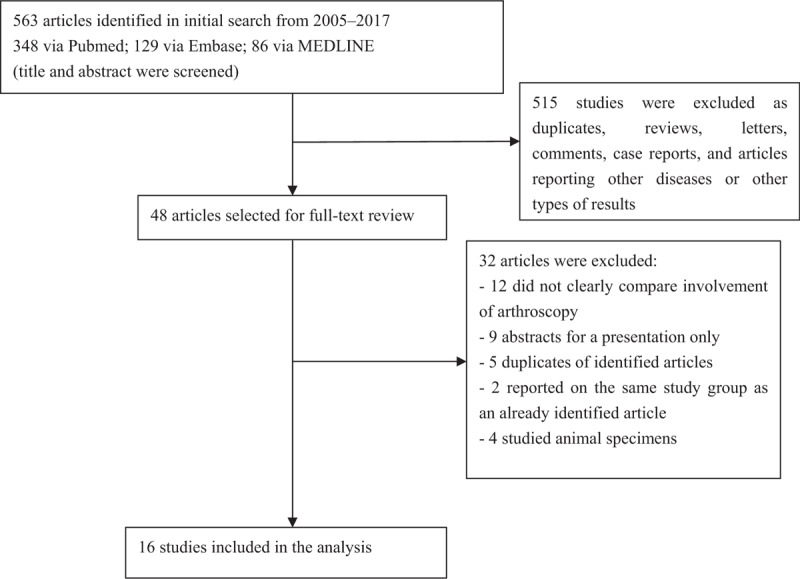
Flow diagram of the identification of studies for inclusion in the present systematic review and meta-analyses.
Table 1.
Summary of the characteristics of the included studies.
3.2. Characteristics and quality of included studies
Finally, 6 prospective studies and 10 retrospective studies remained for analysis (Table 1). Six papers reported data for both 1.5-T and 3.0-T MRI; 6 papers reported data for only 1.5-T MRI; and 4 papers reported data for only 3.0-T MRI. The 16 studies were published between 2005 and 2017 and described results from 1886 patients, including 824 lesions of the ligaments, 6686 lesions of the articular cartilage, and 3631 lesions of the meniscus (Table 2).
Table 2.
Summary of MRI findings and lesion locations.
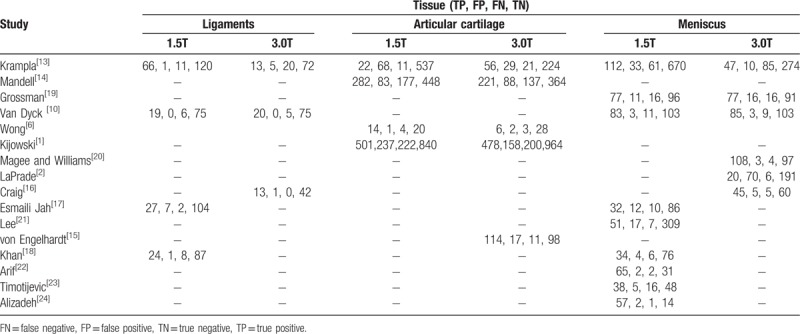
Table 3 outlines the results of our assessment of whether each of the 16 studies satisfied the 14 items of the QUADAS tool that were considered relevant to our review. All studies were performed with an acceptable reference standard and avoided differential verification bias and incorporation bias. Overall, 100% (16/16) of the studies clearly met the study selection criteria.
Table 3.
Quality Assessment of Diagnostic Accuracy Studies (QUADAS) results for the 16 eligible studies.

3.3. Heterogeneity among included studies
For the 2 different magnetic field strengths, we analyzed the threshold outcomes using MetaDisc1.4 software. For 1.5-T MRI, we calculated an rs of −0.164 with P equal to .529 and b (1) of –0.077 with P equal to .802. For 3.0-T MRI, the rs was −0.251 with P equal to .387, and b (1) was 0.184 with P equal to .571. Neither magnetic field strength for MRI appeared to have a threshold effect. The test of interstudy heterogeneity among 16 studies demonstrated that they were statistically significantly heterogeneous (P < .05, I2>80%).
To reduce the heterogeneity among the clinical studies, we performed separate meta-analyses for lesions of the different tissue types (articular cartilage, ligament, and meniscus).
3.4. Diagnostic accuracy of 1.5-T and 3.0-T MRI for lesions of the knee
3.4.1. Articular cartilage
Five of the included clinical studies were specifically designed to analyze the diagnostic accuracy of 1.5-T and/or 3.0-T MRI for cartilage lesions in the knee in patients.[1,6,13–15] For these 5 studies, the pooled specificity, sensitivity, positive likelihood ratio (+LR), negative likelihood ratio (−LR), and DOR values for 1.5-T MRI were 0.664, 0.826, 4.222, 0.414, and 9.383, respectively. The pooled specificity, sensitivity, +LR, −LR, and DOR values for 3.0-T MRI were 0.702, 0.851, 4.988, 0.304, and 17.765, respectively.
From Moses-type sROC curve plots for 1.5-T and 3.0-T MRI of articular cartilage lesions, the Q test for heterogeneity demonstrated wide homogeneity among all studies (P > .05), including those reporting 1.5-T and/or 3.0-T MRI results. From these sROC curves, we also calculated the AUC values to be 0.7867 for 1.5-T MRI and 0.9106 for 3.0-T MRI. A significant difference was detected in the diagnostic effectiveness of 1.5-T and 3.0-T MRI (Z = 3.4, P < .05), and the diagnostic effectiveness of 1.5-T MRI (Fig. 2) for articular cartilage lesions was lower than that of 3.0-T (Fig. 3) MRI.
Figure 2.

Moses-type sROC curves for the diagnosis of articular cartilage lesions on 1.5-T MRI. MRI = magnetic resonance imaging, sROC = summary receiver operating characteristic.
Figure 3.
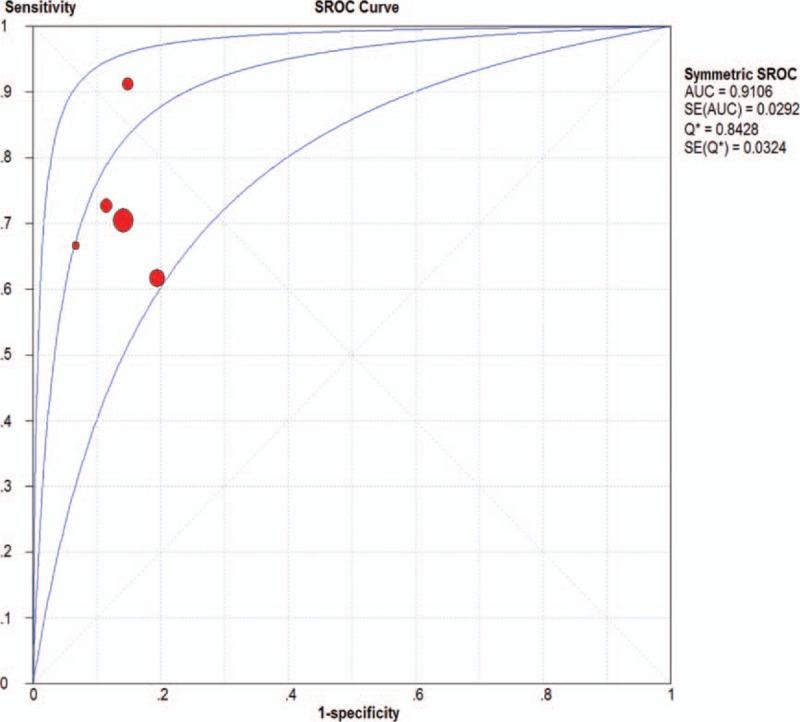
Moses-type sROC curves for the diagnosis of articular cartilage lesions on 3.0-T MRI. MRI = magnetic resonance imaging, sROC = summary receiver operating characteristic.
3.4.2. Ligament
Five of the included clinical studies were specifically designed to analyze the diagnostic accuracy of 1.5-T and/or 3.0-T MRI for ligament lesions in patients.[10,13,16–18] For these 5 studies, the pooled specificity, sensitivity, +LR, −LR, and DOR values for 1.5-T MRI were 0.834, 0.977, 47.346, 0.186, and 322.99, respectively, and those for 3.0-T MRI were 0.648, 0.969, 20.144, 0.246, and 124.80, respectively (Table 4).
Table 4.
Pooled sensitivity, specificity, +LR, −LR, and DOR of 1.5-T and 3.0-T MRI for detection across subgroups.

From the Moses-type sROC curves for 1.5-T and 3.0-T MRI of lesions within the knee ligaments, the Q test for heterogeneity demonstrated a wide homogeneity among all studies (P > .05), including those reporting 1.5-T and/or 3.0-T MRI results. For these sROC curves, we also calculated the AUC to be 0.9787 for 1.5-T MRI and 0.9894 for 3.0-T MRI. We observed no significant difference in the diagnostic accuracy of 1.5 T (Fig. 4) and 3.0 T (Fig. 5) MRI for lesions in knee ligaments (Z = 0.32, P > .05).
Figure 4.
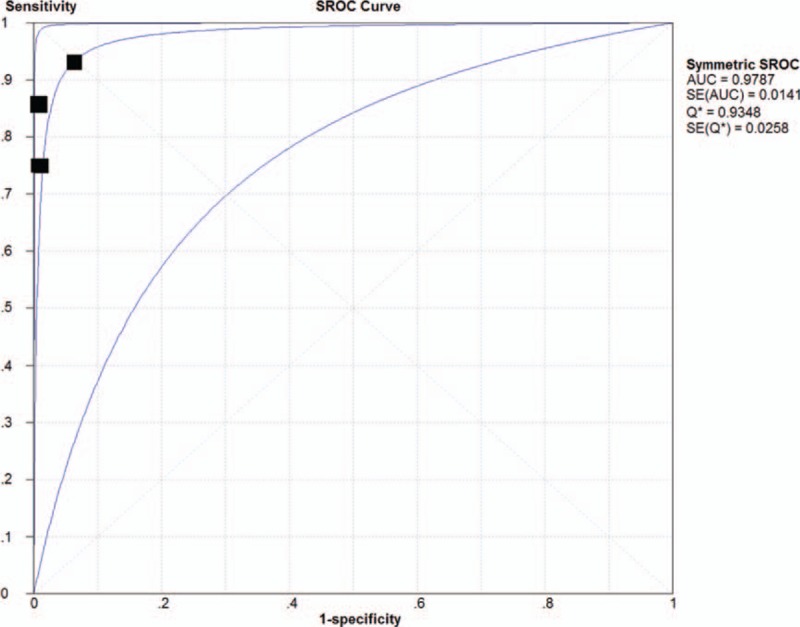
Moses-type sROC curve for the diagnosis of lesions of the ligament on 1.5- T MRI. MRI = magnetic resonance imaging, sROC = summary receiver operating characteristic.
Figure 5.
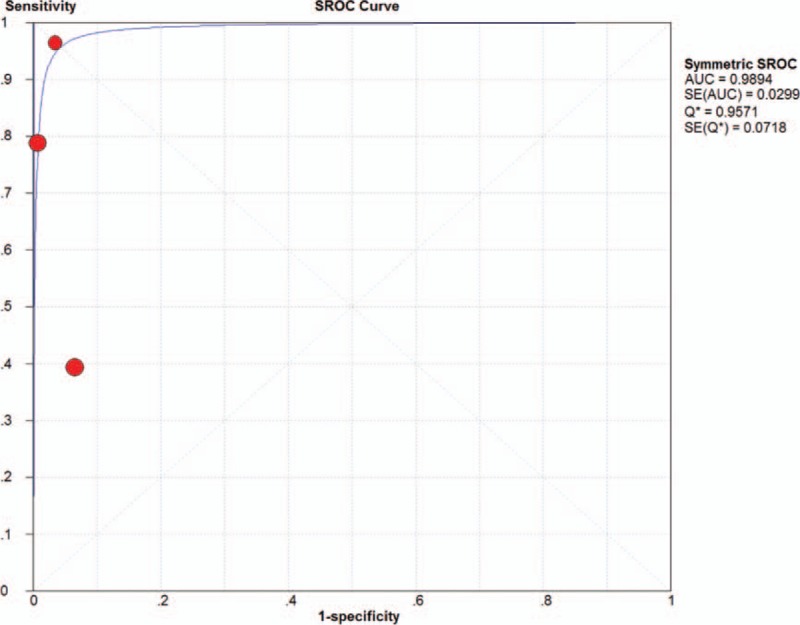
Moses-type sROC curve for the diagnosis of lesions of the ligament on 3.0-T MRI. MRI = magnetic resonance imaging, sROC = summary receiver operating characteristic.
3.4.3. Meniscus
Twelve of the included clinical studies were specifically designed to analyze the diagnostic accuracy of 1.5-T and/or 3.0-T MRI for meniscal tears in patients.[10,13,15–24] For these 12 studies, the pooled specificity, sensitivity, +LR, −LR, and DOR values for 1.5-T MRI were 0.809, 0.942, 11.598, 0.172, and 71.130, respectively, and the pooled specificity, sensitivity, +LR, −LR, and DOR values for 3.0-T MRI were 0.753, 0.884, 10.464, 0.164, and 62.555, respectively.
From Moses-type sROC curves for 1.5-T and 3.0-T MRI of meniscal lesions, the Q test for heterogeneity demonstrated a wide homogeneity among all studies (P > .05), including those reporting 1.5-T and/or 3.0-T MRI results. From these sROC curves, we also calculated the AUC values to be 0.9681 for 1.5-T MRI and 0.9578 for 3.0-T MRI. We observed no significant difference in the diagnostic accuracy of 1.5-T (Fig. 6) and 3.0-T (Fig. 7) MRI for meniscal lesions (Z = 0.33, P > .05).
Figure 6.
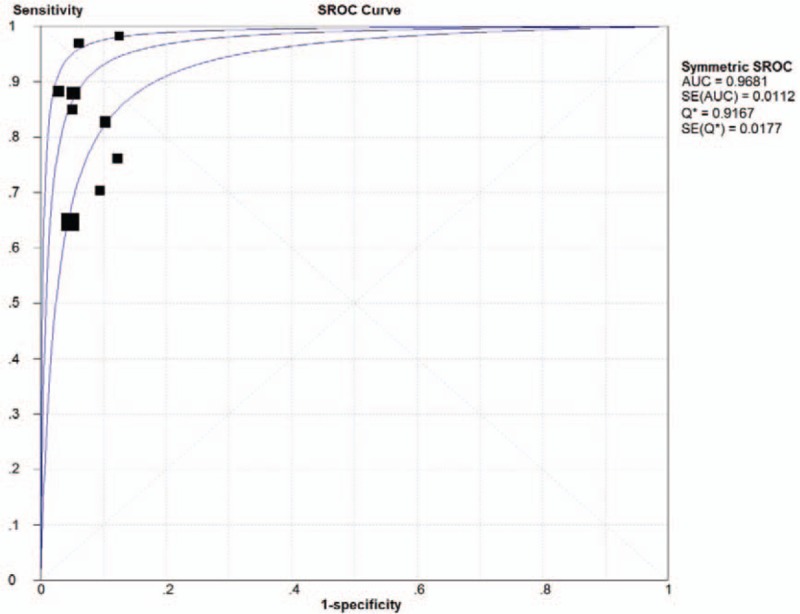
Moses-type sROC curve for the diagnosis of meniscal lesions on 1.5-T MRI. MRI = magnetic resonance imaging, sROC = summary receiver operating characteristic.
Figure 7.
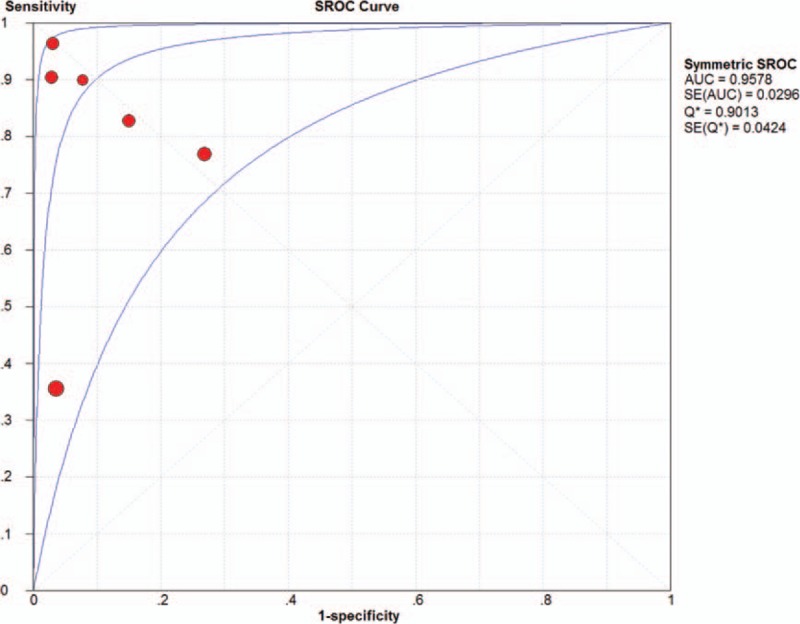
Moses-type sROC curve for the diagnosis of meniscal lesions on 3.0-T MRI. MRI = magnetic resonance imaging, sROC = summary receiver operating characteristic.
4. Discussion
At present, MRI is applied as a reliable method for the detection of knee injuries. In particular, intra-articular injuries can be diagnosed on MRI with a high degree of accuracy, and traditionally, 1.5-T MRI has been the standard for evaluating articular lesions.[25] More recently, some studies have reported that 3.0-T MRI provides better visualization of the knee lesions compared with 1.5-T MRI, with increased sensitivity and specificity in animal and cadaver models.[7–9] The major advantage of high-field strength MRI is the improvement in the signal-to-noise ratio, which can be used to either increase image resolution or decrease scan time and the chance for motion artifacts.
Our results confirm that both 1.5-T and 3.0-T MRI show a high degree of diagnostic accuracy and clinical relevance for the diagnosis of lesions within the ligaments and meniscus of the knee. However, 3.0-T MRI of the knee does not yield a significantly higher diagnostic accuracy than 1.5-T MRI for detecting meniscal and ligament tears. Utilizing higher in-plane resolution for all sequences and thinner slices for the sagittal proton density-weighted sequence on 3.0-T MRI compared with 1.5-T MRI only modestly improved the diagnostic performance, and we were unable to demonstrate a statistically significant effect. Although these results may seem surprising at first glance, they are not completely unexpected. First, the evaluation of meniscal and ligament pathology with standard magnetic field strengths (<1.5 T) has been generally successful. Thus, any further improvement with higher-field strength systems is likely to be small. Second, image quality and diagnostic accuracy are not determined only by magnetic field strength; other factors, such as imaging planes and coil technology, also play critical roles in the ultimate diagnostic accuracy of the MRI examination. Notably, between the groups examined by 1.5-T and 3.0-T MRI, a major difference in the mean time between MRI and arthroscopy was observed. In the study by Magee and Williams,[20] all arthroscopic procedures were performed within 30 days of the 3.0-T MRI examination, with a mean interval of 8 days. However, in the study by Lee et al,[21] the mean time between the 1.5-T MRI examination and arthroscopy was 192 days. This difference in time to arthroscopy likely accounts for the lower specificity and sensitivity of 1.5-T MRI in the diagnosis of meniscal tears. Meniscal peripheral longitudinal tears are known to heal spontaneously, so the longer delay to arthroscopy likely allowed these tears time to heal before arthroscopy.
Our results showed increased diagnostic performance for assessment of knee articular cartilage for 3.0-T MRI compared with 1.5-T MRI. Kijowski et al[1] reported a significant increase in the specificity and accuracy at 3.0 T in comparison with 1.5 T (specificity of 78.0% at 1.5 T and 85.9% at 3.0 T; accuracy of 74.5% at 1.5 T and 80.1% at 3.0 T) in 200 patients with arthroscopic correlation, but found no significant difference in sensitivity (69.3% and 70.5%). In contrast, Van Dyck et al[10] showed that 3.0 T MRI had a significantly higher sensitivity for the assessment of articular cartilage lesions in 200 patients (69% at 3.0 T compared with 60% at 1.5 T), but not a higher specificity or accuracy. Moreover, 3.0-T MRI has been shown to have better diagnostic performance in experimental animal studies. Link et al[26] showed a statistically significant increased AUC value at 3.0 T in comparison with 1.5 T in a study of 27 porcine knees. The superior SNR and contrast noise ratio of 3.0-T images and the sequences with high spatial resolution, thinner slices, and smaller interslice gap have been used in some studies to improve the detection of cartilage lesions in the knee joint. However, the MRI protocol had significantly lower accuracy for detecting cartilage lesions than lesions in the meniscus and ligaments at both 3.0 T and 1.5 T MRI. The low accuracy of these protocols is primarily attributed to suboptimal spatial resolution. However, additional factors, such as partial volume averaging and inadequate tissue contrast, also play important roles in their diagnosis. Furthermore, if a long interval passes between imaging and arthroscopy, further cartilage damage or new cartilage lesions may occur.
This study has several limitations. First, the 1.5-T and 3.0-T MRI protocols were performed in different patient populations. Also, the accuracy of the MRI reports is impacted by the radiologists’ experience. The study design may be limited by a lack of analysis and comparison with other MRI protocol parameters that affect diagnostic image quality such as coil selection, pulse sequence, 2-dimensional versus 3-dimensional, field of view, matrix, and bandwidth. Some of the observers employed in these studies had used only 1.0- and 1.5-T systems in recent years, and they were therefore not accustomed to the typical 3.0-T images. Differences in the definitions of lesions among several reports also could influence the accuracy of the diagnosis. Differentiating between cartilage lesions that are less than or greater than 50% of the depth may be challenging with arthroscopy as the bone surface is not exposed. The same applies for meniscal lesions, where radiologists may diagnose lesions in the red zone of the meniscus, but these could not be verified because of the difficulty examining this area with arthroscopy. Furthermore, the present study demonstrated a wide heterogeneity among the results of published studies. This heterogeneity and the low number of included studies suggest the need for caution when interpreting the finding of our analyses.
5. Conclusion
In conclusion, the results of our systematic analysis and meta-analysis indicate that both 1.5-T and 3.0-T MRI offer high diagnostic accuracy and clinical relevance for assessment of both the meniscus and ligaments, without significant differences between them. However, 3.0-T MRI offers a significantly higher accuracy for the detection of cartilage lesions in the knee, compared with a similar protocol performed at 1.5 T.
Author contributions
Data curation: Fengchao Zhao.
Formal analysis: Qi Cheng.
Funding acquisition: Fengchao Zhao.
Methodology: Qi Cheng.
Software: Qi Cheng.
Supervision: Fengchao Zhao.
Validation: Fengchao Zhao.
Visualization: Fengchao Zhao.
Writing – original draft: Qi Cheng.
Writing – review & editing: Qi Cheng.
Footnotes
Abbreviations: +LR = positive likelihood ratio, AUC = areas under the curve, DOR = diagnostic odds ratio, −LR = negative likelihood ratio, MRI = magnetic resonance imaging, NPV = negative predictive value, PPV = positive predictive value, ROC = receiver operating characteristic, SNR = signal-to-noise ratio.
The authors have no conflicts of interest to disclose.
References
- [1].Kijowski R, Blankenbaker DG, Davis KW, et al. Comparison of 1.5- and 3.0-T MR imaging for evaluating the articular cartilage of the knee joint. Radiology 2009;250:839–48. [DOI] [PubMed] [Google Scholar]
- [2].Laprade RF, Ho CP, James E, et al. Diagnostic accuracy of 3.0 T magnetic resonance imaging for the detection of meniscus posterior root pathology. Knee Surg Sports Traumatol Arthrosc 2015;23:152–7. [DOI] [PubMed] [Google Scholar]
- [3].Phelan N, Rowland P, Galvin R, et al. A systematic review and meta-analysis of the diagnostic accuracy of MRI for suspected ACL and meniscal tears of the knee. Knee Surg Sports Traumatol Arthrosc 2016;24:1525–39. [DOI] [PubMed] [Google Scholar]
- [4].Figueroa D, Calvo R, Vaisman A, et al. Knee chondral lesions: incidence and correlation between arthroscopic and magnetic resonance findings. Arthroscopy 2007;23:312–5. [DOI] [PubMed] [Google Scholar]
- [5].Vaz CE, Camargo OP, Santana PJ, et al. Accuracy of magnetic resonance in identifying traumatic intraarticular knee lesions. Clinics (Sao Paulo) 2005;60:445–50. [PubMed] [Google Scholar]
- [6].Wong S, Steinbach L, Zhao J, et al. Comparative study of imaging at 3.0 T versus 1.5 T of the knee. Skeletal Radiol 2009;38:761–9. [DOI] [PMC free article] [PubMed] [Google Scholar]
- [7].Barr C, Bauer JS, Malfair D, et al. MR imaging of the ankle at 3 Tesla and 1.5 Tesla: protocol optimization and application to cartilage, ligament and tendon pathology in cadaver specimens. Eur Radiol 2007;17:1518–28. [DOI] [PubMed] [Google Scholar]
- [8].Takao S, Nguyen TB, Yu HJ, et al. T1rho and T2 relaxation times of the normal adult knee meniscus at 3T: analysis of zonal differences. BMC Musculoskelet Disord 2017;18:202. [DOI] [PMC free article] [PubMed] [Google Scholar]
- [9].Cha JG, Yoo JH, Rhee SJ, et al. MR imaging of articular cartilage at 1.5T and 3.0T: comparison of IDEAL 2D FSE and 3D SPGR with fat-saturated 2D FSE and 3D SPGR in a porcine model. Acta Radiol 2014;55:462–9. [DOI] [PubMed] [Google Scholar]
- [10].Van Dyck P, Vanhoenacker FM, Lambrecht V, et al. Prospective comparison of 1.5 and 3.0-T MRI for evaluating the knee menisci and ACL. J Bone Joint Surg Am 2013;95:916–24. [DOI] [PubMed] [Google Scholar]
- [11].Oei EH, Nikken JJ, Verstijnen AC, et al. MR imaging of the menisci and cruciate ligaments: a systematic review. Radiology 2003;226:837–48. [DOI] [PubMed] [Google Scholar]
- [12].Whiting PF, Weswood ME, Rutjes AW, et al. Evaluation of quadas, a tool for the quality assessment of diagnostic accuracy studies. BMC Med Res Methodol 2006;6:9. [DOI] [PMC free article] [PubMed] [Google Scholar]
- [13].Krampla W, Roesel M, Svoboda K, et al. MRI of the knee: how do field strength and radiologist's experience influence diagnostic accuracy and interobserver correlation in assessing chondral and meniscal lesions and the integrity of the anterior cruciate ligament? Eur Radiol 2009;19:1519–28. [DOI] [PubMed] [Google Scholar]
- [14].Mandell JC, Rhodes JA, Shah N, et al. Routine clinical knee MR reports: comparison of diagnostic performance at 1.5 T and 3.0 T for assessment of the articular cartilage. Skeletal Radiol 2017;46:1487–98. [DOI] [PubMed] [Google Scholar]
- [15].von Engelhardt LV, Kraft CN, Pennekamp PH, et al. The evaluation of articular cartilage lesions of the knee with a 3-Tesla magnet. Arthroscopy 2007;23:496–502. [DOI] [PubMed] [Google Scholar]
- [16].Craig JG, Go L, Blechinger J, et al. Three-tesla imaging of the knee: initial experience. Skeletal Radiol 2005;34:453–61. [DOI] [PubMed] [Google Scholar]
- [17].Esmaili Jah AA, Keyhani S, Zarei R, et al. Accuracy of MRI in comparison with clinical and arthroscopic findings in ligamentous and meniscal injuries of the knee. Acta Orthop Belg 2005;71:189–96. [PubMed] [Google Scholar]
- [18].Khan Z, Faruqui Z, Ogyunbiyi O, et al. Ultrasound assessment of internal derangement of the knee. Acta Orthop Belg 2006;72:72–6. [PubMed] [Google Scholar]
- [19].Grossman JW, De Smet AA, Shinki K. Comparison of the accuracy rates of 3-T and 1.5-T MRI of the knee in the diagnosis of meniscal tear. AJR Am J Roentgenol 2009;193:509–14. [DOI] [PubMed] [Google Scholar]
- [20].Magee T, Williams D. 3.0-T MRI of meniscal tears. AJR Am J Roentgenol 2006;187:371–5. [DOI] [PubMed] [Google Scholar]
- [21].Lee SY, Jee WH, Kim JM. Radial tear of the medial meniscal root: reliability and accuracy of MRI for diagnosis. AJR Am J Roentgenol 2008;191:81–5. [DOI] [PubMed] [Google Scholar]
- [22].Arif U, Shah ZA, Khan MA, et al. Diagnostic accuracy of 1.5 tesla MRI in the diagnosis of meniscal tears of knee joint. Pak J Med Sci 2013;7:227–30. [Google Scholar]
- [23].Timotijevic S, Vukasinovic Z, Bascarevic Z. Correlation of clinical examination, ultrasound sonography, and magnetic resonance imaging findings with arthroscopic findings in relation to acute and chronic lateral meniscus injuries. J Orthop Sci 2014;19:71–6. [DOI] [PubMed] [Google Scholar]
- [24].Alizadeh A, Babaei Jandaghi A, Keshavarz Zirak A, et al. Knee sonography as a diagnostic test for medial meniscal tears in young patients. Eur J Orthop Surg Traumatol 2013;23:927–31. [DOI] [PubMed] [Google Scholar]
- [25].Deshpande BR, Losina E, Smith SR, et al. Association of MRI findings and expert diagnosis of symptomatic meniscal tear among middle-aged and older adults with knee pain. BMC Musculoskelet Disord 2016;17:154. [DOI] [PMC free article] [PubMed] [Google Scholar]
- [26].Link TM, Sell CA, Masi JN, et al. 3.0 vs 1.5 T MRI in the detection of focal cartilage pathology—ROC analysis in an experimental model. Osteoarthritis Cartilage 2006;14:63–70. [DOI] [PubMed] [Google Scholar]


