

Supplemental Digital Content is available in the text
Keywords: diabetic retinopathy, metabolic syndrome, observational studies, risk factor
Abstract
Emerging studies have reported the effects of metabolic syndrome (MetS) and its components on risk of diabetic retinopathy (DR), but the results remain controversial. Therefore, we performed a meta-analysis to evaluate the relationship between MetS and risk of DR.
A meta-analysis of observational studies.
Studies were searched from PubMed, Cochrane Library, and Elsevier databases from the start of the database up until November 30, 2017. Adjusted odds ratios (ORs) and its corresponding 95% confidence intervals (CIs) were extracted and pooled by using a random effects model.
A total of 12 observational studies were included in this meta-analysis. When the MetS as a full syndrome, MetS was not associated with increased risks of type 1 (OR = 1.47, 95% CI 0.67–3.24; P = .34) or type 2 (OR = 1.34, 95% CI 0.91–1.98; P = .14) DR. In addition, none of single component of MetS was associated with the risk of DR, including body mass index/waist circumference (BMI/WC) (OR = 0.92, 95% CI 0.75–1.13; P = .41), blood pressure (OR = 1.37, 95% CI 0.96–1.95; P = .08), high density lipoprotein (OR = 0.97, 95% CI 0.93–1.01; P = .19), and triglyceride (OR = 0.85, 95% CI 0.63–1.15; P = .29). In the sensitivity analysis, the pooled OR values were not changed after we removed the included studies one by one.
Based on recent published data, neither MetS nor its components are associated with an increased risk of DR.
1. Introduction
Diabetic retinopathy (DR), one of the most common microvascular complications of diabetes mellitus (DM), is a frequent cause of acquired blindness worldwide. With the increasing morbidity of DM, it has reported that the population of vision-threatening DR increased to 4.2 million worldwide.[1] As we know, duration of DM and degree of hyperglycemia are the 2 classical risk factors for DR.[2] However, a well glucose control is reported to have limited effects on preventing the development of DR.[3] Therefore, to explore the modifiable risk factors involved in the development of DR become increasingly imperative.
Metabolic syndrome (MetS), defined as a constellation of metabolic abnormalities with obesity, glucose intolerance, hypertension, elevated triglyceride (TG), and low level of high density lipoprotein cholesterol (HDL), is a risk factor for cardiovascular complications of the type 2 DM.[4] In addition to the macrovascular complications of DM, the potential association between MetS and DR has been also investigated but with inconclusive results.[5–8] A large multicentre clinic-based study[9] from Italy reported an increased risk of type 2 diabetic retinopathy (T2DR) rather than type 1 diabetic retinopathy (T1DR) in patients with MetS. In contrast, another study[10] observed a little lower prevalence of DR in diabetic patients with MetS. In addition, whether the effects of MetS per se exceed the sum of its individual components, or whether the effects of full syndrome can be explained by a single component are still unclear. Hence, we carried out a meta-analysis to assess the effects of metabolic syndrome per se and its components on DR.
2. Methods
This meta-analysis was performed by following the Meta-Analysis of Observational Studies in Epidemiology (MOOSE)[11] and the Preferred Reporting Items for Systematic Reviews and Meta-Analyses (PRISMA).
2.1. Study design
This was a meta-analysis of observational studies, and thus no ethical approval was warranted.
2.2. Literature search and eligibility criteria
We searched the original studies from PubMed, Cochrane Library, and Elsevier databases from the start of the database up until November 30, 2017. Keywords about the endpoint “diabetic retinopathy” in combination with the keywords about exposure (“metabolic syndrome” or “insulin-resistance syndrome” or “syndrome X”) were used to search the relevant studies. Besides, the reference lists of retrieved studies were also reviewed manually for additional studies. No language limitation was used in the process.
Studies were included if they met all of the following criteria: observational studies evaluating the effects of MetS on DR, or the effects of components of MetS (e.g., body mass index or waist [BMI/WC], blood pressure [BP], TG or HDL, and hyperglycemia) on DR; studies reporting adjusted odds ratios (ORs) and corresponding 95% confidence intervals (CIs) were available. Certain publication types with data (e.g., reviews, letters, case reports, comments) were excluded in this analysis. Besides, in the cohort studies, we preferred to include the one with the longest follow-up time. In addition, if one cohort was more than once published, we extracted the most recent one.
2.3. Definitions of metabolic syndrome
The definitions of MetS used in the included studies varied, including the International Diabetes Federation (IDF) criteria,[12] the National Cholesterol Education Program's Adult Treatment Panel III (ATP III) criteria,[13,14] the Chinese Diabetes Society (CDS) criteria,[15] the World Health Organization (WHO) criteria,[16] and an incorporated criteria[17] (Supplementary Table 1). Specially, 2 studies[18,19] adopted >1 definitions, and we selected the data concluded from ATP III criteria, which was regarded as the most widely used definition.
2.4. Data extraction
ZY, WCY, and SK retrieved the following data independently: last name of the first author, publication year, geographic region of original study, design of study, sample size, age range, and sex composition of study population, definitions of MetS, outcomes and risk estimates. Notably, if several ORs were available in one study, the most fully adjusted one was extracted. For quality assessment, Newcastle-Ottawa scale (NOS)[20] was adopted for the cohort studies, which rated the quality with a score from 0 (high risk of bias) to 9 (low risk of bias). Similarly, a modified version of the NOS[20,21] with a total score of 10 (low risk of bias) was applied to assess the quality of cross-sectional and case control studies. Studies with a summary score above the median were considered to have low risk of bias. Any disagreements were discussed with YXL.
2.5. Statistical analysis
The process of all the statistical analyses was performed by the statistical software Revman Manager 5.3 (Nordic Cochrane Center; http://ims.cochrane.org/revman). We focused on the effects of MetS and its components on the risk of DR. The ORs and 95%CIs were accordingly transformed to natural logarithm (logOR) and standard error (SE). A random effects model, which was more conservative and may provide better estimates with wider CIs than a fixed effects model for any heterogeneity, was used to pool the risk estimates.[22] Heterogeneity across the included studies was assessed with the I2 test, where I2 ≥25%, I2 ≥50%, and ≥75% were defined as low, moderate, and high heterogeneity, respectively. We performed the subgroup analysis, and sensitivity analysis was conducted by removing one study at a time. A P-value <.05 was regarded as statistically significant.
3. Results
3.1. Study selection
As shown in Fig. 1, a total of 617 articles were initially identified from the databases, of which 28 duplicated articles were removed. Among the remaining 589 articles, we excluded another 570 articles after screening the titles and/or abstracts. The potential 19 relevant articles were thoroughly assessed for eligibility, and 7 of them were excluded for different reasons. One study[23] was a review about association between MetS and multiple eye diseases. The other 6 studies[5–10] had no available risk estimates. Finally, 12 studies[18,19,24–33] were included in this meta-analysis (7 cross-sectional studies,[18,19,25,28,31–33] 2 case control studies,[24,27] and 3 cohort studies[26,29,30]).
Figure 1.
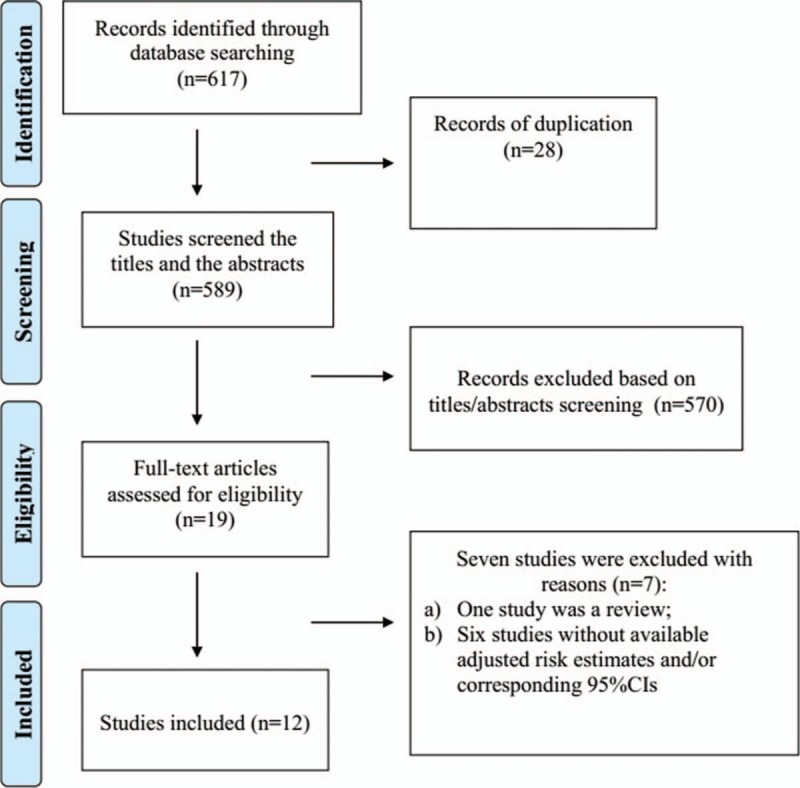
Study search diagram.
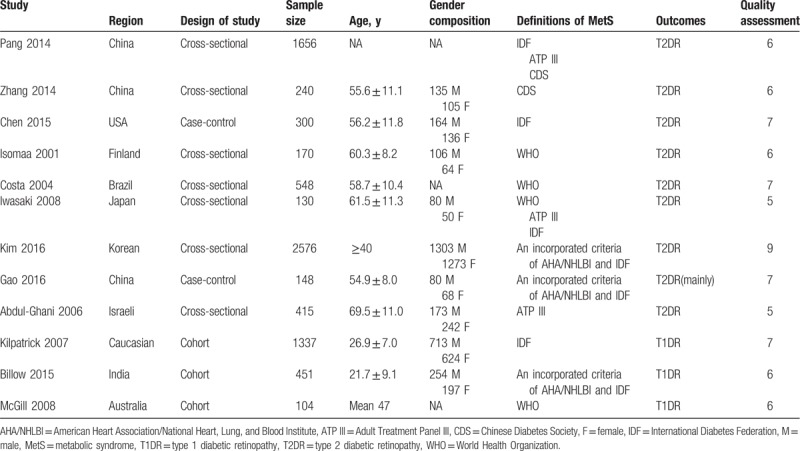
Among the included studies, 1 study[28] used the CDS criteria for the diagnosis of MetS. Another one study[31] adhered to the ATP III criteria. Two studies[27,30] diagnosed the MetS according to the IDF criteria. Three studies[29,32,33] defined the patients with MetS on the basis of WHO criteria. A study[18] by Pang et al examined the prevalence of DR following 3 different definitions (IDF, ATP III, and CDS). Another one study[19] conducted in Japan calculated the effects of MetS confirmed to IDF, ATP III, and WHO criteria, respectively. The remaining 3 studies[24–26] used an incorporated definition. All of the basic characteristics and the reporting quality of the included studies were shown in Table 1. Notably, the study by Pang et al[18] was to assess the effects of MetS on albuminuria and DR, in which a total of 3240 participants, including 1229 males and 2011 females, with an average age of 60.7 ± 11.0 years were analyzed. Among them, only 1656 participants with/without MetS were diagnosed with diabetes. Since the purpose of this meta-analysis was to evaluate the effects of MetS on DR in diabetic patients, only the 1656 diabetic patients were finally included. Besides, the average age and sex composition offered in the original study were calculated based on the whole 3240 participants, so the detailed average age and sex composition of the diabetics were not available.
Table 1.
Characteristics of the 12 included studies in this meta-analysis.
3.2. Meta-analysis
3.2.1. MetS and risk of DR
A total of 9 studies[18,19,24,25,27,28,31–33] evaluated the effects of MetS on risk of T2DR. As shown in Fig. 2, MetS was not associated with the risk of T2DR (OR = 1.34, 95% CI 0.91–1.98; P = .14). Meanwhile, we performed the subgroup analysis based on study design or region of participants. As shown in Supplementary Table 2, we observed no differences in the association of MetS with risk of T2DR between case control studies (OR = 1.42, 95% CI 0.38–5.26; P = .83) and cross-sectional studies (OR = 1.35, 95% CI 0.88–2.06; P = .17) or between Asians (OR = 1.29, 95% CI 0.81–2.06; P = .29) and non-Asians (OR = 1.47, 95% CI 0.60–3.59; P = .40). In addition, 3 studies[26,29,30] evaluated the effects of MetS on risk of T1DR. We found that there was no significant relationship between MetS and risk of T1DR (OR = 1.47, 95% CI 0.67–3.24; P = .34). We did not performed the subgroup analysis in this part because of the limiting included studies.
Figure 2.
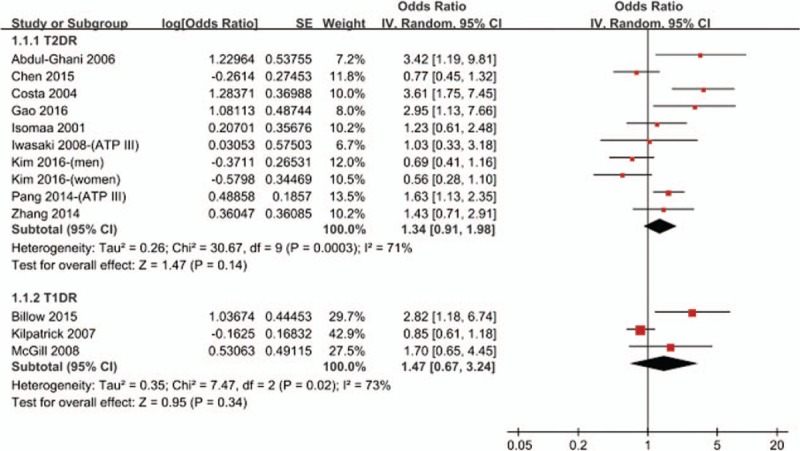
Meta-analysis of association between metabolic syndrome and the risk of DR. CI = confidence interval, DR = diabetic retinopathy, IV = inverse of the variance, SE = standard error.
3.2.2. Components of MetS and risk of DR
A total of 5 studies[18,19,25,27,33] assessed the effects of components of MetS on the development of T2DR. Among them, 5 studies assessed the effects of BMI/WC, and BP,[18,19,25,27,33] while 4 studies offered the data of HDL and TG.[18,19,25,27] However, since the purpose of this meta-analysis was to evaluate the relationship between MetS and risk of DR in diabetics, hyperglycemia was presented in all of the participants. Thus, although hyperglycemia was one of the 5 metabolic risk factors for MetS, the relationship between hyperglycemia and risk of DR was unfeasible to be explored in this meta-analysis. As shown in Fig. 3, none of these components were associated with the risk of DR: BMI/WC (OR = 0.92, 95% CI 0.75–1.13; P = .41), BP (OR = 1.37, 95% CI 0.96–1.95; P = .08), HDL (OR = 0.97, 95% CI 0.93–1.01; P = .19), and TG (OR = 0.85, 95% CI 0.63–1.15; P = .29).
Figure 3.
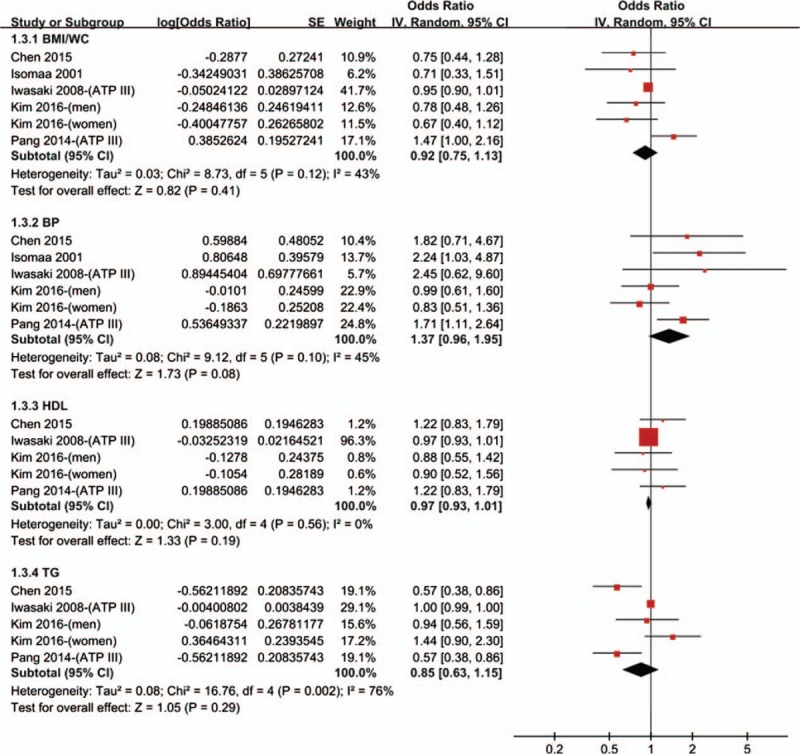
Meta-analysis of association between individual components and the risk of T2DR. CI = confidence interval, IV = inverse of the variance, SE = standard error, T2DR = type 2 diabetic retinopathy.
3.3. Publication bias and sensitivity analysis
According to the Cochrane book, if <10 studies are included, neither funnel plots nor statistical tests (i.e., Begg test and Egger test) can be used meaningfully to test for publication bias. Since 9 studies evaluated the effects of MetS on risk of T2DR, and 3 studies on risk of T1DR, we did not examine the publication bias in this meta-analysis. In spite of this, the results were not changed in the sensitivity analysis as performed by removing the included studies one by one.
4. Discussion
In the past years, the effects of MetS on the prevalence of DR have been reported, but the results are controversial. To our knowledge, this is the first meta-analysis of a mixture of published studies from different regions to exam the relationship between MetS and risk of DR. This meta-analysis showed that MetS was not associated with increased risks of T2DR or T1DR. In addition, the results from subgroup analysis based on different geographical locations and study types also supported the primary results. Furthermore, none of metabolic syndrome's components including BMI/WC, BP, HDL, and TG were associated with the risk of DR. Largely consistent with the findings from the “United Kingdom Prospective Diabetes Study,” [34] a lack of association between MetS and incidence of microvascular outcomes was found after 5102 diabetics were followed for over 10 years. Since significant heterogeneity was observed in our analysis and we failed to find the source of heterogeneity, results should be treated with caution and confirmed in further studies.
A observed phenomenon that MetS is not a risk factor for DR is somewhat surprising, since MetS is involved in the pathogenesis of various vascular conditions including cardiovascular diseases.[34] The role of MetS in the development of DR is complicated. Higher levels of inflammation and oxidative stress in the pathogenesis of MetS may prefer to have more devastating effects on large-vessel diseases than microvascular diseases,[27] but the detailed mechanisms are still unknown. In addition, whether the effects of MetS per se exceed the sum of its individual components, or whether the effects of full syndrome could be explained by a single component are still unclear. Hence, it is imperative to evaluate the effects of each single component of MetS on DR. In this study, none of metabolic syndrome's components were associated with the risk of DR. We speculated that the effects of each component of MetS may be balanced by each other, thus superficially null effects of MetS as a full syndrome were presented finally.
Higher BMI is an indicator of generalized obesity and elevated WC is an indicator of central obesity. Both obesity are associated with multiple metabolic abnormalities.[35] However, there are some differences in the effects of generalized obesity and central obesity on the development of DR. Previously studies[36,37] indicated that higher BMI had no destructive effects or even protective effects on DR. In contrast, elevated WC was reported to be an independent predictor of DR.[36,38] In the pooled analysis, we did not find a significant association between obesity and risk of DR. However, since the studies we included diagnosed obesity based on BMI or WC, the effects of WC may be balanced by BMI. Regretfully, the studies included did not report the separated values of BMIx and WC to measure obesity, we failed to assess the effects of them on DR, separately.
As reported in previous studies, hypertension was a risk factor for development of DR. The United Kingdom Prospective Diabetes study[2] reported that higher systolic blood pressure (SBP) was a predictor for the incidence of DR. And likewise, the Australian Diabetes, Obesity and Lifestyle study[39] demonstrated that elevated SBP had an increasing impact with longer duration of DM and higher HbA1c values, both of which were risk factors for DR. However, as an individual component of MetS, the results from the present meta-analysis showed no association between hypertension and risk of DR. A possible explanation may partly stem from the diagnostic criteria of MetS,[25] since either higher SBP or diastolic blood pressure (DBP) is required for some definitions. Kim et al[25] have reported that elevated SBP instead of DBP is a predictor of DR, consistent with the results from 2 previous studies from United States[40] and United Kingdom,[41] respectively. In our meta-analysis, we both included the SBP and DBP, and thereby the effects of DBP may alleviate the association between hypertension and risk of DR. However, we will not oppose conflict with the classical conclusion that hypertension is an independent risk factor for DR. Because of the limiting included studies, we could not perform the subgroup analysis based on the type of BP. The possible association and the potential mechanisms between DBP and risk of DR should be further investigated.
In the present study, it showed that TG was not associated with the risk of DR, consistent with the current meta-analysis of Song et al.[42] Besides, although there was still no meta-analysis reporting the relationship between HDL and DR, our meta-analysis first reported that HDL was not associated with the risk of DR. In line with our finding, data of a global large-scale case-control study from 13 countries demonstrated that DR was not associated with lower HDL after adjusting for several risk factors including hypertension.[43]
Except for assessing the MetS as a full syndrome or its single component, the effects of total numbers of metabolic components on the risk of DR also should be taken into accounts. Indeed, a study showed a 2.7 times higher risk of DR in patients with MetS which comprised of 3 components, while a 4.4 times higher risk of DR in patients with MetS which comprised of 5 components.[18] Similar phenomenon is also observed in another case-control study from China.[24]
4.1. Limitations
Because of the limited number of studies, there were some limitations should not be neglected. First, most of the included studies were in a cross-sectional design, which could not confirm a causal relationship. In addition, it is known that the MetS is quite different in Asian and in Caucasian patients, and thus likely causes another source of uncertainty. Nevertheless, we performed the subgroup analysis based on different geographical locations and study types, and demonstrated similar results. Second, as there are major differences in the annotation of patients to the different definitions of MetS, there is large heterogeneity to be expected from this parameter. We probably did not have sufficient numbers for analysis if we had used only studies with identical definitions of the MetS. Third, significant heterogeneity was observed between studies, which may result from the definition variation of MetS and other unknown factors. Regretfully, we failed to explore the source of heterogeneity. In spite of this, the results were not changed in the sensitivity analysis. Lastly, although we only included adjusted risk estimates, not all the potential confounders were taken into account, which may confuse the final results.
5. Conclusions
In conclusion, based on the current publications, we found that MetS and its components were not significantly associated with an increased risk of DR. However, considering the limitations existed, further studies would be urgently necessary.
Author contributions
ZY, WCY, and SK took part in the whole work with the help of YXL.
Data curation: Yue Zhou, Changyun Wang, Ke Shi.
Formal analysis: Changyun Wang, Ke Shi.
Funding acquisition: Xiaolong Yin.
Methodology: Xiaolong Yin.
Resources: Xiaolong Yin.
Supervision: Xiaolong Yin.
Writing – original draft: Yue Zhou.
Writing – review & editing: Yue Zhou.
Supplementary Material
Footnotes
Abbreviations: ATP III = Adult Treatment Panel III, BMI/WC = body mass index or waist circumference, BP = blood pressure, CDS = Chinese Diabetes Society, CI = confidence interval, DBP = diastolic blood pressure, DM = diabetes mellitus, DR = diabetic retinopathy, HDL = high density lipoprotein cholesterol, IDF = International Diabetes Federation, logOR = natural logarithm, MetS = metabolic syndrome, NOS = Newcastle-Ottawa scale, OR = odds ratio, Rx = treatment, SBP = systolic blood pressure, SE = standard error, T1DR = type 1 diabetic retinopathy, T2DR = type 2 diabetic retinopathy, TG = triglyceride, WHO = World Health Organization.
YZ, CW, and KS are co-first authors.
Funding: None.
Ethical approval: No ethical approval is warranted as a meta-analysis of the articles available.
No conflicts of interest exist.
Supplemental Digital Content is available for this article.
References
- [1].ADA. National Diabetes Statistics Report. Vol. 2014; 2014. [Google Scholar]
- [2].Stratton IM, Kohner EM, Aldington SJ, et al. UKPDS 50: risk factors for incidence and progression of retinopathy in Type II diabetes over 6 years from diagnosis. Diabetologia 2001;44:156–63. [DOI] [PubMed] [Google Scholar]
- [3].Ismail-Beigi F, Craven T, Banerji MA, et al. Effect of intensive treatment of hyperglycaemia on microvascular outcomes in type 2 diabetes: an analysis of the ACCORD randomised trial. Lancet 2010;376:419–30. [DOI] [PMC free article] [PubMed] [Google Scholar]
- [4].Bonora E, Targher G, Formentini G, et al. The metabolic syndrome is an independent predictor of cardiovascular disease in Type 2 diabetic subjects. Prospective data from the Verona Diabetes Complications Study. Diabet Med 2004;21:52–8. [DOI] [PubMed] [Google Scholar]
- [5].Liu L, Yue S, Wu J, et al. Prevalence and risk factors of retinopathy in patients with or without metabolic syndrome: a population-based study in Shenyang. BMJ Open 2015;5:e8855. [DOI] [PMC free article] [PubMed] [Google Scholar]
- [6].Mahendra JV, Kumar SD, Anuradha TS, et al. Plasma fibrinogen in Type 2 diabetic patients with metabolic syndrome and its relation with ischemic heart disease (IHD) and retinopathy. J Clin Diagn Res 2015;9:BC18–21. [DOI] [PMC free article] [PubMed] [Google Scholar]
- [7].Duvnjak L, Kokic V, Bulum T, et al. The metabolic syndrome is associated with high-normal urinary albumin excretion and retinopathy in normoalbuminuric type 1 diabetic patients. Coll Antropol 2012;36:1373–8. [PubMed] [Google Scholar]
- [8].Mavrakanas T, Frachebois C, Soualah A, et al. C-peptide and chronic complications in patients with type-2 diabetes and the metabolic syndrome. Presse Med 2009;38:1399–403. [DOI] [PubMed] [Google Scholar]
- [9].Bonadonna R, Cucinotta D, Fedele D, et al. The metabolic syndrome is a risk indicator of microvascular and macrovascular complications in diabetes: results from Metascreen, a multicenter diabetes clinic-based survey. Diabetes Care 2006;29:2701–7. [DOI] [PubMed] [Google Scholar]
- [10].Raman R, Gupta A, Pal SS, et al. Prevalence of metabolic syndrome and its influence on microvascular complications in the Indian population with Type 2 Diabetes Mellitus. Sankara Nethralaya Diabetic Retinopathy Epidemiology And Molecular Genetic Study (SN-DREAMS, report 14). Diabetol Metab Syndr 2010;2:67. [DOI] [PMC free article] [PubMed] [Google Scholar]
- [11].Stroup DF, Berlin JA, Morton SC, et al. Meta-analysis of observational studies in epidemiology: a proposal for reporting. Meta-analysis Of Observational Studies in Epidemiology (MOOSE) group. JAMA 2000;283:2008–12. [DOI] [PubMed] [Google Scholar]
- [12].Alberti KG, Zimmet P, Shaw J. The metabolic syndrome--a new worldwide definition. Lancet 2005;366:1059–62. [DOI] [PubMed] [Google Scholar]
- [13].Grundy SM, Brewer HJ, Cleeman JI, et al. Definition of metabolic syndrome: Report of the National Heart, Lung, and Blood Institute/American Heart Association conference on scientific issues related to definition. Circulation 2004;109:433–8. [DOI] [PubMed] [Google Scholar]
- [14].Executive summary of the third report of the National Cholesterol Education Program (NCEP) Expert Panel on detection, evaluation, and treatment of high blood cholesterol in adults (Adult Treatment Panel III). JAMA 2001; 285:2486–2497. [DOI] [PubMed] [Google Scholar]
- [15].Metabolic syndrome study cooperation group of Chinese diabetes society. Suggestions about metabolic syndrome of Chinese diabetes society. Chin J Diab 2004;12:156–61. [Google Scholar]
- [16].Alberti KG, Zimmet PZ. Definition, diagnosis and classification of diabetes mellitus and its complications. Part 1: diagnosis and classification of diabetes mellitus provisional report of a WHO consultation. Diabet Med 1998;15:539–53. [DOI] [PubMed] [Google Scholar]
- [17].Alberti KG, Eckel RH, Grundy SM, et al. Harmonizing the metabolic syndrome: a joint interim statement of the International Diabetes Federation Task Force on Epidemiology and Prevention; National Heart, Lung, and Blood Institute; American Heart Association; World Heart Federation; International Atherosclerosis Society; and International Association for the Study of Obesity. Circulation 2009;120:1640–5. [DOI] [PubMed] [Google Scholar]
- [18].Pang C, Jia L, Hou X, et al. The significance of screening for microvascular diseases in Chinese community-based subjects with various metabolic abnormalities. PLOS One 2014;9:e97928. [DOI] [PMC free article] [PubMed] [Google Scholar]
- [19].Iwasaki T, Togashi Y, Ohshige K, et al. Neither the presence of metabolic syndrome as defined by the IDF guideline nor an increased waist circumference increased the risk of microvascular or macrovascular complications in Japanese patients with type 2 diabetes. Diabetes Res Clin Pract 2008;79:427–32. [DOI] [PubMed] [Google Scholar]
- [20].Wells G, Shea B, O’Connell D, et al. The Newcastle Ottawa Scale (NOS) for assessing the quality if nonrandomized studies in meta-analyses; 2014. Available at: http://www.ohri.ca/programs/clinical_epidemiology/oxford.asp. Accessed May 30, 2016. [Google Scholar]
- [21].Araujo MM, Martins CC, Costa LC, et al. Association between depression and periodontitis: a systematic review and meta-analysis. J Clin Periodontol 2016;43:216–28. [DOI] [PubMed] [Google Scholar]
- [22].Kontopantelis E, Reeves D. Performance of statistical methods for meta-analysis when true study effects are non-normally distributed: a simulation study. Stat Methods Med Res 2012;21:409–26. [DOI] [PubMed] [Google Scholar]
- [23].Poh S, Mohamed AR, Lamoureux EL, et al. Metabolic syndrome and eye diseases. Diabetes Res Clin Pract 2016;113:86–100. [DOI] [PubMed] [Google Scholar]
- [24].Gao L, Xin Z, Yuan MX, et al. High prevalence of diabetic retinopathy in diabetic patients concomitant with metabolic syndrome. PLoS One 2016;11:e0145293. [DOI] [PMC free article] [PubMed] [Google Scholar]
- [25].Kim TK, Won JY, Shin JA, et al. The association of metabolic syndrome with diabetic retinopathy: the Korean National Health and Nutrition Examination Survey 2008-2012. PLoS One 2016;11:e0157006. [DOI] [PMC free article] [PubMed] [Google Scholar]
- [26].Billow A, Anjana RM, Ngai M, et al. Prevalence and clinical profile of metabolic syndrome among type 1 diabetes mellitus patients in southern India. J Diabetes Complications 2015;29:659–64. [DOI] [PubMed] [Google Scholar]
- [27].Chen JJ, Wendel LJ, Birkholz ES, et al. The metabolic syndrome and severity of diabetic retinopathy. Clin Ophthalmol 2015;9:757–64. [DOI] [PMC free article] [PubMed] [Google Scholar]
- [28].Zhang X, Cui X, Li F, et al. Association between diabetes mellitus with metabolic syndrome and diabetic microangiopathy. Exp Ther Med 2014;8:1867–73. [DOI] [PMC free article] [PubMed] [Google Scholar]
- [29].McGill M, Molyneaux L, Twigg SM, et al. The metabolic syndrome in type 1 diabetes: does it exist and does it matter? J Diabetes Complications 2008;22:18–23. [DOI] [PubMed] [Google Scholar]
- [30].Kilpatrick ES, Rigby AS, Atkin SL. Insulin resistance, the metabolic syndrome, and complication risk in type 1 diabetes: “double diabetes” in the Diabetes Control and Complications Trial. Diabetes Care 2007;30:707–12. [DOI] [PubMed] [Google Scholar]
- [31].Abdul-Ghani M, Nawaf G, Nawaf F, et al. Increased prevalence of microvascular complications in type 2 diabetes patients with the metabolic syndrome. Isr Med Assoc J 2006;8:378–82. [PubMed] [Google Scholar]
- [32].Costa LA, Canani LH, Lisboa HR, et al. Aggregation of features of the metabolic syndrome is associated with increased prevalence of chronic complications in Type 2 diabetes. Diabet Med 2004;21:252–5. [DOI] [PubMed] [Google Scholar]
- [33].Isomaa B, Henricsson M, Almgren P, et al. The metabolic syndrome influences the risk of chronic complications in patients with type II diabetes. Diabetologia 2001;44:1148–54. [DOI] [PubMed] [Google Scholar]
- [34].Cull CA, Jensen CC, Retnakaran R, et al. Impact of the metabolic syndrome on macrovascular and microvascular outcomes in type 2 diabetes mellitus: United Kingdom Prospective Diabetes Study 78. Circulation 2007;116:2119–26. [DOI] [PubMed] [Google Scholar]
- [35].Deepa M, Farooq S, Deepa R, et al. Prevalence and significance of generalized and central body obesity in an urban Asian Indian population in Chennai, India (CURES: 47). Eur J Clin Nutr 2009;63:259–67. [DOI] [PubMed] [Google Scholar]
- [36].Raman R, Rani PK, Gnanamoorthy P, et al. Association of obesity with diabetic retinopathy: Sankara Nethralaya Diabetic Retinopathy Epidemiology and Molecular Genetics Study (SN-DREAMS Report no. 8). Acta Diabetol 2010;47:209–15. [DOI] [PubMed] [Google Scholar]
- [37].Zhou Y, Zhang Y, Shi K, et al. Body mass index and risk of diabetic retinopathy: a meta-analysis and systematic review. Medicine (Baltimore) 2017;96:e6754. [DOI] [PMC free article] [PubMed] [Google Scholar]
- [38].Dirani M, Xie J, Fenwick E, et al. Are obesity and anthropometry risk factors for diabetic retinopathy? The diabetes management project. Invest Ophthalmol Vis Sci 2011;52:4416–21. [DOI] [PubMed] [Google Scholar]
- [39].Tapp RJ, Shaw JE, Harper CA, et al. The prevalence of and factors associated with diabetic retinopathy in the Australian population. Diabetes Care 2003;26:1731–7. [DOI] [PubMed] [Google Scholar]
- [40].Zhang X, Saaddine JB, Chou CF, et al. Prevalence of diabetic retinopathy in the United States. JAMA 2010;304:649–56. [DOI] [PMC free article] [PubMed] [Google Scholar]
- [41].Kostev K, Rathmann W. Diabetic retinopathy at diagnosis of type 2 diabetes in the UK: a database analysis. Diabetologia 2013;56:109–11. [DOI] [PubMed] [Google Scholar]
- [42].Song P, Yu J, Chan KY, et al. Prevalence, risk factors and burden of diabetic retinopathy in China: a systematic review and meta-analysis. J Glob Health 2018;8:010803. [DOI] [PMC free article] [PubMed] [Google Scholar]
- [43].Sacks FM, Hermans MP, Fioretto P, et al. Association between plasma triglycerides and high-density lipoprotein cholesterol and microvascular kidney disease and retinopathy in type 2 diabetes mellitus: a global case-control study in 13 countries. Circulation 2014;129:999–1008. [DOI] [PubMed] [Google Scholar]
Associated Data
This section collects any data citations, data availability statements, or supplementary materials included in this article.