Supplemental Digital Content is available in the text
Keywords: contingent valuation method, cure, quality-adjusted life year, regenerative treatment, South Korea, willingness to pay
Abstract
Cost-effectiveness is 1 of the most important factors in medicine reimbursement, and social willingness to pay (WTP) can provide evidence for the threshold of cost-effectiveness analysis. Recently, the concept of curative medicines has been introduced, so it is necessary to study their cost-effectiveness. This study aimed to estimate WTP per quality-adjusted life year (QALY) for a cure in the Korean general population.
A total of 507 people from the general population, proportionally assigned by sex, age, and region, participated in face-to-face interviews. The contingent valuation survey was conducted with scenarios involving 4 EuroQol-5 dimensions (EQ-5D) with different health statuses. We assumed a treatment that moved the health status of each scenario to perfect health. WTP for 1 year of treatment was derived using a double-bounded format followed by open-ended answers. In the cure scenario, the post-treatment effect continued for a lifetime; in the non-cure scenario, the effect instantly stopped when treatment was terminated. Additionally, prolonged treatment effects lasting 5 and 10 years were added. To identify the factors influencing WTP, a multi-level analysis was performed.
WTP per QALY for the non-cure scenario was KRW 15 million/QALY. For the cure scenario, WTP was 2.3 times higher (KRW 35 million/QALY) than in the non-cure scenario. The results for the prolonged treatment effect scenarios were KRW 22 million/QALY and KRW 27 million/QALY, which are 1.4 and 1.8 times higher than the non-cure scenario, respectively. In all scenarios, the statistically significant factors affecting WTP per QALY were higher education, higher household income, and healthcare provider.
This study revealed that WTP for a cure treatment was higher than that for non-cure; this higher WTP should be considered in future decision-making regarding curative treatments.
1. Introduction
Recently, the concept of curative treatments caused by regenerative medicines has been introduced. These treatments include stem cell therapy, cellular therapy, tissue engineering, and gene therapy.[1] In a 2014 European International Society for Pharmacoeconomics and Outcomes Research (ISPOR) presentation, Faulkner mentioned that 250 companies had developed more than 300 cell therapy drugs in 2008, and more than 700 drugs were predicted to undergo preclinical and clinical development through 2014.[2] With the increasing development of cell therapy drugs, more curative treatments will be possible in the near future.
A cure is different from traditional treatment, which includes concurrent cessation of clinical signs and symptoms as well as the risk of relapse, in that it is the end of a disease. Beyond the clinical importance of curative treatment, it also has broader economic and social benefits within the short-term treatment period.[2,3] In general, it is known that the manufacturing cost for regenerative drugs is high. However, when short-term treatments reach a cure, long-term costs related to the disease can be lowered, resulting in healthcare financial savings. Therefore, the value of curative treatment should include these unique characteristics.
To obtain better access to patients, it is important for a new drug to receive reimbursement from health insurance providers. In many countries, such as the UK, Australia, and Korea, the role of economic evaluation has been emphasized as a method for decision-making in the healthcare sector. In particular, cost-effectiveness is an important factor in medicine reimbursement, and social willingness to pay (WTP) can provide evidence for the threshold of cost-effectiveness analysis.
In previous studies of social WTP, WTP was elicited as the level of 1 per capita gross domestic product (GDP) to 3 per capita GDP.[4–9] In South Korea, the threshold is known to be approximately KRW 20 million/quality-adjusted life year (QALY);[4] it was higher for an anti-cancer drug in severe patients. In the UK, the threshold of £20,000 to 30,000/QALY for all evaluations was applied.[10] However, a question has arisen regarding the limitation of the single threshold. Thus, in the 2009 National Institute for Health and Care Excellence (NICE) guideline revision, it was agreed to give a weighted value for achieving QALY at the end of life, considering equity.[11] In the 2014 NICE committee, the lower limit of the threshold (£20,000) was given the weighted value of 2.5; thus, the threshold was increased to £50,000/QALY.[12]
If we have substantial evidence for the incremental cost-effectiveness ratio (ICER) threshold, comprehensive studies on WTP will be needed, as this topic for curative treatments has rarely been addressed in the extant literature. Briefly, a survey on WTP for regenerative medicine was conducted in the US;[2] this study showed that, the longer the duration of treatment effects, the higher the rate of payment intention. However, the survey included only 20 respondents, and the question was composed of the degree of increase in payment stratified by 0% to 25%, 26% to 50%, and 51% to 100%. Thus, WTP for a QALY could not be calculated, and the increased payment intention, according to the prolonged duration of the treatment effect, was identified. In South Korea, 2 studies on WTP were performed; Ahn et al (2010) studied the single threshold of the Korean general population, irrespective of cure, while Ahn et al (2012) estimated WTP by severity, although the latter did not address cures specifically.[4,13]
Therefore, this study aimed to evaluate WTP for 1 QALY for a cure using the Korean general population, compare WTP according to disease severity and duration of treatment in a cure scenario, and confirm the critical factors affecting WTP.
2. Methods
2.1. Study design and sample
We conducted a survey of 507 people in the Korean general population, which was randomly classified by age (19–35, 36–50, and 51–65 years), sex, and representative city (Seoul, Pusan, Gwangju, and Daejeon). The proportion of each sex was identical, and the age group and region were chosen to reflect the population distribution in South Korea. The general public is preferred in surveys when measuring the utility weights used in QALY calculations in economic evaluation studies.[14,15] This is because health insurance uses the general public's finances and economic evaluation is carried out with the aim of allocating scarce resources, reflecting the preferences of the general public. Thus, we surveyed the Korean general population. Actually, the percentages of age and sex in the survey population were similar to those for the overall Korean population. We used a contingent valuation method (CVM), which provides the maximum WTP for a health-related scenario. Furthermore, while the choice experiments method is an alternative, it is difficult to multiply and compare the various attributes when not experiencing the situation.[16]
The interviewers, who were well informed of the study's purpose, survey methods, and type of answers, conducted a paper-based, self-reported survey using a survey guideline. Methodological and clinical experts constructed the questionnaire during several meetings using a draft developed based on a literature review. After the pilot test to check the general population's understanding, a pre-test was conducted on 30 respondents to extract the first bid for the double-bound dichotomous choice (DBDC) WTP answer. In the pre-test, the same questionnaire was used as in the survey for WTP except for the method of indicating WTP; open-ended answers were collected in the pre-test. The survey started on September 17, 2015, and ended on October 16 of the same year. The Institutional Review Board of Sungkyunkwan University (no. 2015-08-004) approved this study. We obtained written informed consent from respondents.
2.2. Scenarios
Four scenarios with different health statuses by disease severity were selected and designed using the Korean version of the EuroQol-5 dimensions (EQ-5D) 3 level, which is an indirect method of measuring utility weights developed by the EuroQol group that evaluates the 5 dimensions of “mobility,” “self-care,” “usual activities,” “pain/discomfort,” and “anxiety/depression” in the following 3 states: “no problem,” “some problem,” “severe problem.” The results are inputted into the scoring function (i.e., tariff) to derive the utility weights.
There were no exact criteria for mild, moderate, and severe disease in the EQ-5D, so we included 4 scenarios by utility level to consider various levels of disease severity. The health statuses of the 4 scenarios were organized as follows (Fig. 1a). 1) The level of all 5 dimensions is “some problem” (Scenario 1: some problem). 2) There is a “severe problem” in 1 dimension and “some problem” in 4 dimensions (Scenario 2: 1 severe problem). 3) There is a “severe problem” in 2 dimensions and “some problem” in 3 dimensions (Scenario 3: 2 severe problems). 4) There is a “severe problem” in 3 dimensions and “some problem” in 2 dimensions (Scenario 4: 3 severe problems).
Figure 1.
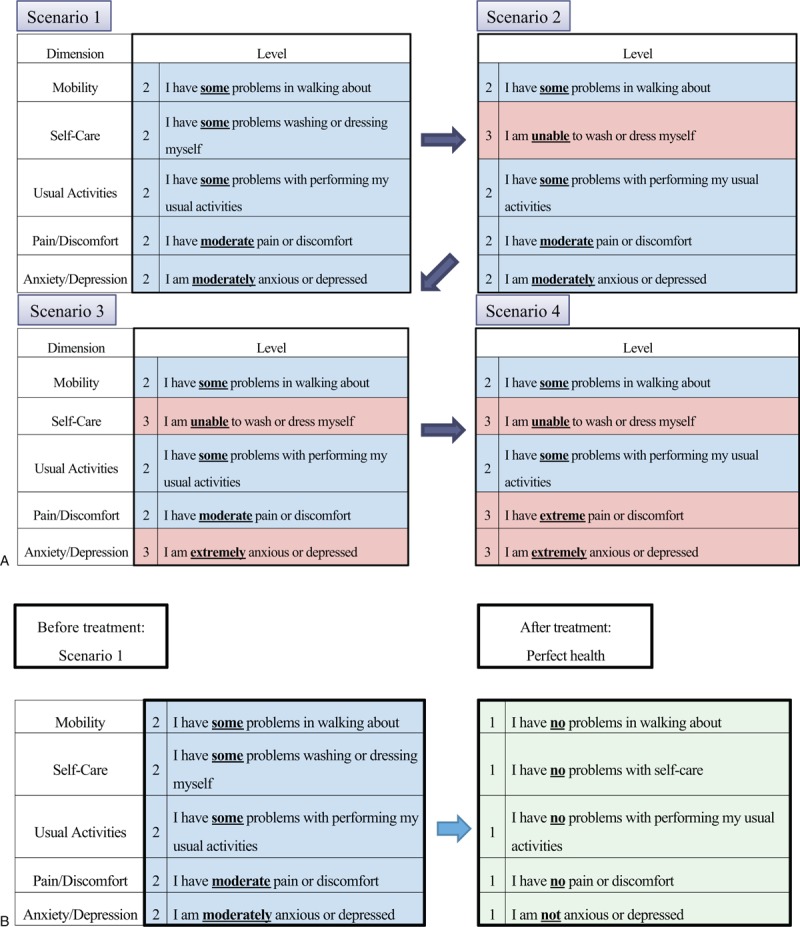
Description of scenarios A. each scenario from 1 to 4 B. moving health status by treatment.
For the understanding of respondents, the level of the 5 dimensions of Scenario 1 was set to “some problem” (22222 in each dimension of the EQ-5D). Scenarios 2, 3, and 4 sequentially added 1 to 3 “severe problems” (23222, 23223, and 23233, respectively, in each dimension of the EQ-5D). In addition, we displayed the important text in the scenarios in underlined, bold-type lettering and a different color. We selected the dimension of “severe problem” based on a difference of more than 0.1 incremental utilities in each scenario. Finally, the utility weights of Scenarios 1, 2, 3, and 4 were 0.677, 0.537, 0.422, and 0.308, respectively, using the Korean EQ-5D tariff.[17] We assumed a treatment that moved from the health status of each scenario to perfect health, which means that the health status is “no problem” for all 5 dimensions (11111 in each dimension of the EQ-5D; utility weights = 1). Thus, the incremental QALY (ΔQALY) of Scenarios 1, 2, 3, and 4 were 0.323, 0.463, 0.578, and 0.692, respectively.
2.3. Questionnaires
The questionnaires were organized into 3 parts: respondents’ current health status, WTP for each scenario, and general information about respondents. The survey started by asking respondents to indicate their health status using the EQ-5D as a warm-up.
They then imagined that their own health status was that indicated in each scenario (from Scenario 1 to Scenario 4), and thus, responded with their maximum WTP for moving the scenario's health status into perfect health (Fig. 1b). WTP answers were repeated for each case of cure, prolonged treatment effect, and non-cure scenarios. In other words, responders to Scenario 1 answered 4 times: once for cure, once for a prolonged treatment effect lasting 5 years, once for a prolonged treatment effect lasting 10 years, and once for non-cure. Then, 4 answers were repeated for each scenario: Scenarios 2 (1 severe problem), 3 (2 severe problems), and 4 (3 severe problems). In the cure scenario, the post-treatment effect continued for a lifetime, and, in the non-cure scenario, the effect stopped instantly when treatment was terminated. The concept of a cure was based on complete absence of disease for the rest of one's life; non-cure was defined as having the effect of the disease limited to the treatment duration. In addition, we added the prolonged treatment effects of 5 and 10 years, which represent complete and durable remission lasting 5 and 10 years, respectively.
WTP out of pocket for 1 year of treatment for each scenario was first answered using a DBDC followed by an open-ended answer. The DBDC, developed by Bishop and Heberlin,[18] is widely known as 1 of the best methods in CVM since it has overcome biases involved in using other methods, such as open-ended answers, iterative bidding, and payment cards. In addition, only the open-ended question was limited by many missing values for reporting difficulties and outliers. Thus, the combined methods were used to overcome the bias caused by using only a single method.
Three bid values from the pre-test were randomly shown to the respondents: KRW 150,000/month (KRW 1,800,000/year), KRW 700,000/month (KRW 8,400,000/year), and KRW 2,000,000/month (KRW 24,000,000/year) for non-cure, and KRW 250,000/month (KRW 3,000,000/year), KRW 1,200,000/month (KRW 14,400,000/year), and KRW 3,000,000/month (KRW 36,000,000/year) for cure and prolonged treatment effect scenarios. The bids were the values of the mean, 10%, and 90% from the pre-test survey. The bids were additionally selected from the 10% and 90% values including the mean value reflecting most respondents’ answers. The demographic characteristics of responders in the pre-test were similar to those of the survey population (Supplement Table 1). The characteristics of economic status, such as monthly house income, number of household members, private insurance, and employed status were also similar. Thus, the bids from the pre-test could represent the overall bid price to assess WTP. If the respondents accepted the first value, the second value became twice that of the first; otherwise, the acceptance of half of the value was or was not confirmed. Then, the open-ended question was finally answered to measure the exact maximum WTP.
Finally, general information was collected on sociodemographic characteristics, and a question about physician diagnoses of diseases including cancer, cardiovascular, musculoskeletal, respiratory, endocrine-metabolic, eye, ear, digestive system, and mental diseases was asked.
2.4. Statistical analysis
The descriptive analysis of general characteristics was performed and we separately calculated both WTP and WTP/QALY. WTP was the total amount of payment of the responder and WTP/QALY was the value of the total amount divided by QALY. Therefore, WTP/QALY was WTP per QALY.
For the open-ended answer, there were 2 methods of calculating WTP for a QALY: the individual amount of money divided by individual QALY and the mean amount of money for all respondents divided by the mean QALY. From a conservative perspective on welfare economics, the former method is appropriate under the condition that individual health improvement is equal and individual respondents can present their own value and preference exactly. However, respondents’ answers are not always correct because of error and/or bias, which may lead to inaccurate results. In addition, the former method has a weakness in that it is influenced by outliers more than is the latter method.[19] Thus, we chose the latter method. The mean WTP/QALY according to the cure, prolonged treatment effect, or non-cure scenario; severity of scenario; and bidding value were calculated, and that according to the characteristics of respondents was estimated. The differences in WTP between subgroups were assessed using a t-test or ANOVA. The responder could answer with zero WTP for the scenarios, so we identified the no-payment frequency and analyzed results including this value.
Moreover, multilevel regressions were carried out to confirm the critical factors affecting WTP/QALY, controlling for other factors. As previously mentioned, this study was composed of 4 health scenarios, and respondents answered several times for non-cure, prolonged treatment effect lasting 5 years, prolonged treatment effect lasting 10 years, and cure for each scenario. The observations were related to each other within respondents and measured repeatedly. If not considered, statistical significance can be overestimated.[20,21] Thus, we performed a multilevel analysis considering the association of repeated measures.
In the dichotomous choice method, the respondents intended to pay for treatment only if the amount was higher than the bidding value. As such, the function between bidding value and respondents’ acceptance was established.[22] The decision-making process for the DBDC model is a 2-part process, where the first decision influences the second decision, so we used the bivariate probit model.[23] Moreover, to analyze the factors affecting WTP, the marginal effect of the independent variable was estimated. Covariates were included, such as sociodemographic information, whether someone has a disease and the first and second bidding values. In the DBDC model, the expected WTP was analyzed using Krinsky and Robb's simulation.[24–26] The expected WTP from the bivariate probit model was estimated, including the first and second payment intentions and covariates, through 20,000 simulations. Furthermore, the mean was calculated and the null hypothesis of WTP ≤ 0 was tested based on the 0.05 significance level. This statistical analysis used STATA 12.0.
3. Results
3.1. Population characteristics
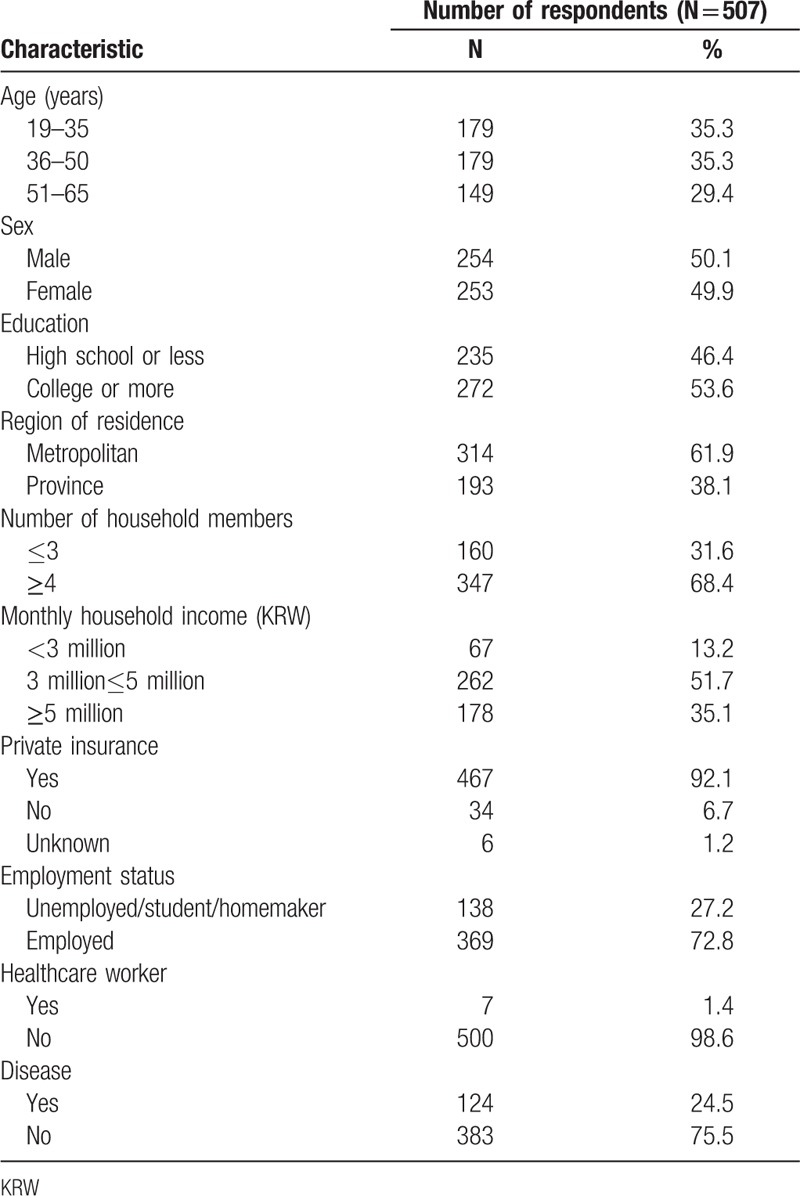
There were 254 men among 507 respondents, which was just over half of the total respondents (Table 1). The average age was 42 years, and respondents aged 51 to 65 years accounted for slightly less than did other age groups. The monthly household income of KRW 3 to 5 million accounted for 51.7%, and half of the respondents had at least a college education. In addition, 72.8% of respondents were employed, and 61.9% lived in a metropolitan area. Most of them had private insurance, and a quarter of them had a disease.
Table 1.
Demographics of general population.
3.2. WTP
3.2.1. Open-ended WTP
The proportion of respondents that answered, “no payment” for all scenarios ranged from 0.4 to 17.8%, and the proportion of no WTP was higher with low scenario severity and short duration of treatment effect. Additionally, respondents were asked the main reason for no WTP. In the case of lower severity and shorter duration of treatment effect, the major reason for no WTP was being satisfied with maintaining the scenario's health status while the leading cause in the scenario of higher severity and longer treatment effect was financial burden.
In the 2088 open-ended answers of the 507 respondents, mean WTP was slightly higher than median WTP in all scenarios. WTP for the non-cure scenario was KRW 15 million/QALY, while that for the scenarios of prolonged treatment effects lasting 5 and 10 years and for cure were KRW 22 million/QALY, KRW 27 million/QALY, and KRW 35 million/QALY, respectively (Table 2). Thus, the rates of the prolonged treatment effects lasting 5 and 10 years and cure scenarios were 1.4, 1.8, and 2.3 times higher than in the non-cure scenario, respectively. Moreover, the increased rate of each scenario by severity (Scenarios 1, 2, 3, and 4) was similar. WTP (amount of response) in the severe scenario was higher than in the mild scenario; however, a pronounced tendency in WTP per QALY was not shown with a long duration of treatment effect (Fig. 2).
Table 2.
Willingness to pay for a quality-adjusted life year in cure and non-cure scenarios.
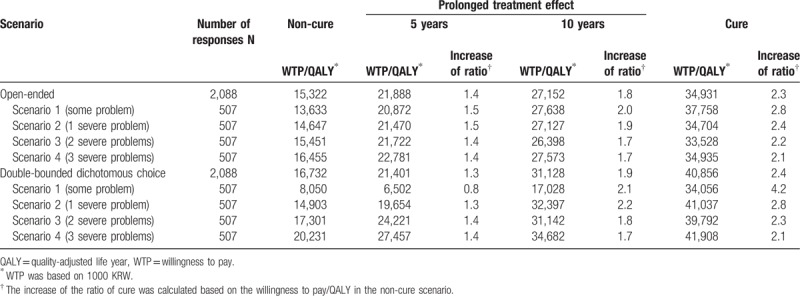
Figure 2.
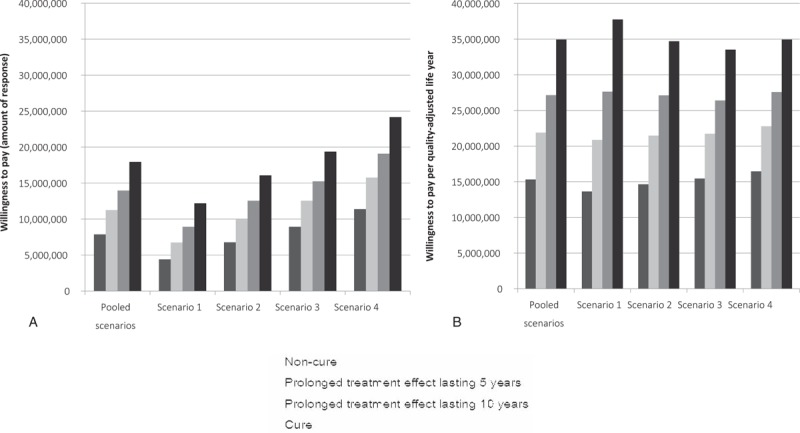
Open-ended answers for each scenario A. Willingness to pay (amount of response) B. Willingness to pay per quality-adjusted life year.
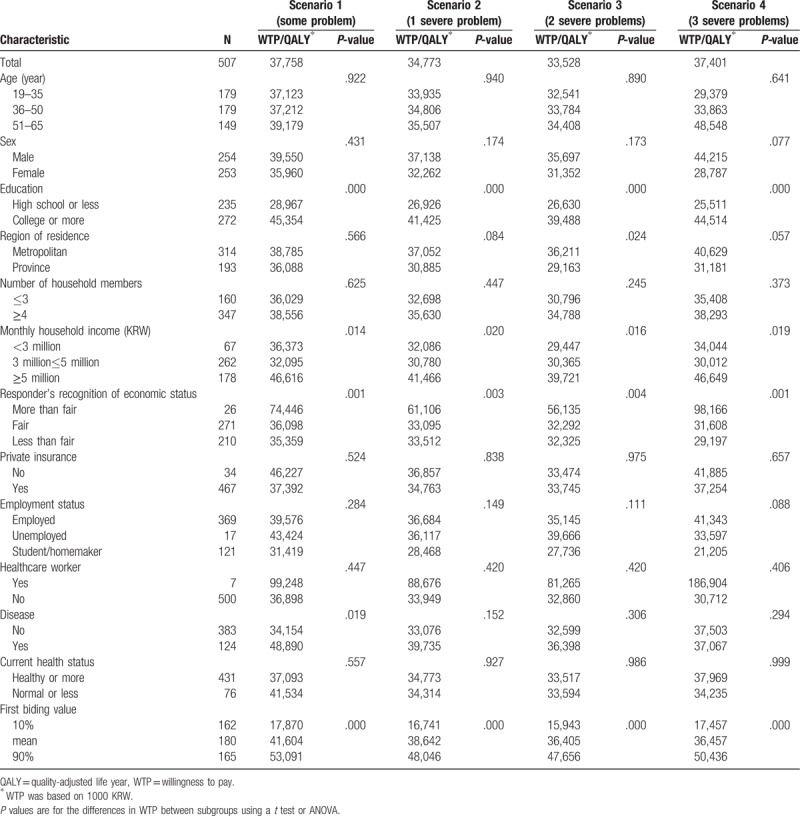
Through the subgroup analysis, various factors that affect WTP values were detected, including education level, household income, and subjective recognition of economic status in all scenarios and residential areas, and whether they had a disease in some scenarios (Table 3). If the severity of the scenario was higher, the difference in WTP was higher in residential areas and those having a disease. Moreover, the high first bid was significantly associated with a high open-ended WTP.
Table 3.
Subgroup analysis of open-ended willingness to pay for a quality-adjusted life year on a cure.
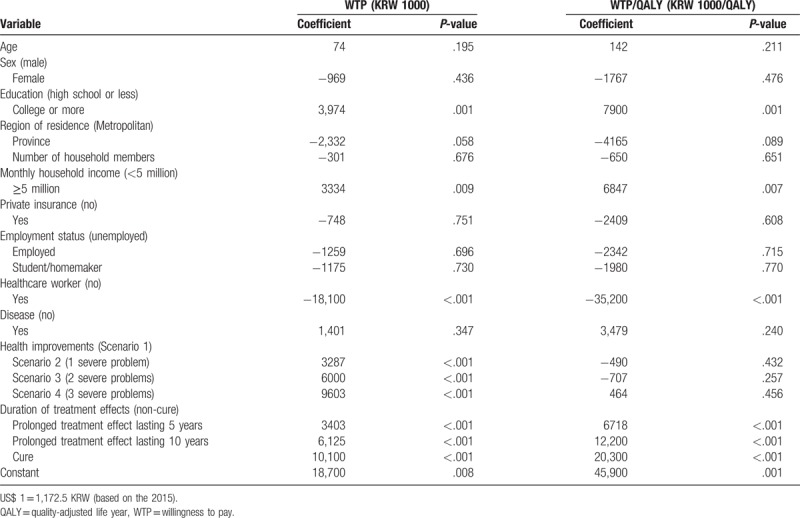
In all scenarios, the statistically significant factors affecting WTP per QALY were higher education, higher household income, and higher duration of treatment effect (Table 4). WTP significantly increased with higher severity in the scenario; however, there was no significant difference in WTP/QALY for the health improvements. The duration of treatment effects, from KRW 6 million/QALY for prolonged treatment effects lasing 5 years to KRW 20 million/QALY for a lifetime cure, significantly increased compared to the non-cure scenario.
Table 4.
Multi-level analysis of open-ended willingness to pay and willingness to pay for quality-adjusted life year on cure.
3.2.2. Double-bounded dichotomous choice WTP
In the DBDC model, the duration of the treatment effect was longer, and the proportion of “Yes” answers for the first and second questions was higher. We identified payment intention through the null hypothesis that the value for the response for each scenario was zero or less, and it was rejected for all scenarios except in Scenario 1 with prolonged treatment effects lasting 5 years. Therefore, we could not confirm the payment intention in that case only.
In the DBDC model for the 2,088 responses using Krinsky and Robb simulation-adjusted sociodemographic variables, whether they had a disease, and first bid, WTP values for a QALY were higher than for an open-ended WTP/QALY except in the scenario of prolonged treatment effects lasting 5 years (Table 2). The open-ended WTP/QALY was higher than the DBDC WTP/QALY in the scenario with moderate severity while the open-ended WTP/QALY was lower than the DBDC WTP/QALY in the severe scenario.
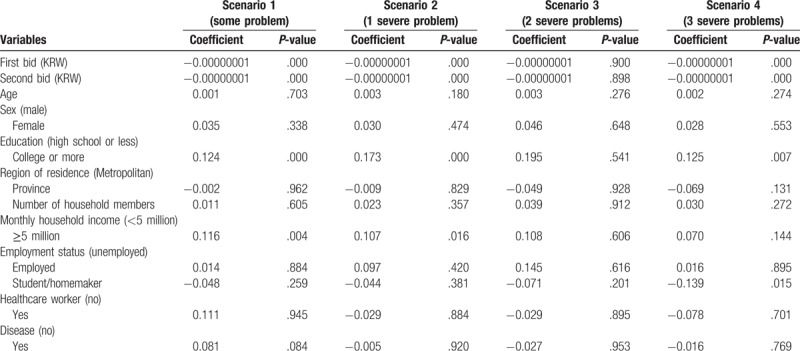
In particular, we estimated the marginal effect using a bivariate probit model; Table 5 shows the results for the cure. When the first bid value was increased by KRW 1 million, the marginal effect of the probability of answering the payment intention for both the first and second questions decreased significantly to 0.01% (P < .001), generally. Moreover, when the second bid value increased overall by KRW 1 million, the payment intention, throughout all the scenario severity and durations of treatment effect, ranged from 0.01 to 0.05% (P < .001). Further, the payment intention of the group with an education level of college or more increased from 5.4% to 19.5%, and that of the people with household income of KRW 5 million or more increased from 3.6% to 11.6% in all scenarios.
Table 5.
Bivariate probit regression of double-bounded dichotomous choice willingness to pay for quality-adjusted life year on cure.
4. Discussion
The present study confirmed that WTP was higher in a cure scenario than in a non-cure scenario. In the former, WTP was higher with the longer duration of treatment effect. Moreover, WTP was higher in the severe scenario than in the mild scenario; however, a pronounced tendency in WTP per QALY was not shown with a long duration of treatment effect. The factors that affected WTP in both the cure and non-cure scenarios were similar, including higher education level and household income.
Two studies reporting open-ended WTP have been performed in Korea. First, Ahn et al. (2010) surveyed 933 people in the general population for WTP per QALY, and the threshold was estimated at about KRW 19 million/QALY.[4] However, Ahn et al. (2010) extracted the threshold (WTP for QALY) regardless of whether a cure or non-cure scenario was considered.[4] That study was similar to ours in terms of using the general population and EQ-5D scenarios. In addition, 5 scenarios were composed; the effects after treatment stopped instantly in 4 scenarios (i.e., less than 0.8 of improvement in QALY), and patients that stopped treatment died instantly in 1 scenario (i.e., death). Thus, the description of the 4 scenarios was similar to those of our study. The threshold of the non-cure scenario of our study (KRW 15 million/QALY) was lower than in Ahn et al (2010) because the death scenario was not included in the present study.[4] In addition, the threshold in the cure scenario of our study was higher than in Ahn et al (2010);[4] thus, the results were reasonable considering the description of the cure scenario.
Second, Ahn et al (2012) targeted 1932 people in the general population in Korea and estimated WTP for QALY by scenario severity including mild, moderate, severe, end-of-life, and death.[13] In the descriptions of the mild, moderate, and severe scenarios, the effects after treatment were maintained for a lifetime, while the end-of-life and death scenarios were described as stopping treatment, leading to death. Thus, Ahn et al.'s (2012) study scenario was similar to our cure scenario with regard to the maintained effect after treatment.[13] In the present study, the thresholds of the cure from Scenarios 1 to 4 ranged from KRW 34 to 38 million/QALY; as such, the pooled threshold of the cure (from Scenarios 1 to 4) was KRW 35 million/QALY. This result was comparable to the combined threshold (KRW 30 million/QALY) of the mild, moderate, and severe scenarios of Ahn et al's (2012) study.[13]
Shiroiwa et al's study design was similar to that of Ahn et al (2012)[13,27] WTP per QALY was extracted from 2400 people in the general population in Japan. The threshold ranged from JPY 2 to 8 million/QALY (USD 20,000–80,000, respectively) according to the severity of health states. Moreover, Robinson et al surveyed the thresholds in 22,000 people in the general populations of 9 European countries (the Netherlands, the UK, France, Spain, Sweden, Norway, Denmark, Poland, and Hungary).[28] Two EQ-5D scenarios were used, the health status after treatment was kept as perfect health for a lifetime, and WTP per QALY was shown to range from USD 18,247 to 34,097. The scenarios and results of Robinson et al were similar to those of our study.[28]
In addition, the present study showed that WTP was higher in the severe scenario than in the mild scenario, while no pronounced tendency in WTP per QALY was shown with a long duration of the treatment effect. The reason for this is considered to be that, if the duration of the treatment effect was maintained for a lifetime, WTP might not be influenced by the severity of the current disease. Moreover, the response costs for each scenario increased according to its severity; however, the incremental WTP was not directly proportional to the incremental QALY. Further, Ahn et al's (2010) study showed this trend by the severity of scenarios;[13] the threshold increased from the mild to severe scenario but decreased from severe to death. This trend also manifested in Shiroiwa et al's study.[27]
Comparisons to previous studies reveal that, although the survey population and methods were identical, WTP could differ depending on the descriptions of the scenario. Conversely, when the descriptions of the scenarios were similar, WTP could be compared.
Ahn et al (2012) also estimated WTP using the DBDC method.[13] In their study, the pooled threshold of the mild, moderate, and severe scenarios, similar to the cure scenario of our study, was KRW 40 million/QALY, which is similar to the threshold of the cure scenario in our study (KRW 41 million/QALY). In the present study, the expected value of WTP for QALY was analyzed considering age, sex, education level, living area, number of household members, household income, employment, healthcare worker status, whether they have a disease, and first bid, as covariates. Although Ahn et al (2010) did not mention the independent variables, we assumed that they considered similar variables; in their study, the threshold was derived as KRW 53 million/QALY considering only age as the independent variable.[4]
The expected value of the DBDC WTP was lower than the open-ended WTP in the mild scenario (utility weight = 0.677 in Scenario 1). However, the DBDC WTP was higher compared to open-ended WTP in the more severe scenario (utility weight = 0.537 in Scenario 2, 0.422 in Scenario 3, and 0.308 in Scenario 4). These results were similar to those of Ahn et al (2012).[13] In addition, the open-ended WTP in the mild scenario (more than 0.7 incremental QALY), and DBDC WTP in the moderate (0.35–0.7 incremental QALY) and severe (less than 0.35 incremental QALY) scenarios were higher than in each counterpart. The open-ended WTP was simply the calculated mean from all respondents, so the sociodemographic characteristics of respondents for WTP answers might be more affected. Conversely, the DBDC WTP was estimated as the expected value, adjusting for the characteristics of respondents, such as age, sex, education level, living area, number of household members, household income, employment, healthcare worker status, whether they have a disease, and first bid, so the scenario severity was able to have more influence.
The factors that influenced WTP in all scenarios were similar. The household income and education level of respondents were associated with WTP per QALY. Moreover, we identified that higher WTP was associated with longer duration of treatment. Through the present study, we confirmed that higher income and education level lead to a higher WTP. These results were similar to those of previous studies, which showed that WTP of respondents with higher income was higher than for those with lower income,[8,27,29–32] that a higher education level was significantly associated with higher WTP,[29] and that greater health improvement had a positive association with high WTP.[19,27,29,31] Additionally, the high first bid was related to high WTP. When the value of the mean and 90% in the pre-test were used as the first bid, WTP for a cure was approximately 2 times and 3 times, respectively, compared to WTP when the value of 10% used as the first bid. Ratcliffe mentioned that an extremely high upper bid value might lead to underestimation of WTP.[33,34] On the other hand, if the upper value was not low enough; the lower end of the WTP could not be accurately estimated.[34] Thus, the authors insisted that the range of bid values were determined using the pre-test before the survey. For this reason, we used the first bid from the results of the pre-test.[34]
In addition, WTP showed positive skewness in our analysis. In the healthcare sector, cost data generally show a positively skewed distribution.[35] The reason is not only the presence of a relatively small number of individuals with high costs but also the absence of negative costs.[36] Typically, the median was presented with skewed data. However, the median cannot determine the total cost of treatment for a group in policy decision-making. The mean value is required to calculate the total cost for a group.[36] The other way is to transform the skewed data for normalization.[37] However, the data analysis should use a back-transformation, and the results of back-transformed data are difficult to interpret.[38] For this reason, transformation was partially avoided.[39] Thus, WTP was presented as a mean value in our study, although the data showed slightly positive skewness. Furthermore, we analyzed the DBDC data to complete this point.
The present study is meaningful in several respects. First, it estimated WTP per QALY for a cure. We identified that WTP for a cure was higher than that in the non-cure scenario, and the maximum increase was 2.3 times, according to the duration of the treatment effect and scenario severity. In addition, these results were comparable to those of studies with similar scenarios in the Korean population, so the results might be used as evidence for WTP/QALY for a cure. Second, we found that the scenario description was an important factor for estimating WTP. Through comparison with previous studies, we identified that WTP could change depending on the type of scenario, health status after treatment, and duration of treatment effects. Third, we confirmed the factors that affect WTP through open-ended and DBDC answers. The answers for WTP were influenced by respondents’ characteristics, such as household income and education level, and these results were similar in both cure and non-cure scenarios.
Some limitations should be considered when interpreting our study. First, we estimated WTP using the CVM, which is a method to extract an individual value by answering a hypothetical question. However, there might be gaps between actual benefits and an individual's recognition of the benefits of the scenarios. We compensated for this defect by sufficiently explaining the scenario and suggesting the process of extracting value in detail. Second, there were issues concerning QALY because the present study used WTP per QALY as the threshold. A QALY should satisfy the following assumption: can trade-off quality of life and quantity of life, and both mild and severe health status have equal weight. However, there really is no substitute for a QALY, and it has international comparability because of its widespread use. Thus, the present study also used WTP per QALY as the threshold.
5. Conclusion
Through this study, we identified that WTP per QALY for cure treatment was more than 2 times higher than that for non-cure treatment. For the cure scenario, when the duration of the treatment effect was longer, WTP per QALY was higher. Moreover, the factors influencing WTP responses in both cure and non-cure scenarios were household income and education level. In addition, we newly found that the scenario description of health status after treatment was an important factor that affected the WTP. Furthermore, these results might be considered in the decision-making process of healthcare policy for curative treatments in South Korea, in situations where the limitation of a single threshold has been raised. Although more studies should be performed, the present study could be used as evidence regarding cure treatments.
Author contributions
Conceptualization: Eui-Kyung Lee, Hyun Jin Song.
Data curation: Hyun Jin Song.
Formal analysis: Hyun Jin Song.
Funding acquisition: Eui-Kyung Lee.
Investigation: Hyun Jin Song.
Methodology: Eui-Kyung Lee, Hyun Jin Song.
Project administration: Eui-Kyung Lee.
Supervision: Eui-Kyung Lee.
Validation: Eui-Kyung Lee, Hyun Jin Song.
Writing – original draft: Hyun Jin Song.
Writing – review & editing: Eui-Kyung Lee, Hyun Jin Song.
Eui-Kyung Lee orcid: 0000-0003-0601-7754
Supplementary Material
Footnotes
Abbreviations: CVM = contingent valuation method, DBDC = double-bound dichotomous choice, EQ-5D = EuroQol-5 dimensions, GDP = gross domestic product, ICER = incremental cost-effective ratio, NICE = National Institute for Health and Care Excellence, QALY = quality-adjusted life year, WTP = willingness to pay.
This study was supported by a grant awarded by Gilead Sciences Korea Ltd., Seoul, South Korea. The authors have no conflicts of interest that are directly relevant to the content of this article.
The authors have no conflicts of interest to disclose.
Supplemental Digital Content is available for this article.
References
- [1].Mason C, Dunnill P. A brief definition of regenerative medicine. Regen Med 2008;3:1–5. [DOI] [PubMed] [Google Scholar]
- [2].Faulkner E. What value do we place on a cure? Value demonstration challenges associated with innovator and regenerative therapies in the EU, North America and Asia. Presented at: ISPOR European Congress; Amsterdam, Netherlands; 2014. Available at: https://www.ohe.org/news/ohe-ispor-europe-presentations. Accessed November 21, 2017. [Google Scholar]
- [3].Brennan T, Wilson JM. The special case of gene therapy pricing. Nat Biotechnol 2014;32:874–6. [DOI] [PubMed] [Google Scholar]
- [4].Ahn JH, Kim YH, Shin SJ, et al. Research on methodologies for evidence-based healthcare decision-making process in Korea. 2010; National Evidence-Based Collaborating Agency. Available at: https://www.neca.re.kr/lay1/program/S1T11C145/report/view.do?seq=54. Accessed November 21, 2017. [Google Scholar]
- [5].George B, Harris A, Mitchell A. Cost-effectiveness analysis and the consistency of decision making: evidence from pharmaceutical reimbursement in Australia (1991 to 1996). Pharmacoeconomics 2001;19:1103–9. [DOI] [PubMed] [Google Scholar]
- [6].Goldman L, Garber AM, Grover SA, et al. 27th Bethesda Conference: matching the intensity of risk factor management with the hazard for coronary disease events. Task Force 6. Cost effectiveness of assessment and management of risk factors. J Am Coll Cardiol 1996;27:1020–30. [DOI] [PubMed] [Google Scholar]
- [7].Laupacis A, Feeny D, Detsky AS, et al. How attractive does a new technology have to be to warrant adoption and utilization? Tentative guidelines for using clinical and economic evaluations. Can Med Assoc J 1992;146:473–81. [PMC free article] [PubMed] [Google Scholar]
- [8].Shiroiwa T, Sung Y, Fukuda T, et al. International survey on WTP for one additional QALY gained: what is the threshold of cost-effectiveness? Health Econ 2010;19:422–37. [DOI] [PubMed] [Google Scholar]
- [9].Towse A, Pritchard C. Towse A, Pritchard C, Devlin N. Does NICE have a threshold? An external view. King's Fund and Office of Health Economics, Cost-Effectiveness Thresholds. Economic and Ethical Issues. London, UK:2002. [Google Scholar]
- [10].McCabe C, Claxton K, Culyer AJ. The NICE cost-effectiveness threshold: what it is and what that means. Pharmacoeconomics 2008;26:733–44. [DOI] [PubMed] [Google Scholar]
- [11].National Institute for Health and Care Excellence (NICE). Appraising Life-Extending, End-of-Life Treatments; 2009. Available at: http://www.nice.org.uk/guidance/gid-tag387/resources/appraising-life-extending-end-of-lifetreatments-paper2. Accessed November 21, 2017. [Google Scholar]
- [12].National Institute for Health and Care Excellence (NICE) Centre for Health Technology Evaluation: Consultation paper-value-based assessment of health technologies. NICE, London, UK; 2014. Available at: https://www.nice.org.uk/Media/Default/About/what-we-do/NICE-guidance/NICE-technology-appraisals/VBA-TA-Methods-Guide-for-Consultation.pdf. Accessed November 21, 2017q. [Google Scholar]
- [13].National Evidence-Based Collaborating Agency, Ahn JH, Kim YH, Shin SJ, et al. Research on methodologies for evidence-based healthcare decision-making process in Asia. 2012;Available at: https://www.neca.re.kr/lay1/program/S1T11C145/report/view.do?seq=68. Accessed November 21, 2017. [Google Scholar]
- [14].Oxford University Press, Drummond MF, Sculpher MJ, Claxton K, et al. Methods for the Economic Evaluation of Health Care Programmes. 4th ed. 2015. [Google Scholar]
- [15].Oxford University Press, Gray AM, Clarke P M, Wolstenholme J, et al. Applied Methods of Cost-Effectiveness Analysis in Healthcare. 1st ed. 2011. [Google Scholar]
- [16].Reed Johnson F, Lancsar E, Marshall D, et al. Constructing experimental designs for discrete-choice experiments: reports of the ISPOR Conjoint Analysis Experimental Design Good Research Practices Task Force. Value Health 2013;16:3–13. [DOI] [PubMed] [Google Scholar]
- [17].Lee YK, Nam HS, Chuang LH, et al. South Korean time trade-off values for EQ-5D health states: modeling with observed values for 101 health states. Value Health 2009;12:1187–93. [DOI] [PubMed] [Google Scholar]
- [18].Bishop RC, Heberlin TA. Measuring values of extramarket goods: are indirect measures biased. Am J Agric Econ 1979;61:926–30. [Google Scholar]
- [19].Gyrd-Hansen D, Kjaer T. Disentangling WTP per QALY data: different analytical approaches, different answers. Health Econ 2012;21:222–37. [DOI] [PubMed] [Google Scholar]
- [20].Van der Leeden R. Multilevel analysis of repeated measures data. Qual Quant 1998;32:15–29. [Google Scholar]
- [21].Lopez R. Incoming inequality and self-rated health in US metropolitan areas: a multi-level analysis. Soc Sci Med 2004;59:2409–19. [DOI] [PubMed] [Google Scholar]
- [22].Prentice-Hall, Greene WH. Econometric Analysis. 5th ed. 2003;710-719. [Google Scholar]
- [23].Cameron T, Quiggin J. Estimation using contingent valuation data from dichotomous choice with follow-up questionnaire. J Environ Econ Manage 1994;27:218–34. [Google Scholar]
- [24].Creel MD, Loomis JB. Confidence intervals for welfare measures with an application to a problem of truncated counts. Rev Econ Stat 1991;73:370–3. [Google Scholar]
- [25].Habb TC, McConnell KE. Valuing Environmental Nature Resources: The Economics of Non-market Valuation. Northampton, MA: Edward Elgar Publishing; 2002. [Google Scholar]
- [26].Park T, Loomis JB, Creel M. Confidence interval for estimating benefit estimates from dichotomous choice contingent valuation studies. Land Econ 1991;67:64–73. [Google Scholar]
- [27].Shiroiwa T, Igarashi A, Fukuda T, et al. WTP for a QALY and health states: more money for severer health states? Cost Eff Resour Alloc 2013;11:22doi:10.1186/1478-7547-11-22. [DOI] [PMC free article] [PubMed] [Google Scholar]
- [28].Robinson A, Gyrd-Hansen D, Bacon P, et al. Estimating a WTP-based value of a QALY: the “chained” approach. Soc Sci Med 2013;92:92–104. [DOI] [PubMed] [Google Scholar]
- [29].Bobinac A, van Exel NJ, Rutten FF, et al. Get more, pay more? An elaborate test of construct validity of willingness to pay per QALY estimates obtained through contingent valuation. J Health Econ 2012;31:158–68. [DOI] [PubMed] [Google Scholar]
- [30].Bobinac A, van Exel NJ, Rutten FF, et al. Valuing QALY gains by applying a societal perspective. Health Econ 2013;22:1272–81. [DOI] [PubMed] [Google Scholar]
- [31].Bobinac A, van Exel J, Rutten FF, et al. The value of a QALY: individual willingness to pay for health gains under risk. Pharmacoeconomics 2014;32:75–86. [DOI] [PubMed] [Google Scholar]
- [32].King JT, Jr, Tsevat J, Lave JR, et al. Willingness to pay for a quality-adjusted life year: implications for societal health care resource allocation. Med Decis Making 2005;25:667–77. [DOI] [PubMed] [Google Scholar]
- [33].Ratcliffe J. The use of conjoint analysis to elicit willingness-to-pay values. Proceed with caution? Int J Technol Assess Health Care 2000;16:270–5. [DOI] [PubMed] [Google Scholar]
- [34].Gyrd-Hansen D. Willingness to pay for a QALY. Health Econ 2003;12:1049–60. [DOI] [PubMed] [Google Scholar]
- [35].Pharmaceutical Press, Elliott R, Payne K. Essentials of economic evaluation in healthcare. 2005. [Google Scholar]
- [36].Barber JA, Thompson SG. Analysis and interpretation of cost data in randomized controlled trials: a review of published studies. BMJ 1998;317:1195–200. [DOI] [PMC free article] [PubMed] [Google Scholar]
- [37].Gregori D, Petrinco M, Bo S, et al. Regression models for analyzing costs and their determinants in health care: an introductory review. Int J Qual Health Care 2011;23:331–41. [DOI] [PubMed] [Google Scholar]
- [38].Manning WG, Mullahy J. Estimating log models: to transform or not to transform? J Health Econ 2001;20:461–94. [DOI] [PubMed] [Google Scholar]
- [39].Rutten-van Molken MP, van Doorslaer EK, van Vliet RC. Statistical analysis of cost outcomes in a randomized controlled clinical trial. Health Econ 1994;3:333–45. [DOI] [PubMed] [Google Scholar]
Associated Data
This section collects any data citations, data availability statements, or supplementary materials included in this article.


