Supplemental Digital Content is available in the text
Keywords: adverse event, effectiveness, incident, incident-reporting system, patient safety, patient safety incident
Abstract
The effectiveness of a hospital incident-reporting system (IRS) on improve patient safety is unclear. This study objective was to assess which implemented improvement actions after the analysis of the incidents reported were effective in reduce near-misses or adverse events.
Patient safety incidents (PSIs), near misses and adverse events, notified to the IRS were analyzed by local clinical safety leaders (CSLs) who propose and implement improvement actions. The local CSLs received training workshops in patient safety and analysis tools. Following the notification of a PSI in the IRS, prospective real-time observations with external staff were planned to record and rated the frequency of that PSI. This methodology was repeated after the implementation of the improvement actions.
Ultimately, 1983 PSIs were identified. Surgery theaters, emergency departments, intensive care units, and general adult care units comprised 82% of all PSIs. The PSI rate increased from 0.39 to 3.4 per 1000 stays in 42 months. A significant correlation was found between the reporting rate per month and the number of workshop-trained local CSLs (Spearman coefficient = 0.874; P = .003). A total of 24,836 real-time observations showed a statistically significant reduction in PSIs observed in 63.15% (categories: medication P = .044; communication P = .037; technology P = .009) of the implemented improvements actions, but not in the organization category (P = .094). In the multivariate analyses, the following factors were associated with the reduction in near misses or adverse events after the implementation of the improvement actions: “adverse event” type of PSI (odds ratio [OR], 3.67; 95% confidence interval [CI], 1.93–5.74), “disussion group” type of analysis (OR, 2.45; 95% CI, 1.52–3.76), and root cause type of analysis (OR, 2.32; 95% CI: 1.17–3.90).
The implementation of a hospital IRS, together with the systematization of the method and analysis of PSIs by workshop-trained local CSLs led to an important reduction in the frequency of PSIs.
1. Introduction
Incident-reporting systems (IRSs) are methods of reporting near misses or adverse events to enable organizational improvement.[1,2] Most developed countries have developed Clinical Safety Reporting Systems that are voluntary, anonymous, confidential electronic systems that allow the reporting of incidents and adverse events and analysis by a group of experts.[3–5] Whether these systems improve the safety of patients, however, is unclear. Shojania[6] spoke of the “frustrating case of incident reporting systems” and their many limitations: physician underreporting and bias; that IRSs cannot be used to measure safety or to compare organizations; the lack of a denominator in the metrics; that some reports provide little meaningful value about the usefulness of the safety system; and due to limited resources, error investigations and analysis in health care are often superficial. In addition, IRSs are associated with costs for training staff on their use, in addition to reporting, collecting, and analyzing data from these systems. On the contrary, IRSs could reduce patient injuries, which would lead to a subsequent reduction in costs. Some authors have tried to develop methods for assessing the impact of an improvement action to have a prompt and reproducible tool. Moccia et al[7] developed a methodology of risk management in surgery theaters based among others in the compliance to the single items of the surgical checklist used during real-time observations. Real-time observations had been used previously as the evaluation method of the impact of interventions to improve the hand hygiene.[8,9]
In this study, we analyzed the features of a hospital IRS analyzed by local clinical safety leaders (CSLs), its effectiveness and limitations. The endpoint was to assess which improvement actions were effective in reducing near-misses or adverse events. Following the notification of a patient safety incident (PSI) in the IRS, prospective real-time observations with external staff were planned to record and rated the frequency of that PSI. This methodology was repeated after the implementations of the improvement actions during the first42 months of use of the IRS. We also aimed to establish which factors were related to the improvement measures and the recommendations that significantly reduced near misses or adverse events.
2. Materials and methods
2.1. Setting
The study was conducted at University Hospital La Paz-Cantoblanco-Carlos III (1254 beds, 1153 functional beds, 2016), which offers services in all fields of specialized medical care.
2.2. Characteristics and conditions of hospital IRS
The hospital's IRS is voluntary, anonymous, nonpunitive, and confidential. The IRS aims to promote improvements within the organization, independent of an external authority, while analyzing the time to response and providing feedback to the reporting individual. A “patient safety incident” was defined as an event during an episode of patient care that had the potential to (near miss) or actually caused injury or harm (adverse events) to the patient. Only hospital staff (health care staffs, non-health care staffs) can report PSIs to the IRS. The patients cannot report PSIs, but the Patient Liaison Service and Social Work Unit is notified of the claim if it is related to patient safety. Research permission for the IRS was obtained from the hospital board as a database holder; according to organization policy, ethics committee approval was not needed. The IRS was conducted in accordance with the Spanish Personal Data Protection Law.[10]
2.3. Local clinical safety leaders
The Community of Madrid Heath Council (CMHC) in its Patient Safety Strategy, agrees with the hospitals so that each service or unit names a clinical safety leader. At our institution, 175 local CSLs are physicians and nurses designated by the medical and nursing chief officers. After the designation, the local CSL attended training workshops in patient safety and analysis tools taught by Functional Unit of Risk Management (FURM) members or by the CMHC.
2.4. Data collection
Each report requires the following: reporter status (physician, medical resident, nurse, nursing assistant, other professionals), age and sex of patient, date of incident, date of the report, phase, type, and evolution (degree of harm). Drop-down menus facilitate location of the PSI. These are categorical variables, mainly captured in drop-down menus. There is also a free text section in which the reporter is asked to describe in detail what occurred and what action was taken as a result. Another section asks who was informed of the PSI (multiresponse possible): patients, relatives, hospital staff, or unknown. The reporter is retrospectively asked whether the PSI could have been prevented (yes, no, or unknown) and prospectively, in a free text box, how it could have been prevented. The PSIs reported from Patient Liaison Service and Social Work Unit were loaded into the IRS. In addition, the PSIs of the primary care report system (CISEM-AP) or from the Emergency Medical Service of Madrid (SUMMA-112) associated with the hospital were introduced into the system and vice versa.
2.5. PSI analysis
When a report is entered into the system, a report manager reviews the incident report and assigns it a priority. The IRS uses the Australian classification system to assign a priority.[11] The report managers send the reports for analysis to the local CSLs of the nursing unit and the medical service involved in the report. If the report is a severe adverse event, it is also assigned a member of the FURM to offer assistance with the analysis. The reports were studied using the analytical tools. The analysis and the method were registered in the IRS. The report managers could change the phase of the PSI and determine the latent or contributing factors. The managers chose the improvement measures, and the local CSLs implemented the improvements. Corrective proposals are system oriented. The IRS provided feedback to the reporter on the improvement actions implemented. The improvement measures were divided into 4 categories: Communication, Medication, Organization, and Technology. The types of barriers to implementation, from more to less important, were as follows: physical natural, human action, and administrative. Three working groups within primary care analyzed and coordinated the improvement measures derived from these reports.
2.6. Software description
The SINOIRES (MC13080056; July 14, 2014) was developed as a project of JAVA, programming a Struts framework as a database using Microsoft SQL Server.
2.7. Effectiveness of improvement actions
Real-time observations were planned with external staff (n = 17) to record and rated the effectiveness of the improvement measures before each PSIs analysis and after the implementation of the improvement actions. Events observed in the location of each PSI were measured in 2 different times: the number of real-time observations per PSI planed was 8 to 10 in 2 consecutive months before PSI analysis; the real-time observations after the improvement implemented were carried out during the second half of 2017, 8 to 12 per each PSI in 2 consecutive months.
2.8. Data analysis
2.8.1. Sample size calculations
The required sample size for population proportion confidence interval (CI; margin of error ± 2.5%, 95% CI, assuming a variability of 50%, being the population the total patient stays during the period of the study) was 1400 PSIs. Accepting an alpha risk of 0.05 and a beta risk of 0.2 in a 2-sided test, 1344 real-observations was necessary to recognize as statistically significant an odds ratio (OR) ≥ 2. A proportion of exposed subjects in the control group (previous improvement actions) has been estimated to be 0.035.
2.8.2. Statistical analyses
The categorical variables were expressed in absolute terms and percentages. Age was categorized in groups of age ranges: 0 to 1 year, 2 to 5 years, 6 to 11 years, 12 to 17 years, young adults (ages 18–45 years), middle-aged adults (ages 46–64 years), older adults (aged >65 years). Uncertainty of estimation was assessed by a calculation of the 2-sided Wald 95% CI. To calculate the reporting rate for a 1000-day stay, the total of all the reports during the study period was used as the numerator, and the total patient stays in that period was the denominator. Pearson or Spearman correlation coefficient was used, when appropriate, to assess a possible link between the number of reports and the training workshops. To evaluate possible differences in the percentage of groups of age ranges with respect to the expected distribution and in the events real-time observations before and after the improvement measure, we used the Chi-squared test. Fisher exact test was used to assess the differences between types of PSI (near-miss or adverse event) notified by physicians versus nurses. OR and 95% CI values were obtained. The level of significance <.05 was considered statistically significant. Next, we developed logistic regression model to determine the factors associated with the improvement actions statistically significant in reducing the frequency of near-misses or adverse events, (dichotomous dependent variable), ORs and 95% CIs, based on univariate analysis. Single factors used were the characteristics of PSIs, the types of PSIs categorized to near-miss or adverse event, and the methods of analysis. In multivariate analysis, we introduced the factors considered significant in univariate analysis (P < .10). To control the type I error rate of multiple testing logistic regression analysis was adjusted by a bootstrap resampling analysis with 10,000 samples. For each sample, logistic regression was performed entering the factors with P < .01 on univariate analysis. The data analyses were performed using IBM SPSS Statistics version 20.0 (IBM Corporation, Armonk, NY).
3. Results
3.1. Characteristics of the reports
A total 2096 reports were identified from January 2014 to June 2017; of these, 113 were excluded because they were not PSIs. Of the 1983 PSIs, 91 were related to primary care or SUMMA-112 and 58 were reported from the department of Patient Liaison Service and Social Work Unit. The median of reports per department or nursing unit was 1 (range from 0 to 331). The PSI rate increased from 0.39 (2014) to 3.4 (2017) per 1000 stays. The reporting ratio ranges from 8.2 per 1000 stays in intensive care units to 0.02 per 1000 stays in outpatient units. Surgery theaters, emergency departments, intensive care units, and general adult care units comprised 82% of all PSIs (Fig. 1A). During the period of analysis, the FURM performed 10 training workshops on patient safety. There was a significant correlation between reporting rate and the number of workshop-trained local CSLs (Spearman coefficient = 0.874; P = .003) (Fig. 1B). The top 3 types of PSIs were due to surgical procedures (22.94%; 95% CI, 21.15–24.85), medications or vaccines (14.42%; 95% CI, 12.94–16.04), and care or monitoring of the patients (11.80%; 95% CI, 10.45–13.30) (Table 1). The groups of patients under 2 years of age and over 65 years were the most likely to have reported a PSI ( Chi-squared test, P < .015 and P = .048, respectively) (Fig. 2A); male patients were most likely to have reported a PSI than female patients (Chi-squared test, P = .041) (Fig. 2B); and nurses were more likely to report PSIs than physicians (Fig. 2C). The ratio between near misses and adverse events was 9.02. Nurses were more likely to report near misses (1144/1247, 91.74%), than physicians (459/555, 82.70%) (OR, 2.31; 95% CI, 1.89–2.79; P < .001).
Figure 1.
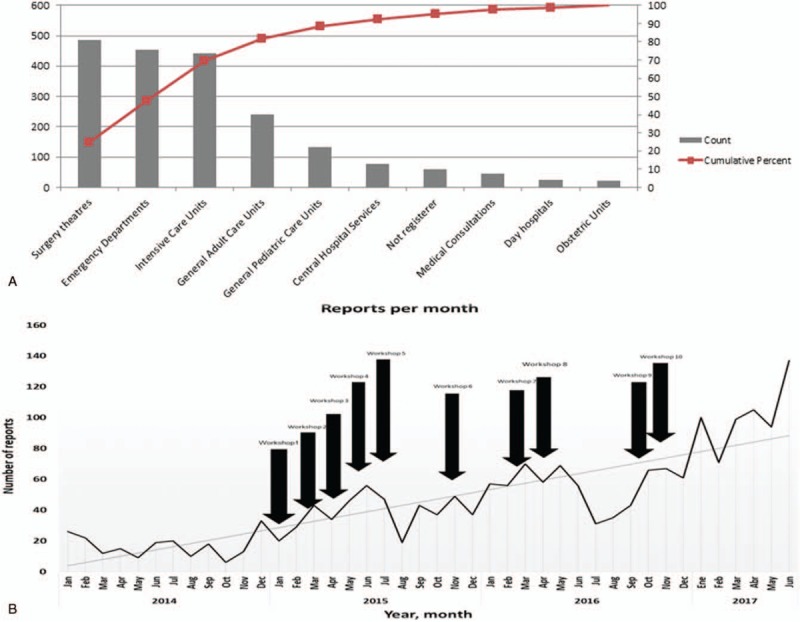
Pareto chart showing areas of hospitalization and patient safety incident frequency (A). Number of reports per month (line) versus training workshops for the local clinical safety leaders (arrows) (B).
Table 1.
Characteristics of PSIs (n = 1983): phase, type, evolution, who was informed, and if the PSI could have been prevented.
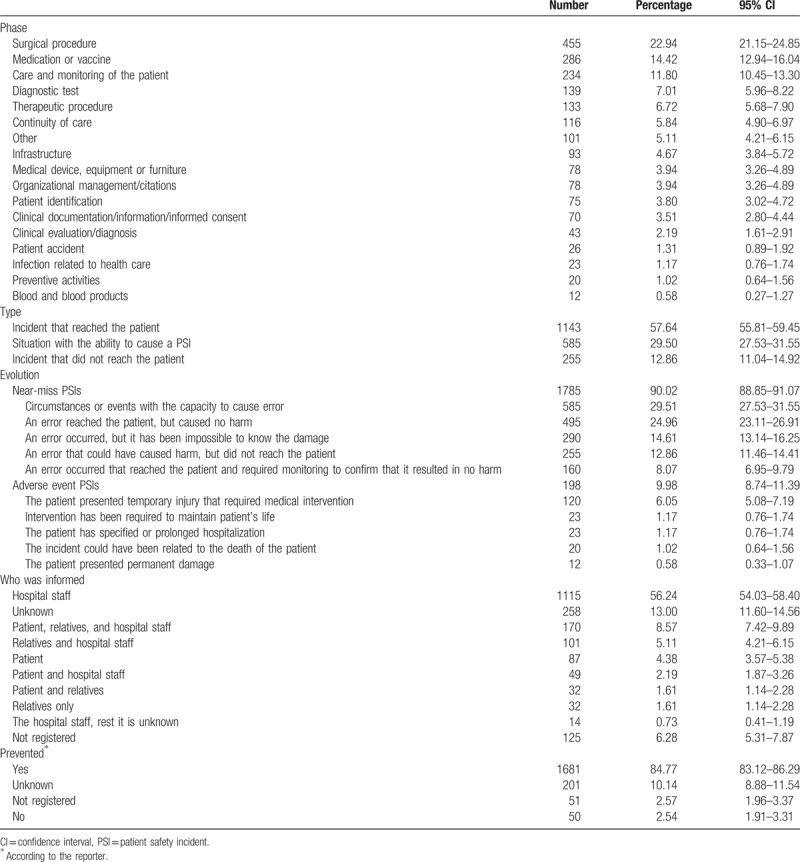
Figure 2.
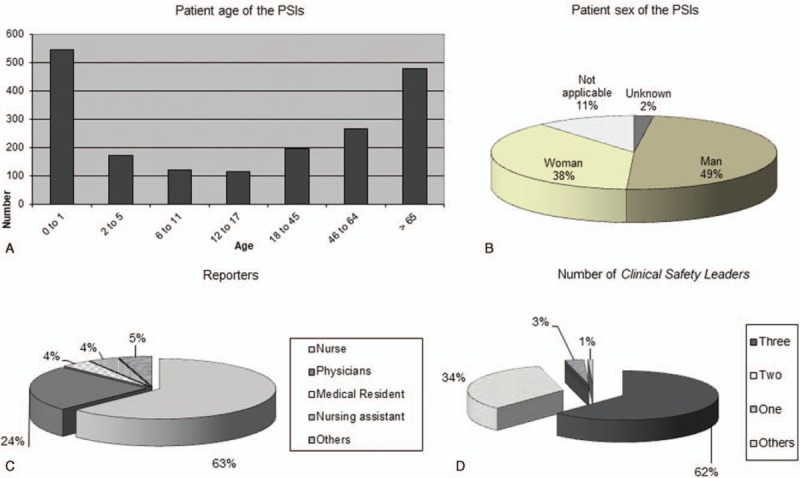
Patient age (A), and sex (B) of the patient safety incident (PSI). Type of reporter (C) of PSIs. Number of clinical safety leaders assigned to analysis of PSI (D).
3.2. PSI analysis
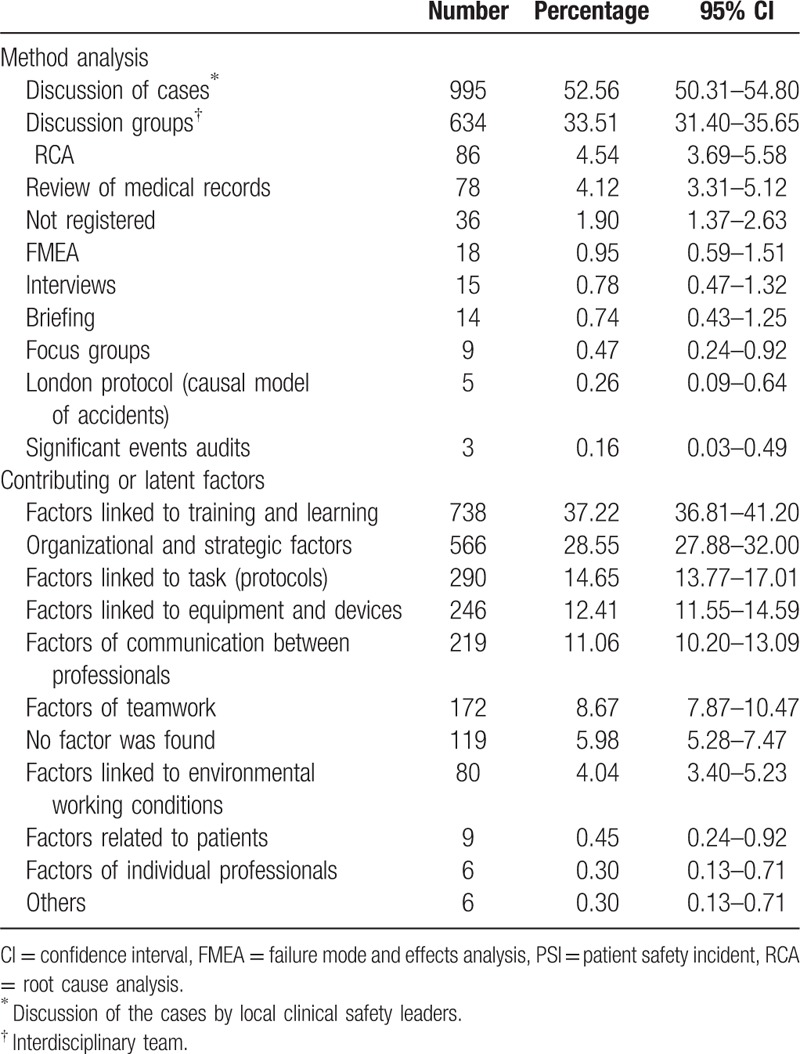
At the time of the analysis, 1546 (77.96%) reports had been analyzed. The number of local CSLs assigned to an analysis was 2 or 3 in 96% of reports (Fig. 2D). The time from reporting to analysis varied from within 24 hours, for high priority PSIs, to within 3 months, median 26 days. The most frequently used method of PSI analysis was the discussion of cases (52.56%), followed by discussion groups (33.51%) (Table 2). The median of time from analysis to the implementation of the improvements was 30 days (range from 1 to 98 days). Contributing or latent factors were reported for 1427 PSIs, not having a contributing factor listed in 7.70% of PSIs. Contributing factors were multifactorial for some PSIs; the mean of contributing factors was 1.63 per PSI (Table 2).
Table 2.
Methods of analysis and contributing or latent factors of the PSIs (n = 1893).
3.3. Improvement measures
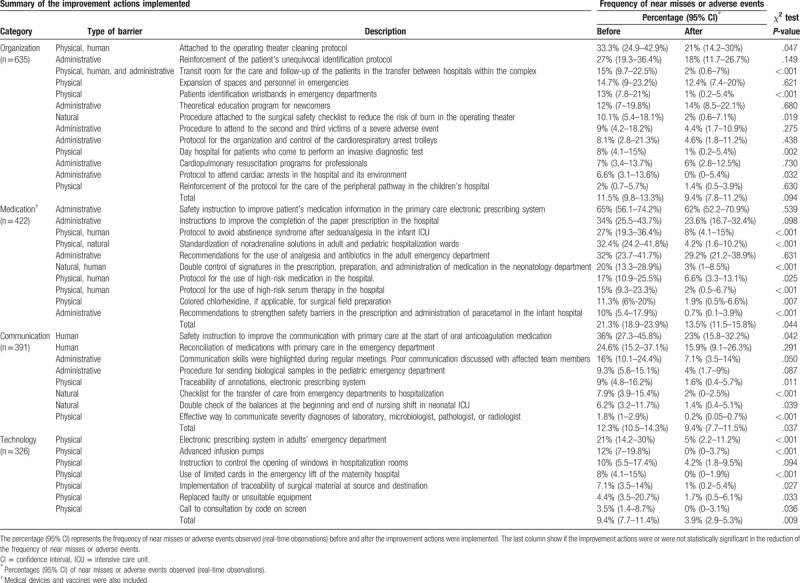
At the time of the data analysis, 207 (of 1427, 14.50%) improvement measures were pending implementation. Finally, 1635 improvement measures were implemented. The mean of the improvement measures was 1.34 per PSI, with 1774 related contributing or latent factors (Table 3).
Table 3.
Summary of the improvement actions (n = 1774 factor addressed) per category and type of barrier.
3.4. Effectiveness of the improvements implemented
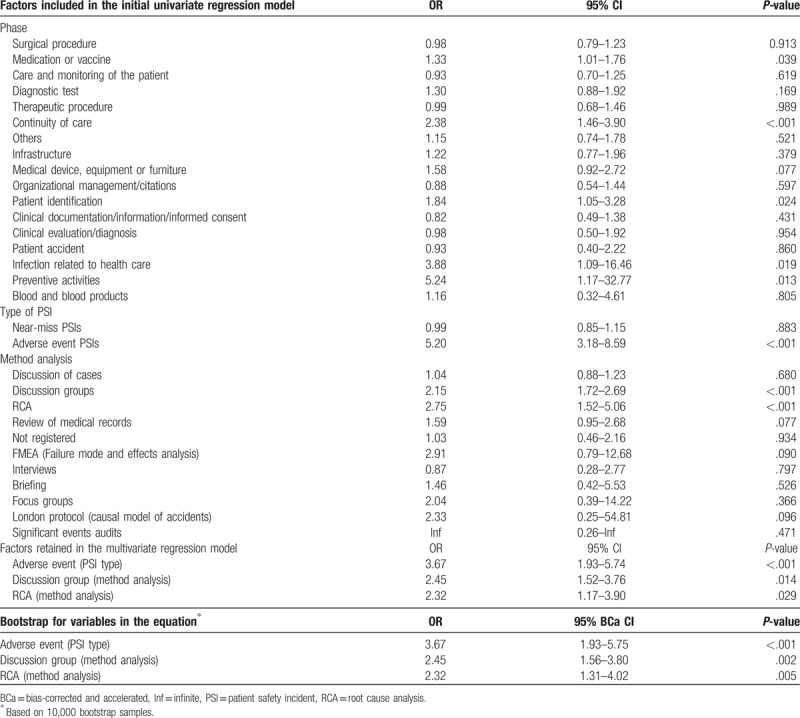
A total of 24,836 real-time observations were made over 1220 PSIs, before analysis (n = 12371; median of 10, range 8–20, observations per PSI) and after implementation of the improvement (n = 12,465, median of 10, range 8–25, observations per PSI). A summary of the improvement measures (n = 1774 factors) per category and type of barrier before and after improvement actions and the statistical significance in the reduction of PSIs are recorded in Table 3: 13 recommendations in organization (n = 635 factors), 10 to prevent medication errors (n = 422 factors), 8 to enhance communication (n = 391 factors), and 7 in the category of technology (n = 326 factors). The analysis showed a statistically significant reduction in near misses or adverse events, observed in 63.15% (medication, P = .044; communication, P = .037; and technology, P = .009) of the improvements implemented, but not in organization category (P = .094) (Table 3). There were significant differences in most of the physical and natural improvement measures, but there were no significant differences for the majority of the administrative measures (Table 3). Factors included in the initial univariate logistic regression model are shown in Table 4. The logistic regression model retained the following variables: “adverse event” type of PSI (OR, 3.67; 95% CI, 1.93–5.74), “discussion group” type of analysis (OR, 2.45; 95% CI, 1.52–3.76), and RCA type of analysis (OR, 2.32; 95% CI: 1.17–3.90) (Table 4), were associated with the reduction in near misses or adverse events after the implementation of the improvement actions in a statistically significant manner. The same factors were retained in the bootstrap model. Bootstrap bias-corrected and accelerated CIs for variables in the equation are showed in Table 4.
Table 4.
Factors, characteristics of PSIs, and method of analysis, included in the initial univariate regression model and significant results in the multivariate analysis.
4. Discussion
Voluntary IRSs are not intended to be an accurate picture of the incidence or severity of PSIs that occur in our centers, but a valuable resource to understand and act on the latent and contributing factors of a representative sample of PSIs.[12,13] In fact, the main drawback of the IRS is the high level of under-reporting; according to the Spanish National Study of Adverse Events,[14] the incidence density of adverse events is 14 per 1000 patient-stay days. This means that in our center, under-reporting is approximately 82%. During the period of analysis, the PSI rate increased from 0.39 in 2014 to 3.4 in 2017 per 1000 stays. There was also a significant correlation between the patient safety workshops and the number of reports per month (Fig. 1B). A positive correlation between reports and the workshops are accepted as a sign of a better safety culture of the organization.[15]
Other studies have evaluated the effectiveness of IRSs. Hutchinson et al[16] analysis patterns in reporting of PSI as trend over time, the relationship between reporting rates and other safety and quality data sets. There was no apparent association between reporting rates and the following data: standardized mortality ratios, data from other safety-related reporting systems, hospital size, average patient age, or length of stay. They found a correlation between higher reporting rate and a more positive safety culture. Anderson et al[17] examined the perceived effectiveness of IRSs though a documentary analysis and semi-structured interviews. They found that using incident reports to improve care is challenging and the study highlighted the complexities involved and the difficulties faced by staff in learning from incident data. These studies were not designed to assess the effectiveness of the different types of improvement actions or barriers. The methodology of this study has been revealed which improvement actions have been most effective, and which that those improvement actions should be prioritized by the organization.
Medical chart review has been considered the “gold-standard” for identifying adverse events in many patient safety studies.[18] Compared with medical chart reviews, the IRS identified a larger number of preventable incidents and required significantly fewer resources than did the retrospective medical chart review. For example, the IRS identified adverse events related to the organization or to technology (35% of all PSIs); possibly, the staff believed that the patients’ medical records were not the correct place for reporting these types of safety problems.[19] Medical chart review cited incidents such as iatrogenic infections and unrelieved pain, which were identified less often by the IRS.[20] However, the hospital has other data collections, such as the hospital-acquired infections program (Spanish Prevalence Study of Nosocomial Infections),[21] the Bacteraemia Zero project,[22] the Pneumonia Zero project,[23] and the hospital pain program,[24] which identified and performed actions to reduce their incidence. Both the IRS and the medical chart review are likely able to identify problems of patient safety that are responsive to actions to improve the quality of care,[4] but they must provide evidence of changes in process or outcomes. In this sense, this study examined the effectiveness of the improvement measures over 1774 contributing or latent factors on the reduction or the occurrence of near-miss or adverse events. In agreement with the data in the literature, improvement actions that included physical or natural barriers proved to be more effective than human and administrative barriers.[25] In addition, the improvement measures achieved a reduction in litigation claims in the hospital following the implementation of the IRS, moving from the second-highest number of claims among Spanish hospitals in 2015[26] to the 4th highest in 2016.[27]
4.1. Lessons and limitations
To use real-time observations as a measure to assess the reduction of near misses or adverse events is a good proxy for the effectiveness of an IRS. A systematic review of health care workers compliance with hand hygiene guidelines in hospital suggested that comparing with self-reported behaviors, observed practice showed very poor rate of adherence to guidelines. That is in part because, previous studies have generally linked predictors of hand hygiene with health care workers intended or self-reported behavior rather than their real-time observations.[28] But when real-time observations were made the explanations for noncompliance with hand hygiene provides a coherent way to design better interventions.[29] In this sense, this study measured PSIs in 2 different ways: to assess patient safety awareness of health professionals, we used the notifications of PSIs in our IRS and we observed that notifications increased through the period of study. To assess the efficacy of the measures we implemented, we performed real-time observations before and after the improvement actions. External staff recorded events directly observed in the location of each PSI notified by the IRS. The impact of the interventions by PSIs rates (before and after) was obtained through direct observations. The reduction of near misses or adverse events could not be due to the decrease of awareness and willingness to report such events, given that the information was obtained through real time observation
The study of the near misses as a surrogate for adverse events is relevant because incidents constitute a population in which the adverse event is a subset. Analysis of these reports indicates that both human and systemic factors contributing to human errors can be identified.[30] According with the results of the study, nurses and other non-health staff groups (e.g., cooks, maintenance technicians, clerks, cleaning personnel) reported more incidents ending with no harm to the patient.[31] The aggregating data analysis collected at a local level reveals more widely latent conditions but is time-consuming.[32] Near-miss was the type of PSI with more improvement measures pending implementation in the hospital (207 measures).
The low impact of theoretical education program for newcomers on the reduction of PSIs is worrisome (Table 3). Traditional education programs for health professionals in hospitals, such as this one, are mainly theoretical and do not focus on practical skills as communication, leadership, and team work. There is a growing body of literature supporting the use of simulation as a more effective educational tool to promote practical abilities among physicians and nurses in clinical practice. Thus, the implementation of this educational method in patient safety could help reduce PSIs.[33,34]
There are also questions about the effectiveness and cost of IRSs. Renshaw et al[35] estimated that “the cost of the system was equivalent to 1184 UK National Health Service (NHS) employees spending all their time each month completing incident forms,” which were time-consuming to complete.[36] For this reason, this IRS aims to take less time to complete, a median of 10 minutes (159 reports evaluated, range from 3 to 20 minutes).
Our study was performed at a single tertiary hospital. In addition to being a single-center project, there are some other possible conditions limiting generalizability. One area of possible bias was that no comparison with other IRSs has been made. A direct comparison of 2 different IRS methods would provide valuable information regarding success factors, and to facilitate the choice between different IRSs.
5. Conclusion
In conclusion, the implementation of a hospital IRS, together with the systematization of the method and analysis of IRSs by local CSLs has led to improvement measures for over 1774 contributing or latent factors (median of 1.34 per PSI). The analysis showed a statistically significant reduction of near-miss or adverse events observed in 63.15% of the improvements implemented. The variables associated with significant improvement measures were “adverse events” type of PSI, “discussion group,” and RCA type of analysis. There was also a significant correlation between the patient safety workshops and the number of reports per month. All contribute directly to safer care, which is an important boost to the consolidation of the patient safety culture in the hospital.
Acknowledgments
The authors are grateful to other members of the FURM for their contribution to this work. The authors like to thank Juliette Siegfried and her team at ServingMed.com for their editing of the manuscript.
Author contributions
Conceptualization: Elena Ramírez, Alberto Martín, Yuri Villán, Jonay Ojeda, José A. Blázquez, Ana Frank.
Data curation: Marta Moro, Miguel Avenza, María J Domingo, Pablo Alonso, María J. Asensio, Rafael Hernández, Working Group SINOIRES.
Formal analysis: Elena Ramírez, Alberto Martín, Yuri Villán, Miguel Lorente, Marta Moro, Miguel Avenza, María J Domingo, Pablo Alonso, María J. Asensio, Rafael Hernández.
Funding acquisition: Elena Ramírez.
Methodology: Elena Ramírez, Yuri Villán, Jonay Ojeda, Marta Moro, Ana Frank.
Software: Miguel Lorente.
Supervision: Miguel Lorente.
Validation: Alberto Martín, Pablo Alonso, María J. Asensio.
Writing – original draft: Elena Ramírez, Alberto Martín, Yuri Villán.
Writing – review & editing: Jonay Ojeda, Carmen Vara, José A. Blázquez, Jesús Frías, Ana Frank.
Supplementary Material
Footnotes
Abbreviations: CMHC = Community of Madrid Heath Council, CSLs = clinical safety leaders, FURM = Functional Unit of Risk Management, IRSs = incident-reporting systems, OR = odds ratio, PSIs = patient safety incidents.
ER, JO, MJA, ML, and MM are part of the SINOIRES intellectual property.
The authors have no other conflicts of interest to disclose. The authors have no funding to disclose.
Supplemental Digital Content is available for this article.
Members of the SINOIRES Working Group are listed in Appendix S1.
Contributor Information
Collaborators: SINOIRES Working Group
References
- [1].Institute of Medicine. To Err is Human: Building a Safer Health System. Washington, DC: National Academy Press; 1999. [Google Scholar]
- [2].Müller M. Risk and error management: can medicine benefit from lessons learned in aviation? [in German]. Bundesgesundheitsblatt Gesundheitsforschung Gesundheitsschutz 2015;58:95–9. [DOI] [PubMed] [Google Scholar]
- [3].Brunsveld-Reinders AH, Arbous MS, De Vos R, et al. Incident and error reporting systems in intensive care: a systematic review of the literature. Int J Qual Health Care 2016;28:2–13. [DOI] [PubMed] [Google Scholar]
- [4].Stavropoulou C, Doherty C, Tosey P. How effective are incident-reporting systems for improving patient safety? A systematic literature review. Milbank Q 2015;93:826–66. [DOI] [PMC free article] [PubMed] [Google Scholar]
- [5].Sistema de Notificación y Aprendizaje para la Seguridad del Paciente (SiNASP). Available at: https://www.sinasp.es/. Accessed September 9, 2018. [Google Scholar]
- [6].Shojania KG. The frustrating case of incident-reporting systems. Qual Saf Health Care 2008;17:400–2. [DOI] [PubMed] [Google Scholar]
- [7].Moccia A, Quattrin R, Battistella C, et al. An easy, prompt and reproducible methodology to manage an unexpected increase of incident reports in surgery theatres. BMJ Open Qual 2017;6:e000147. [DOI] [PMC free article] [PubMed] [Google Scholar]
- [8].Linam WM, Margolis PA, Atherton H, et al. Quality-improvement initiative sustains improvement in pediatric health care worker hand hygiene. Pediatrics 2011;128:e689–98. [DOI] [PubMed] [Google Scholar]
- [9].White CM, Statile AM, Conway PH, et al. Utilizing improvement science methods to improve physician compliance with proper hand hygiene. Pediatrics 2012;129:e1042–50. [DOI] [PubMed] [Google Scholar]
- [10].Organic law 15/1999 of December 13, 1999 on the Protection of Personal Data. BOE núm. 298, December 14, 1999, 43088-43099. Available at: https://rm.coe.int/CoERMPublicCommonSearchServices/DisplayDCTMContent?documentId=09000016806af30e. Accessed September 9, 2018. [Google Scholar]
- [11].Department of Health, Western Australia. Clinical Incident Management Policy. (2012). Perth: Patient Safety Surveillance Unit, Performance Activity and Quality Division. Available at: http://www.health.wa.gov.au/CircularsNew/attachments/731.pdf. Accessed September 9, 2018. [Google Scholar]
- [12].Baba-Akbari A, Sheldon TA, Cracknell A, et al. Sensitivity of routine system for reporting patient safety incidents in an NHS hospital: retrospective patient case note review. BMJ 2007;334:79Epub 2006 Dec 15. [DOI] [PMC free article] [PubMed] [Google Scholar]
- [13].Bañeres J, Orrego C, Suñol R, et al. Systems for recording and reporting adverse effects and incidents: a strategy to learn from mistakes [in Spanish]. Rev Calid Asist 2005;20:216–22. Available at: https://www.seguridaddelpaciente.es/conferencias/II/contenidos/docs/interes/3/3d.pdf. Accessed September 9, 2018. [Google Scholar]
- [14].National Study on Hospitalisation-Related Adverse Events ENEAS 2005. Report, February 2006. Quality Plan for the National Health System. Available at: http://www.who.int/patientsafety/information_centre/reports/ENEAS-EnglishVersion-SPAIN.pdf. Accessed September 9, 2018. [Google Scholar]
- [15].Howell A-M, Burns EM, Bouras G, et al. Can patient safety incident reports be used to compare hospital safety? Results from a quantitative analysis of the English National Reporting and Learning System Data. PLoS One 2015;10:e0144107. [DOI] [PMC free article] [PubMed] [Google Scholar]
- [16].Hutchinson A, Young TA, Cooper KL, et al. Trends in healthcare incident reporting and relationship to safety and quality data in acute hospitals: results from the National Reporting and Learning System. Qual Saf Health Care 2009;18:5–10. [DOI] [PubMed] [Google Scholar]
- [17].Anderson JE, Kodate N, Walters R, et al. Can incident reporting improve safety? Healthcare practitioners’ views of the effectiveness of incident reporting. Int J Qual Health Care 2013;25:141–50. [DOI] [PubMed] [Google Scholar]
- [18].Murff HJ, Patel VL, Hripcsak G, et al. Detecting adverse events for patient safety research: a review of current methodologies. J Biomed Inform 2003;36:131–43. [DOI] [PubMed] [Google Scholar]
- [19].Beckmann U, Bohringer C, Carless R, et al. Evaluation of two methods for quality improvement in intensive care: facilitated incident monitoring and retrospective medical chart review. Crit Care Med 2003;31:1006–11. [DOI] [PubMed] [Google Scholar]
- [20].Sari AB-A, Sheldon TA, Cracknell A, et al. Sensitivity of routine system for reporting patient safety incidents in an NHS hospital: retrospective patient case note review. BMJ 2007;334:79. [DOI] [PMC free article] [PubMed] [Google Scholar]
- [21]. Spanish Prevalence Study of Nosocomial Infections. EPINE [In Spanish]. Spanish Society of Preventive Medicine Public Health and Hygiene. Available at: http://hws.vhebron.net/epine/. Accessed September 9, 2018. [Google Scholar]
- [22].Bacteriemia zero, 1st edition, 2009. Adapted to Spanish with permission from Johns Hopkins University by the Ministry of Health and Consumer Affairs of Spain and the Department of Patient Safety of the World Health Organization. Published by the Ministry of Health and Consumption of Spain. Available at: https://www.seguridaddelpaciente.es/es/proyectos/financiacion-estudios/proyecto-bacteriemia-zero/. Accessed September 9, 2018. [Google Scholar]
- [23].Protocol for the prevention of pneumonias related to mechanical ventilation in Spanish ICUs. 1st edition, 2011. Published by the Ministry of Health, Social Policy and Equality of Spain. The Spanish Society of Intensive Medicine, Critical and Coronary Units (SEMICYUC) and the Spanish Society of Intensive Nursing and Coronary Units (SEEIUC). Available at: http://www.semicyuc.org/sites/default/files/protocolo_nzero.pdf. Accessed September 9, 2018. [Google Scholar]
- [24].Muñoz-Ramón JM, Mañas Rueda A, Aparicio Grande P. The pain committee within the structure of total quality management in a university hospital. [In Spanish] Rev Soc Esp Dolor [Internet] 2010; 17: 343-348. Available at: http://scielo.isciii.es/scielo.php?script=sci_arttext&pid=S1134-80462010000700008&lng=es. Accessed September 9, 2018. [Google Scholar]
- [25].Seven steps to patient safety. The full reference guide. The National Patient Safety Agency (NPSA) of the National Health Service (NHS) of United Kingdom. Second print August 2004. Available at: http://webarchive.nationalarchives.gov.uk/20150505145833/http://www.nrls.npsa.nhs.uk/resources/collections/seven-steps-to-patient-safety/?entryid45=59787. Accessed September 9, 2018. [Google Scholar]
- [26].Association “The Patient Advocate”. Report 2015 [in Spanish]. Available at: http://www.negligenciasmedicas.com/wp-content/uploads/2015/01/MEMORIA-2015.pdf. Accessed September 9, 2018. [Google Scholar]
- [27].Association “The Patient Advocate”. Report 2016 [in Spanish]. Available at: http://www.negligenciasmedicas.com/wp-content/uploads/2016/01/MEMORIA-2016.pdf. Accessed September 9, 2018. [Google Scholar]
- [28].Erasmus V, Daha TJ, Brug H, et al. Systematic review of studies on compliance with hand hygiene guidelines in hospital care. Infect Control Hosp Epidemiol 2010;31:283–94. [DOI] [PubMed] [Google Scholar]
- [29].Fuller C, Besser S, Savage J, et al. Application of a theoretical framework for behavior change to hospital workers’ real-time explanations for noncompliance with hand hygiene guidelines. Am J Infect Control 2014;42:106–10. [DOI] [PubMed] [Google Scholar]
- [30].Heinrich HW. Industrial Accident Prevention: A Scientific Approach. New York and London: Mc Graw-Hill; 1941. [Google Scholar]
- [31].Griffith R. Duty of candour requires better protection for nurses. Br J Nurs 2013;10:350–1. [DOI] [PubMed] [Google Scholar]
- [32].Reason JT. The Human Contribution. Burlington, VT: Ashgate; 2008. Available at: http://www.ashgatepublishing.com/pdf/leaflets/The_Human_Contribution_2009.pdf. Accessed February 1, 2015. [Google Scholar]
- [33].Morgan J, Green V, Blair J. Using simulation to prepare for clinical practice. Clin Teach 2018;15:57–61. [DOI] [PubMed] [Google Scholar]
- [34].Shin S, Park JH, Kim JH. Effectiveness of patient simulation in nursing education: meta-analysis. Nurse Educ Today 2015;35:176–82. [DOI] [PubMed] [Google Scholar]
- [35].Renshaw M, Vaughan C, Ottewill M, et al. Clinical incident reporting: wrong time, wrong place. Int J Health Care Quality Assurance 2008;21:380–4. [DOI] [PubMed] [Google Scholar]
- [36].Travaglia JF, Westbrook MT, Braithwaite J. Implementation of a patient safety incident management system as viewed by doctors, nurses and allied health professionals. Health 2009;13:277–96. [DOI] [PubMed] [Google Scholar]
Associated Data
This section collects any data citations, data availability statements, or supplementary materials included in this article.


