

Abstract
Background:
Modic changes (MCs) associated with low back pain (LBP) have been assessed in a few studies. It has been documented that patients with LBP have MCs in a specific segment, but the relationship between facet joint or disc degeneration and MCs is still disputed. Thus, we aimed to evaluate the correlation between MC and facet joint or disc degeneration using imaging.
Methods:
Imaging data of patients were retrospectively analyzed at the Orthopedic Department of the First Affiliated Hospital of Nanchang from January 2014 to August 2017. MCs, facet joint degeneration, and disc degeneration in L3-S1 were evaluated by lumbar MRI. χ2 test and contingency correlation coefficient were used for the statistical analyses, and a P value < .05 was considered statistically significant.
Results:
In the descriptive statistical analysis, MCs were found to have the highest incidence in the L4–5 segment. Type II MCs had a higher incidence than type I and type III MCs regardless of whether they were in the L3–4, L4–5, or L5-S1 segment. On one hand, MCs were more frequently distributed in grades 3, 4, and 5 of the degenerative lumbar discs regardless of whether they were in the L3–4, L4–5, or L5-S1 segment (P < .000, V: contingency coefficient >0); particularly, type II MCs were closely related to lumbar disc degeneration (P < .05, V > 0). On the other hand, MCs were more frequently distributed in grades 1, 2, and 3 of the degenerative lumbar facet regardless of whether they were in the L3–4, L4–5, or L5-S1 segment (P < .05, V > 0). Particularly, type II MCs were frequently distributed in grades 1, 2, and 3 of the facet joint in the L4–5 and L5-S1 segments (P < .05, V > 0).
Conclusion:
MCs are correlated with the grade of lumbar spine degeneration, including lumbar disc and facet joint degeneration. MCs, especially type II, frequently occurred in severe degeneration of the lumbar disc and facet joint. Thus, MC may be one of the manifestations of lumbar disc and facet joint degeneration.
Keywords: degeneration, lumbar disc, lumbar facet joint, magnetic resonance imaging (MRI), Modic change
1. Introduction
Modic changes (MCs) were discovered in 1988 by Modic and Steinberg,[1] who reported that MC is a signal change in magnetic resonance imaging (MRI) of the lumbar vertebral endplates and marrow. Likewise, other methods such as diffusion MRI, which was usually used in tumors, may be used for the assessment of the MCs of the marrow.[2–5] In addition, MCs were closely related to low back pain (LBP) and the imaging classifications of MC were presented by Modic et al,[6] based on their study on the vertebral MRI signal changes of 474 patients with LBP. Then, MCs were initially split into types I and II. Since then, MCs have attracted attention from researchers. In 2005, Kjaer et al's[7] cross-sectional cohort study of 412 patients reported that MCs and anterolisthesis were most strongly associated with LBP. In 2008, Rahme and Moussa[8] discovered that type I MCs are likely to be inflammatory in origin and seem to be strongly associated with active low back symptoms and segmental instability, thus reflecting a state of active degeneration and biomechanical instability of the lumbar spine according to the literature review. Moreover, in 2015, Hayashi et al[9] believed that age, disc degeneration, angular motion, and translational motion were significantly linked to MCs in the lumbar spine, and the translational motion of lumbar segments increased with type II MCs, whereas angular motion decreased as the type of MCs increased. Therefore, a number of scholars[10–12] believe that MCs are closely related to LBP, vertebral body motion, and spine degeneration.
In contrast, Keller et al's[13] prospective clinical cohort study of 269 patients with chronic LBP in 2012 showed that MCs did not influence the clinical course of back pain and were not prognostic factors for recovery. In general, type II and type III MCs are thought to represent the end stage of the degenerative process and are not assumed to cause symptoms.[1] Therefore, the controversy of MC being related to or not related to LBP exists.
In this study, we evaluated the outcomes of a clinical cohort of patients with lumbar disc herniation. The purpose was 3-fold: to investigate the prevalence of MCs, to investigate if MCs influence the lumbar disc herniation, and to identify correlations between the MCs and lumbar facet joint degeneration.
2. Methods
2.1. Clinical samples and data
Imaging data were obtained from 293 patients (median age: 54.3106 ± 13.92 years; range: 50–75 years; men: 154; women: 139; Table 1) who were hospitalized at the Orthopedic Department of the First Affiliated Hospital of Nanchang University from January 2014 to August 2017. The study protocol was approved by the Institutional Review Board of the First Affiliated Hospital of Nanchang University, and written informed consent was obtained from all study participants.
Table 1.
The demographic and clinical information of all patients.

Inclusion criteria were as follows: having undergone lumbar computerized tomography (CT) and MRI examination; and no history of spinal surgery. The exclusion criteria were as follows: lumbar spondylolisthesis, scoliosis, lumbar spine infection, spinal tumors, and other spine-related diseases; diabetes, hypertension, and other relevant medical history; history of smoking or alcoholism; psychological disorders, mental disorders, or drug use and other history; and body mass index (BMI) < 18.5 or BMI≥24.
2.2. Magnetic resonance imaging
MRI was performed on a 3.0 Tesla whole-body MR unit (Tim Trio, Siemens Medical Solutions, Erlangen, Germany) using a dedicated 8-channel spine coil (3 T Spine Matrix Coil, Siemens). All imaging was performed in the supine position and patients were told be calm and breathe normally as much as possible to keep the waist still. An experienced radiologist (TAS) and a director of spinal surgery evaluated the MRI results. The following MRI findings were recorded at the L1–5 of the lumbar spine: disc degeneration and herniation, facet joint degeneration, MCs, and High Intensity Zone.
2.3. MC classification in MRI
MCs were evaluated according to the Modic classification system. Type I MCs (Fig. 1) were hypointense on T1-weighted imaging (T1WI) and hyperintense on T2-weighted imaging (T2WI), and were shown to represent bone marrow edema and inflammation. Type II MCs (Fig. 2) were hyperintense on T1WI and isointense or slightly hyperintense on T2WI, and were associated with conversion of normal red hematopoietic bone marrow into yellow fatty marrow as a result of marrow ischemia.[1,14] Type III MCs (Fig. 3) were subsequently described as hypointense on both T1WI and T2WI and were thought to represent subchondral bone sclerosis.[6]
Figure 1.

Type I Modic changes are hypointense on T1-weighted imaging and hyperintense on T2-weighted imaging and represent bone marrow edema and inflammation.
Figure 2.

Type II Modic changes are hyperintense on T1-weighted imaging and isointense or slightly hyperintense on T2-weighted imaging and are associated with conversion of normal red hematopoietic bone marrow into yellow fatty marrow as a result of marrow ischemia.
Figure 3.

Type III Modic changes are subsequently described as hypointense on both T1- and T1-weighted imaging and are thought to represent subchondral bone sclerosis.
2.4. Disc degenerative grading in MRI
Morphological evaluation of the lumbar intervertebral discs (LIVDs) was performed using sagittal and axial T2WI. All grading data were independently evaluated by an experienced radiologist (15 years of experience with MRI) and an experienced orthopedic spine surgeon (10 years of specialization in spine surgery), and grading was performed using a double-blind method. The LIVD degeneration grading is shown in Table 2.
Table 2.
Modified Pfirrmann grading of LIVD degeneration using MRI.

The observers graded strictly the LIVD degeneration according to the improved Pfirrmann grading standard. To further exclude the subjective factor and better reflect the phenomenon, the LIVD degeneration grading was defined as follows based on the LIVD signals and disc height changes: grades 1, 2, 3, and 4 as Grade 1; 5 as Grade 2; 6 as Grade 3; 7 as Grade 4; and 8 as Grade 5.
2.5. Lumbar facet joint degenerative grading in MRI
We used the criteria proposed by Weishaupt, which defined the degree of facet degeneration using CT combined with MRI (Fig. 4).[15,16] Grade 1, normal facet joint space (2–4 mm width); Grade 2, narrowing of the facet joint space (<2 mm), small osteophytes, and/or mild hypertrophy of the articular process; Grade 3, narrowing of the facet joint space, moderate osteophytes, moderate hypertrophy of the articular process, and/or mild subarticular bone erosions; and Grade 4, narrowing of the facet joint space, large osteophytes, severe hypertrophy of the articular process, severe subarticular bone erosions, and/or subchondral cysts. All grading data were independently evaluated by an experienced radiologist (15 years of experience with MRI) and an experienced orthopedic spine surgeon (10 years of specialization in spine surgery), and grading was performed using the double-blind method.
Figure 4.
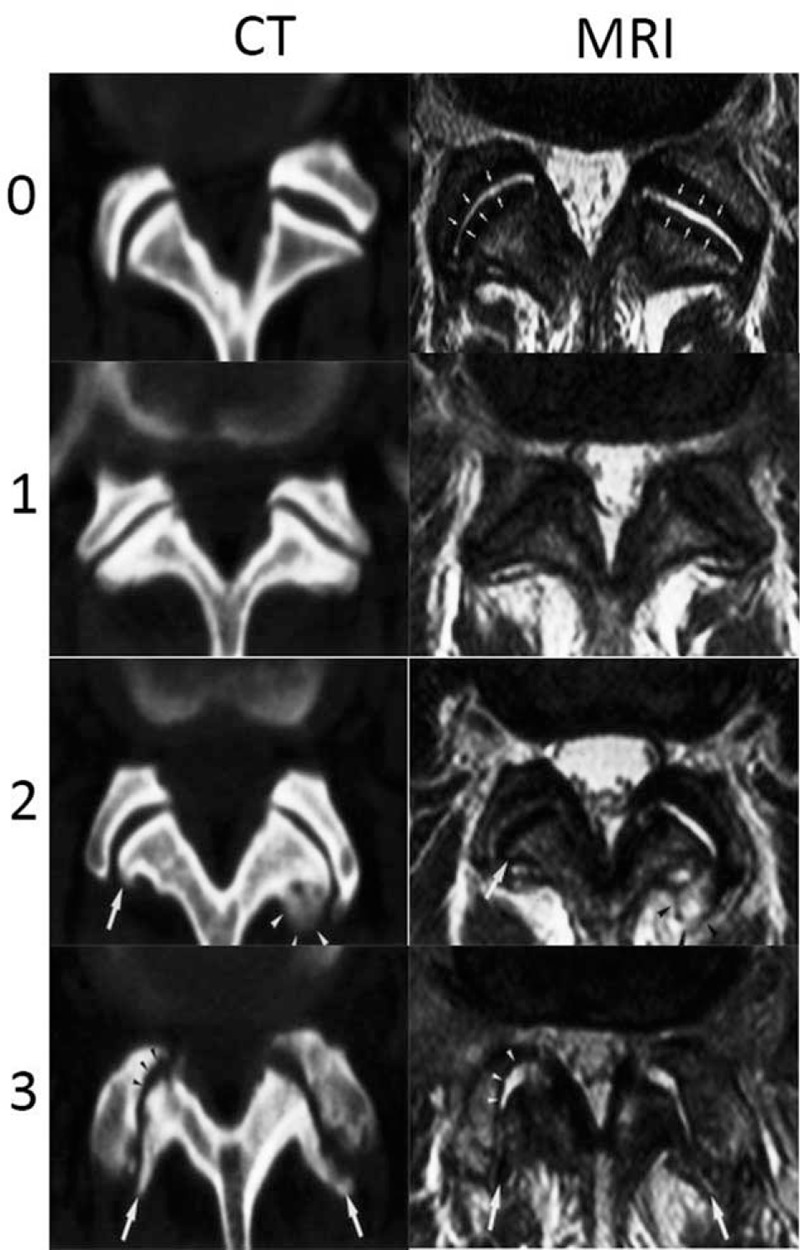
The Weishaupt grading of facet joint degeneration: Grade 0, normal facet joint space (2–4 mm width); Grade 1, narrowing of the facet joint space (<2 mm), mild osteophytes, and/or mild hypertrophy of the articular process; Grade 2, narrowing of the facet joint space, moderate osteophytes, moderate hypertrophy of the articular process, and/or mild subarticular bone erosions; and Grade 3, narrowing of the facet joint space, large osteophytes, severe hypertrophy of the articular process, severe subarticular bone erosions, and/or subchondral cysts.
3. Statistical analysis
All imaging data were independently evaluated by a radiologist and an orthopedic spine surgeon, and the Kappa Consistency Test was performed on the results of the two evaluations. The final grade used for the statistical analysis was determined by the consensus decision of the radiologist and orthopedic spine surgeon. All analyses were performed using SPSS 23.0 statistical software (SPSS Inc, Chicago, IL). All data were expressed as mean ± standard deviation, with the between-group difference evaluated using the χ2 test. Correlations between the MCs and facet joint or disc degeneration were evaluated using contingency correlation coefficient. P values < .05 were considered to be statistically significant.
4. Result
The Kappa Consistency Test showed that the Kappa values are greater than 0.8 in the 2 observers. Therefore, we hold that the grading data were reliable. The descriptive statistical analysis showed that MCs had the highest incidence rate in the L4–5 segment and type II MCs had the highest incidence rate compared with type I and type III MCs regardless of whether they are in the L3–4, L4–5, or L5-S1 segment (Table 1). Next, we wanted to find out whether MCs are related or not to lumbar disc degeneration. To do this, the degenerative grading results of the lumbar disc between with MC and without MC groups were compared using the χ2 test and contingency correlation analysis. The result indicated that there was a statistically significant difference between the 2 groups (P < .000), and MCs were more frequently distributed in Grades III, IV, and V of the degenerative lumbar discs regardless of whether they were in the L3–4, L4–5, or L5-S1 segment (Table 3: P < .000, V > 0). In addition, the correlation of MC types and lumbar disc degeneration was analyzed using the χ2 test and contingency correlation. We discovered that type I, II, and III MCs were frequently distributed in Grades III, IV, and V of the degenerative lumbar discs regardless of whether they are in the L3–4, L4–5, or L5-S1 segment (Table 4: P < .05, V > 0), and especially, type II MCs were closely related to lumbar disc degeneration. Finally, we evaluated whether MCs are related to facet joint degeneration. The result showed that there was a statistically significant difference between the 2 groups (P < .05), and MCs are more frequently distributed in Grades 1, 2, and 3 of the degenerative lumbar facet regardless of whether they are in the L3–4, L4–5, or L5-S1 segment (Table 5: P < .05, V > 0). Furthermore, we discovered that type II MCs were frequently distributed in Grades 1, 2, and 3 of the facet joint in the L4–5 and L5-S1 segments.
Table 3.
Correlation between MCs and lumbar disc degeneration at lower lumbar in MRI by χ2.

Table 4.
Correlation between type of MCs and lumbar disc degeneration at 3 lower lumbar in MRI.

Table 5.
Correlation between MCs and lumbar facet joint degeneration at lower lumbar in MRI.

5. Discussion
MC, linked with LBP, represents an inflammatory signal in the MRI of the lumbar vertebral endplates and tissues, which was classified into 3 types by Modic et al [6] Type I MCs were hypointense on T1WI and hyperintense on T2WI, and were shown to represent bone marrow edema and inflammation. Type II MCs were hyperintense on T1WI and isointense or slightly hyperintense on T2WI, and were associated with conversion of normal red hematopoietic bone marrow into yellow fatty marrow as a result of marrow ischemia.[1,14] Type III MCs were subsequently described as hypointense on both T1WI and T2WI, and were thought to represent subchondral bone sclerosis.[6] These imaging changes caused widespread concern to scholars. However, Abdel Razek and Castillo[17] demonstrated that other diseases, such as spinal tumors, can stimulate degeneration disorder, with imaging findings similar to those of MCs. Hence, we need to assess these images carefully.[17]
In recent years, the relationship between MCs and lumbar spine degeneration has been extensively studied by foreign scholars. Toyone et al[18] showed that the incidence rate of MCs in the patients with lumbar disc degeneration is about 19% to 59%, of which types I and II are the most common, whereas type III and the mixed types are rare. This is consistent with the incident rate of this study, in which the incidence rate of MCs is 44.82%. In addition, Teichtahl et al[19] discovered that severe disc degeneration (Grades 4 and 5) was associated or tended to be associated with type II MC in the L2–5 segment; their cross-sectional study included 72 community-based individuals who may or may not have LBP. Then, the 4-year prospective study by Jensen et al[20] on (without LBP) 344 Danish cases found that the incidence rate of MCs was 19.5%, wherein 84% were of type I. Moreover, they discovered that the greater the range of MCs, the more severe the degeneration of the adjacent segments. Kerttula et al[21] selected participants from 3811 patients with consecutive chronic low-back pain referred for 6 consecutive years to a standard lumbar spine MRI study at a university hospital. They reported that endplate deformation, decreased disc height, and disc signal intensity changes appear to be essential features of accelerated degenerative process associated with type I MCs. In our study, we aimed to find some correlations between MCs and degeneration of 3-joint complex of the lower lumbar spine. We took the modified Pfirrmann grading of lumbar disc degeneration and the Weishaupt degree of facet degeneration into consideration and indeed found some correlations between them.
In our study, we discovered that a statistically significant correlation existed between MCs and lumbar disc degeneration (Tables 1 and 3: P < .05, V > 0), which showed that MCs had the highest incidence in the L4–5 segment. This is similar to the findings of previous studies.[22,23] Moreover, based on the modified Pfirrmann grading of LIVD degeneration, we found that the 3 types of MCs, especially Type II, are more frequently distributed in Grades III, IV, and V of the degenerative lumbar discs regardless of whether they are in the L3–4, L4–5, or L5-S1 segment, and we also prove that MCs were accompanied with a degenerative disc disease at the same vertebral level (Table 4: P < .05, V > 0). This is consistent with the results of a previous study,[24] wherein the authors recruited 108 patients with lumbar degenerative disc disease graded using the Pfirrmann system; they demonstrated that MCs were correlated with the grade of disc degeneration. A research by de Roos et al[14] reported that severe disc degeneration (Grades 4 and 5) was associated or tended to be associated with type II MC, and this further proves our results. In addition, we found that all MCs frequently appeared in 1, 2, and 3 grading of the degenerative facet joint in the L3-S1 segment. In other words, MCs frequently appeared in the real degenerative lumbar facet joint (Table 5: P < .05, V > 0). Among the 3 types of MCs, type II was the most common with the exception of the L3–4 segment (Table 6: P < .05, V > 0). We found that few scholars have reported the direct correlations between MCs and lumbar facet joint degeneration. However, we also found their indirect relationship. Crock[25] posits the theory of “intervertebral disc rupture” and considered that the long-term damage of the disc caused the local inflammatory reaction of the endplate, resulting in MC. A study by Muehleman et al,[26] who selected a total of 57 (18 female and 39 male) cadaveric human spines from the Gift of Hope Organ and Tissue Donor Network, demonstrated that facet joint degeneration is common, occurs early, and progresses with lumbar disc degeneration. Thus, we believe that MCs are indirectly associated with lumbar facet joint degeneration, consistent with the abovementioned studies. In the current study, the result showed that type II MCs had the highest incidence rate regardless of whether they are in the L3–4, L4–5, or L5-S1 segment (Table 1). Some researchers[27,28] believe that type I MCs are not stable, easy to change into type II MCs; whereas type II will not change into type III, and type III MCs are rare and have an unknown etiology. Therefore, type II is considered to be the most stable type of MC,[8] which could be the main reason that type II is the most common.
Table 6.
Correlation between type of MCs and lumbar facet joint degeneration at 3 lower lumbar in MRI.

6. Limitations of this study
The current study has a few limitations. First, it is a retrospective study; a prospective study of MRI findings would yield more convincing results. Second, the specific mechanisms underlying the relationship between MCs and lumbar spine degeneration are still unclear.
7. Conclusions
Based on the literature review and statistical analyses of the imaging data of 293 patients, we conclude that MCs are correlated with the grading of lumbar disc degeneration. Moreover, type II MCs frequently occur in severe disc degeneration (Grades 3, 4, and 5) at the same vertebral level regardless of whether they are in the L3–4, L4–5, or L5-S1 segment. In addition, MCs are correlated with lumbar facet joint degeneration, and type II MCs are most common in the L4-S1 segment.
Acknowledgments
The authors greatly appreciate the assistance of the staff from the Department of Imaging, The First Affiliated Hospital of Nanchang University, and thank them for their efforts. The authors greatly appreciate the assistance of Editag which is Language Service Company.
Author contributions
Conceptualization: Min Dai.
Data curation: Xiaowei Yang, Tian Gao, Fuchong Lai.
Formal analysis: Yanchun Zhong, Fuchong Lai.
Funding acquisition: Min Dai, Bin Zhang.
Investigation: Ping Zhan.
Methodology: Ping Zhan.
Project administration: Min Dai, Ping Zhan, Bin Zhang.
Supervision: Min Dai, Bin Zhang.
Writing – original draft: Runsheng Guo, Qi Lai.
Writing – review & editing: Qi Lai, Bin Zhang.
Footnotes
Abbreviations: CT = computerized tomography, LBP = low back pain, LIVD = lumbar intervertebral discs, MCs = Modic changes, MRI = magnetic resonance imaging, T1WI = T1-weighted imaging, T2WI = T2-weighted imaging.
The study protocol was approved by the Ethical Institutional Review Board of the First Affiliated Hospital of Nanchang University, and written informed consent was obtained from all study participants.
RG, XY, and YZ contributed equally to this work and should be considered co-first authors.
This study was supported by Science Technology Plan of Jiangxi Provincial Health Planning Commission (20175112), Jiangxi Provincial Department of Science and Technology (20151BBG70206), Jiangxi Provincial Department of Science and Technology (20171BAB205059), Jiangxi provincial department of education (GJJ160127), Jiangxi provincial department of education (GJJ170883).
The authors have no conflicts of interest to disclose.
References
- [1].Modic MT, Steinberg PM, Ross JS, et al. Degenerative disk disease: assessment of changes in vertebral body marrow with MR imaging. Radiology 1988;166:193–9. [DOI] [PubMed] [Google Scholar]
- [2].Razek AAKA, Ashmalla GA. Assessment of paraspinal neurogenic tumors with diffusion-weighted MR imaging. Eur Spine J 2018;27:841–6. [DOI] [PubMed] [Google Scholar]
- [3].Razek AA, Abdalla A, Fathy A, et al. Apparent diffusion coefficient of the vertebral bone marrow in children with Gaucher's disease type I and III. Skeletal Radiol 2013;42:283–7. [DOI] [PubMed] [Google Scholar]
- [4].Surov A, Nagata S, Razek AA, et al. Comparison of ADC values in different malignancies of the skeletal musculature: a multicentric analysis. Skeletal Radiol 2015;44:995–1000. [DOI] [PubMed] [Google Scholar]
- [5].Razek A, Nada N, Ghaniem M, et al. Assessment of soft tissue tumours of the extremities with diffusion echoplanar MR imaging. Radiol Med 2012;117:96–101. [DOI] [PubMed] [Google Scholar]
- [6].Modic MT, Masaryk TJ, Ross JS, et al. Imaging of degenertivae disk disease. Radiology 1988;168:177–86. [DOI] [PubMed] [Google Scholar]
- [7].Kjaer P, Leboeufyde C, Korsholm L, et al. Magnetic resonance imaging and low back pain in adults: a diagnostic imaging study of 40-year-old men and women. Spine (Phila Pa 1976) 2005;30:1173–80. [DOI] [PubMed] [Google Scholar]
- [8].Rahme R, Moussa R. The modic vertebral endplate and marrow changes: pathologic significance and relation to low back pain and segmental instability of the lumbar spine. AJNR Am J Neuroradiol 2008;29:838–42. [DOI] [PMC free article] [PubMed] [Google Scholar]
- [9].Hayashi T, Daubs MD, Suzuki A, et al. Motion characteristics and related factors of Modic changes in the lumbar spine. J Neurosurg Spine 2015;22:511–7. [DOI] [PubMed] [Google Scholar]
- [10].Sokov EL, Kornilova LE, Nesterov AI. Low back pain and Modic changes. Zh Nevrol Psikhiatr Im S S Korsakova 2017;117:99–105. [DOI] [PubMed] [Google Scholar]
- [11].Koivisto K, Jrvinen J, Karppinen J, et al. The effect of zoledronic acid on type and volume of Modic changes among patients with low back pain. BMC Musculoskelet Disord 2017;18:274. [DOI] [PMC free article] [PubMed] [Google Scholar]
- [12].Laudato PA, Bartanusz V. What is the role of surgery in low back pain associated with Modic changes? Rev Med Suisse 2017;13:1292–5. [PubMed] [Google Scholar]
- [13].Keller A, Boyle E, Skog TA, et al. Are Modic changes prognostic for recovery in a cohort of patients with non-specific low back pain? Eur Spine J 2012;21:418–24. [DOI] [PMC free article] [PubMed] [Google Scholar]
- [14].de Roos A, Kressel H, Spritzer C, et al. MR imaging of marrow changes adjacent to end plates in degenerative lumbar disk disease. AJR Am J Roentgenol 1987;149:531–4. [DOI] [PubMed] [Google Scholar]
- [15].Weishaupt D, Zanetti M, Boos N, et al. MR imaging and CT in osteoarthritis of the lumbar facet joints. Skeletal Radiol 1999;28:215–9. [DOI] [PubMed] [Google Scholar]
- [16].Zhou X, Liu Y, Zhou S, et al. The correlation between radiographic and pathologic grading of lumbar facet joint degeneration. BMC Med Imaging 2016;16:27. [DOI] [PMC free article] [PubMed] [Google Scholar]
- [17].Abdel Razek AA, Castillo M. Imaging appearance of primary bony tumors and pseudo-tumors of the spine. J Neuroradiol 2010;37:37–50. [DOI] [PubMed] [Google Scholar]
- [18].Toyone T, Takahashi K, Kitahara H, et al. Vertebral bone-marrow changes in degenerative lumbar disc disease. An MRI study of 74 patients with low back pain. J Bone Joint Surg Br 1994;76:757–64. [PubMed] [Google Scholar]
- [19].Teichtahl AJ, Urquhart DM, Wang J, et al. Lumbar disc degeneration is associated with modic change and high paraspinal fat content: a 3.0T magnetic resonance imaging study. BMC Musculoskelet Disord 2016;17:439. [DOI] [PMC free article] [PubMed] [Google Scholar]
- [20].Jensen TS, Kjaer P, Korsholm L, et al. Predictors of new vertebral endplate signal (Modic) changes in the general population. Eur Spine J 2010;19:129–35. [DOI] [PMC free article] [PubMed] [Google Scholar]
- [21].Kerttula L, Luoma K, Vehmas T, et al. Modic type I change may predict rapid progressive, deforming disc degeneration: a prospective 1-year follow-up study. Eur Spine J 2012;21:1135–42. [DOI] [PMC free article] [PubMed] [Google Scholar]
- [22].Weishaupt D, Zanetti M, Hodler J, et al. Painful lumbar disk derangement: relevance of endplate abnormalities at MR imaging. Radiology 2001;218:420–7. [DOI] [PubMed] [Google Scholar]
- [23].Karchevsky M, Schweitzer ME, Carrino JA, et al. Reactive endplate marrow changes: a systematic morphologic and epidemiologic evaluation. Skeletal Radiol 2005;34:125–9. [DOI] [PubMed] [Google Scholar]
- [24].Yu LP, Qian WW, Yin GY, et al. MRI assessment of lumbar intervertebral disc degeneration with lumbar degenerative disease using the Pfirrmann grading systems. PLoS One 2012;7:e48074. [DOI] [PMC free article] [PubMed] [Google Scholar]
- [25].Crock HV. Internal disc disruption. A challenge to disc prolapse fifty years on. Spine (Phila Pa 1976) 2015;11:650–3. [PubMed] [Google Scholar]
- [26].Li J, Muehleman C, Abe Y, et al. Prevalence of facet joint degeneration in association with intervertebral joint degeneration in a sample of organ donors. J Orthop Res 2011;29:1267–74. [DOI] [PMC free article] [PubMed] [Google Scholar]
- [27].Arana E, Kovacs FM, Royuela A. Modic changes and associated features in Southern European chronic low back pain patients. Spine J 2011;11:402–11. [DOI] [PubMed] [Google Scholar]
- [28].Hasegawa K, Shimoda H, Kitahara K, et al. What are the reliable radiological indicators of lumbar segmental instability? J Bone Joint Surg Br 2011;93:650–7. [DOI] [PubMed] [Google Scholar]