Abstract
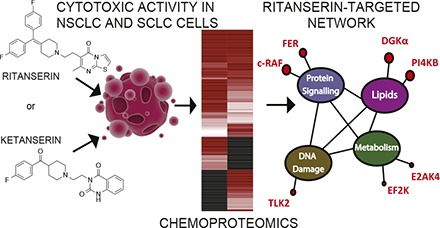
Ritanserin was tested in the clinic as a serotonin receptor inverse agonist but recently emerged as a novel kinase inhibitor with potential applications in cancer. Here, we discovered that ritanserin induced apoptotic cell death of non–small cell lung cancer (NSCLC) and small cell lung cancer (SCLC) cells via a serotonin-independent mechanism. We used quantitative chemical proteomics to reveal a ritanserin-dependent kinase network that includes key mediators of lipid [diacylglycerol kinase α, phosphatidylinositol 4-kinase β] and protein [feline encephalitis virus-related kinase, rapidly accelerated fibrosarcoma (RAF)] signaling, metabolism [eukaryotic elongation factor 2 kinase, eukaryotic translation initiation factor 2-α kinase 4], and DNA damage response [tousled-like kinase 2] to broadly kill lung tumor cell types. Whereas ritanserin exhibited polypharmacology in NSCLC proteomes, this compound showed unexpected specificity for c-RAF in the SCLC subtype, with negligible activity against other kinases mediating mitogen-activated protein kinase signaling. Here we show that ritanserin blocks c-RAF but not B-RAF activation of established oncogenic signaling pathways in live cells, providing evidence in support of c-RAF as a key target mediating its anticancer activity. Given the role of c-RAF activation in RAS-mutated cancers resistant to clinical B-RAF inhibitors, our findings may have implications in overcoming resistance mechanisms associated with c-RAF biology. The unique target landscape combined with acceptable safety profiles in humans provides new opportunities for repositioning ritanserin in cancer.
Introduction
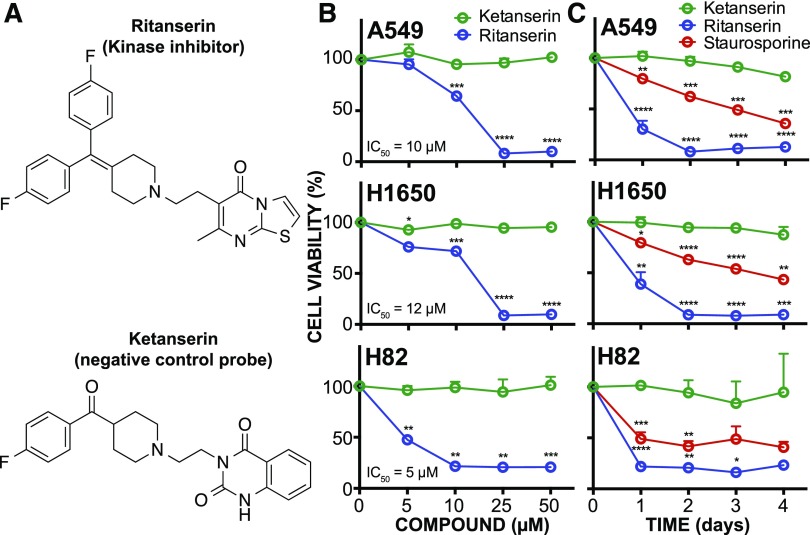
Ritanserin is a serotonin (5-hydroxytryptamine) receptor (5-HTR) inverse agonist with specificity for the serotonin receptor type 2 (5-HT2) subtype (Peng et al., 2018). As a drug candidate, ritanserin was tested for treatment of several neuropsychiatric disorders but never received approval for clinical use (Barone et al., 1986). Its oral bioavailability and lack of adverse side effects in humans have since prompted studies to explore ritanserin for clinical applications beyond serotonin signaling (Purow, 2015). Comparison of ritanserin with existing lipid kinase inhibitors revealed structural similarities that led to its discovery as an inhibitor of diacylglycerol kinase-α (DGKα) (Purow, 2015; Boroda et al., 2017) (Fig. 1A). We recently used quantitative chemical proteomics to discover ritanserin as an active-site inhibitor of DGKα and the nonreceptor tyrosine protein kinase feline encephalitis virus-related kinase (FER) (Franks et al., 2017; McCloud et al., 2018). Although they are distinct in substrate preference, DGKα (Sakane et al., 2007) and FER (Greer, 2002) are kinases related by their role in coupling receptor activation with intracellular signaling important for cell survival and proliferation. Thus, ritanserin is capable of perturbing cellular signaling through serotonin-independent mechanisms. We and others have proposed that ritanserin may have potential applications in oncology by disrupting regulatory pathways through its largely unexplored action against the kinase superfamily.
Fig. 1.
Ritanserin shows cytotoxic activity in lung tumor cells. (A) Ritanserin is a 5-HT2R inverse agonist with known activity against lipid (DGKα) and protein (FER) kinases. Ketanserin is a 5-HT2R inverse agonist that lacks DGKα/FER inhibitory activity and serves as a negative control. (B) Cell viability dose-response curves for NSCLC (A549, H1650) and SCLC (H82) tumor cells treated with ritanserin or ketanserin at the indicated concentrations for 2 days. (C) Time course of cell viability in tumor cells treated with 25 µM ritanserin, 25 µM ketanserin, or 1 µM staurosporine for 4 days. Staurosporine is a pan-kinase inhibitor and was included as a positive control of tumor cell death. All experiments were performed in triplicate and data are from two independent biologic replicates performed on separate days (n = 6). Statistical significance was calculated with respect to ketanserin treatment. Data are shown as means ± S.E.M. *P ≤ 0.05; **P ≤ 0.01; ***P ≤ 0.001; ****P ≤ 0.0001. 5-HT2R, 5-HT2 receptor.
In this study, we set out to define the target spectrum of ritanserin to better understand its mode of action in tumor cells. Previous reports demonstrated that ritanserin is cytotoxic against glioblastoma and melanoma through putative downstream targets of DGKα, including mammalian target of rapamycin (Dominguez et al., 2013), hypoxia-inducible factor 1-α (Dominguez et al., 2013), and geranylgeranyl transferase I (Olmez et al., 2018). We hypothesize that ritanserin’s cellular activity is mediated through blockade of kinase networks to explain its broad action against diverse tumor cell types. An advantage of multitargeted strategies is to minimize the potential for development of resistance mechanisms (Knight et al., 2010). We conducted cell viability assays to determine the impact of ritanserin treatments on survival of different lung cancer subtypes. We used quantitative chemoproteomics to determine the kinase targets of ritanserin in both non–small cell lung cancer (NSCLC) and small cell lung cancer (SCLC) proteomes. Our findings reveal that ritanserin shows novel activity against c-RAF (rapidly accelerated fibrosarcoma) in SCLC proteomes. The lack of activity against other kinases involved in mitogen-activated protein kinase (MAPK) signaling suggests that ritanserin mediates its cellular activity in SCLC cells at least in part through blockade of c-RAF.
Materials and Methods
Materials.
The desthiobiotin ATP acyl phosphate nucleotide probe was obtained from Thermo Fisher Scientific (PI88311; Waltham, MA). Ritanserin and ketanserin tartrate were purchased from Tocris Bioscience (Bristol, UK). WST-1 reagent kits were purchased from Cayman Chemical (Ann Arbor, MI). Trypan Blue was purchased from Thermo Fisher Scientific. CaspaseGlo Assay kits were purchased from Promega (Madison, WI). Phorbol 12-myristate 13-acetate (PMA) was purchased from Cayman Chemical.
WST-1 Cell Proliferation Assays.
Tumor cells were plated in transparent tissue-culture treated 96-well plates at a density of 100,000 cells/ml (A549, H1650) or 200,000 cells/ml (H82) in a volume of 100 µl per well. Cells were treated with dimethylsulfoxide (DMSO) vehicle or inhibitors dissolved in DMSO at the indicated concentrations (final DMSO concentration of 0.5%). Cells were allowed to grow for the indicated times at 37°C under 5% CO2. Afterward, equal parts of WST-1 developer reagent and electron mediator solution were mixed and 10 µl of the resulting solution (“WST-1 reagent”) was added to each well. Plates were shaken in an orbital shaker for 60 seconds and then returned to the incubator for 2 hours. Plates were again shaken, followed by measurement of absorbance at 450 nm. Data were normalized to DMSO-treated wells and significance values were determined with one-way analysis of variance (ANOVA).
Cell Counts.
Tumor cells were plated in 60-mm plates at a density of 100,000 cells/ml (A549, H1650) or 200,000 cells/ml (H82) and a volume of 3.5 ml/plate. Cells were treated with inhibitors at the indicated concentrations (final DMSO concentration of 0.5%) for 48 hours at 37°C under 5% CO2. After incubation, adherent cells were washed and detached with trypsin and all cells were collected and concentrated by spinning at 400g for 3 minutes, followed by aspiration of media. Cells were resuspended in 10 nM Trypan Blue and 10 µl of this solution was counted via a hemocytometer. Dead cells were excluded from all counts. Data were normalized to DMSO-treated wells and significance values were determined with one-way ANOVA.
CaspaseGlo Assays.
Assays were performed as directed by the manufacturer (Promega). Briefly, tumor cells were plated in black tissue-culture treated transparent-bottom 96-well plates at a density of 200,000 cells/ml (A549, H1650) or 400,000 cells/ml (H82) in a volume of 50 µl/well. Cells were treated with inhibitors at the indicated concentrations (final DMSO concentration of 0.5%) for 24 hours at 37°C under 5% CO2. Afterward, 50 µl of the prepared CaspaseGlo reagent was added to each well. The reaction was allowed to proceed at 37°C under 5% CO2 for 1 hour, at which point the cells were shaken in an orbital shaker at 500 rpm for 60 seconds and then luminescence was read for each well. Data were normalized to DMSO-treated wells and significance values were determined with one-way ANOVA.
Liquid Chromatography–Mass Spectrometry Analysis of Stable Isotope Labeling with Amino Acids in Cell Culture Samples Using ATP Acyl Phosphates.
Quantitative chemoproteomics was performed as previously described (Franks et al., 2017; McCloud et al., 2018).
Phospho–Mitogen-Activated Protein Kinase Kinase Assay of RAF Activity.
Human embryonic kidney 293 T (HEK293T) cells were grown and transiently transfected with c-RAF plasmid as previously described (Franks et al., 2017) and allowed to grow for 48 hours after transfection. c-RAF plasmid (pCSF107mT-cRAF-FLAG) was generated by recombination of the Addgene plasmids using the Gateway cloning system (Invitrogen, Carlsbad, CA) as previously described (Franks et al., 2017). Recombinant RAF-HEK293T cells were pretreated with DMSO vehicle or inhibitors at the indicated concentrations for 1 hour, followed by the addition of PMA (20 ng/ml) for an additional 20 minutes at 37°C. Cells were harvested for Western blots and phospho–mitogen-activated protein kinase kinase (MEK) was detected using rabbit anti–phospho-MEK antibody (S217/S221; Cell Signaling Technology, Danvers, MA) followed by goat anti-rabbit Dylight 550 secondary antibody (Thermo Scientific) for fluorescence detection. Western blot measurement of MEK (rabbit anti-MEK1/2; Cell Signaling Technology) was included to evaluate protein loading between samples.
Computational Methods.
Data for A549 and H82 cell lines were searched with IP2 software (Integrated Proteomics Applications, San Diego, CA) and manually validated using the methods previously described (Franks et al., 2017). Data for desthiobiotin-tagged ATP acyl phosphate probes and ATP competitive peptides were compared and clustered. Ritanserin and ketanserin inhibition profiles were compared using stable isotope labeling with amino acids in cell culture (SILAC) ratios and normalized to DMSO. The kinase profiles were displayed as a heatmap and clustered with hierarchical clustering using R software (R Project for Statistical Computing, Vienna, Austria) with the d3heatmaps package (https://blog.rstudio.org/2015/06/24/d3heatmap/) as previously described (Franks et al., 2017).
Lipid Kinase Phylogenetic Tree.
A phylogenetic tree of human lipid kinases was generated using MUSCLE multiple sequence alignment (Edgar, 2004) of annotated lipid kinases and a least-squared distance method for determining evolutionary distance (Supplemental Fig. 1). Calculations were conducted using the EMBOSS software suite (Rice et al., 2000).
Statistical Analysis and Determination of IC50 Values.
For all cell viability measurements, results were normalized to values obtained from DMSO-treated cells. For CaspaseGlo assays, raw luminescence values are reported. All significance values for cell viability and CaspaseGlo assays were calculated with one-way ANOVA and the Dunnett multiple-comparisons test (post hoc analysis). IC50 values were calculated using a four-parameter logistic model of the response curve. All data are shown as means ± S.E.M. All statistical analyses were performed using GraphPad Prism software (GraphPad Software Inc., La Jolla, CA).
Results
Ritanserin Shows Serotonin-Independent Cytotoxic Activity in Lung Tumor Cells.
We chose H1650 and A549 as our NSCLC cell models to evaluate the sensitivity of cells with different genetic backgrounds to ritanserin exposure. H1650 cells express epidermal growth factor receptors (EGFRs) containing activating mutations in the kinase domain (exon 19 deletion E746-A750) of this receptor tyrosine kinase. A549 cells express wild-type EGFR but harbor mutant KRAS (G12S). We also included H82 cells in our studies to evaluate ritanserin activity in SCLC. The mutational backgrounds of cell lines used in this study are listed in Supplemental Table 1. Ketanserin (Boroda et al., 2017; Franks et al., 2017) was used alongside ritanserin to control for potential 5-HT2 receptor inverse agonist activity and other nonspecific pharmacological effects in our cell biology (Fig. 1A).
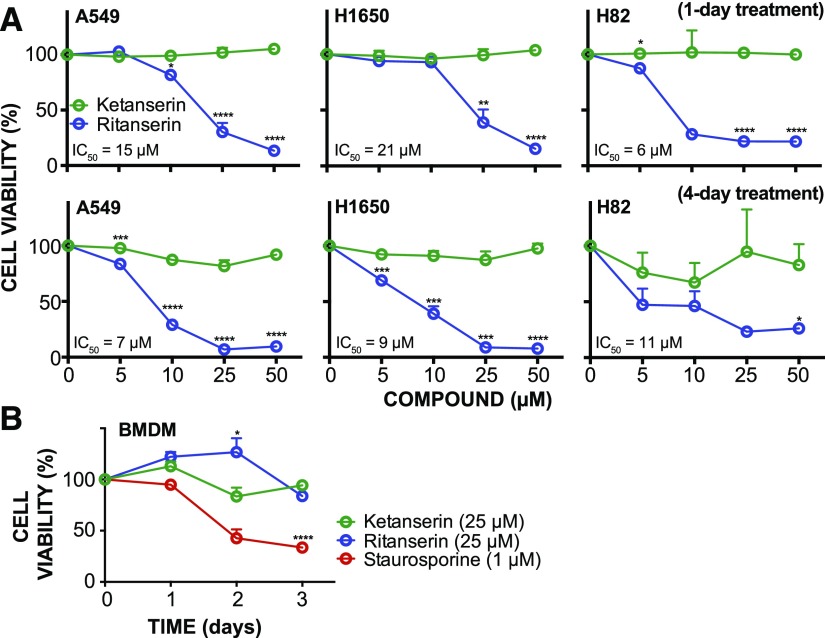
Cells were treated with varying ritanserin concentrations (5–50 µM) and cell viability was measured using established WST-1 metabolic assays (Kepp et al., 2011). We observed concentration-dependent decreases in viability in cells exposed to ritanserin but not ketanserin treatments (Figs. 1B and 2A). At a moderate concentration of ritanserin (25 µM), we observed >70% blockade of cell proliferation across all NSCLC and SCLC lines tested (Fig. 1B). At lower concentrations (5 µM), ritanserin showed enhanced cytotoxicity against the SCLC H82 cells (approximately 50% cell death) compared with NSCLC cells (approximately 5%–15% cell death for A549 and H1650 cells; Fig. 1B). Cell killing with ritanserin was rapid, with >50% of cell death occurring after 1 day and near-maximal cytotoxicity after 2 days of treatment in all cell lines tested (25 µM dose; Fig. 1C). The lack of activity using ketanserin under the same treatment conditions supports a serotonin-independent mechanism of cytotoxicity for ritanserin (Figs. 1, B and C, and 2A). In contrast to the pan-kinase inhibitor staurosporine, which showed general cytotoxicity across all cells tested (Figs. 1C and 2B), ritanserin demonstrated negligible cell killing against noncancerous primary cells at high concentrations (25 µM; Fig. 2B).
Fig. 2.
Ritanserin activity in lung tumor cells. (A) Lung cancer cell viability (%) at 1 and 4 days after treatment with compounds at the indicated concentrations as determined by the WST-1 metabolic assay. (B) Time course of cell metabolic activity (WST-1 assay) of primary bone marrow–derived macrophages treated with 1 µM staurosporine, 25 µM ritanserin, or 25 µM ketanserin. All experiments were performed in triplicate and data are from two independent biologic replicates performed on separate days (n = 6). Statistical significance was determined by comparison with ketanserin treatment (negative control) at the same concentration and treatment time. Cell viability shown is normalized to vehicle-treated samples. Data are shown as means ± S.E.M. *P ≤ 0.05; **P ≤ 0.01; ***P ≤ 0.001; ****P ≤ 0.0001. BMDM, bone marrow–derived macrophage.
We performed a separate cell biology assay comparing the effects of serotonin, ritanserin, and ketanserin treatments on global protein kinase C (PKC) and protein kinase A (PKA) activity in A549 and H82 cells (Supplemental Fig. 2A). PKC and PKA are downstream mediators of 5-HT receptors (5-HTRs), and global changes in substrate phosphorylation profiles of either enzyme would allow evaluation of compound activity on 5-HTR signaling. We observed negligible changes in PKC and PKA substrate phosphorylation between cell treatment conditions (serotonin, 10 µM; ritanserin and ketanserin, 25 µM; Supplemental Fig. 2B). In contrast, treatment with PMA, a known PKC activator, resulted in moderate increases in PKC substrate phosphorylation, which matches previous reports using this same assay (Boroda et al., 2017). The consistent lack of 5-HTR activity with equivalent doses of ritanserin and ketanserin further supports that ritanserin effects observed in cellular assays are serotonin independent. Collectively, our results show that ritanserin is not generally cytotoxic but displays potent cell killing of the NSCLC and SCLC cells tested.
Ritanserin Activates Apoptotic Cell Death of Broad Lung Tumor Cell Types.
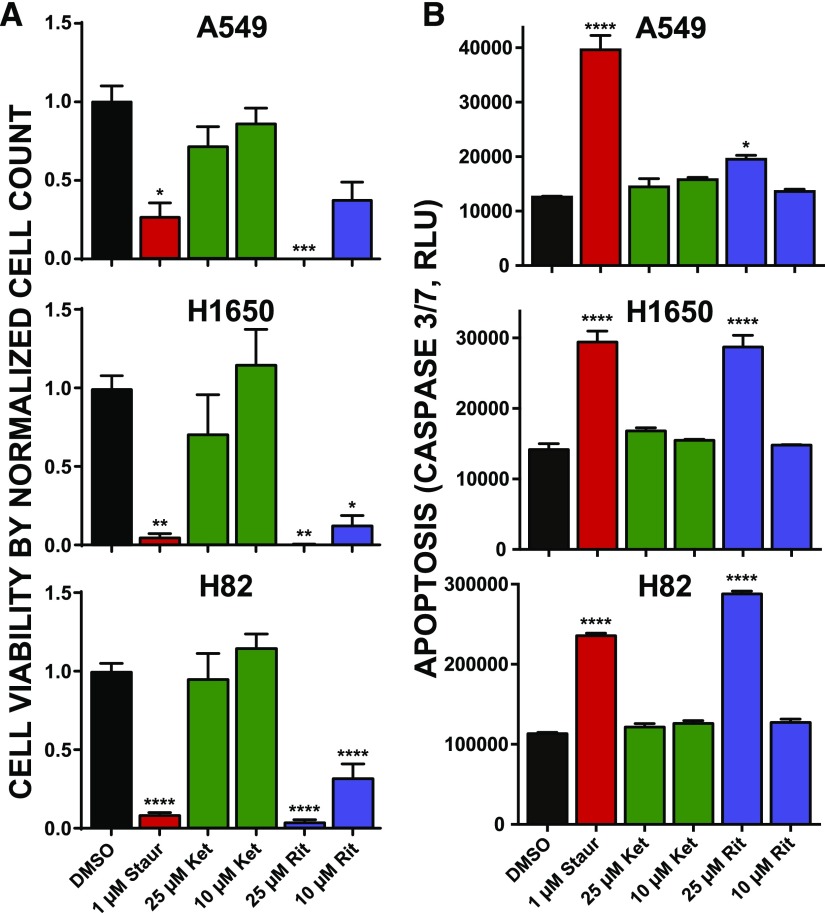
Since changes in cell metabolism can occur from nonlethal perturbations (Kepp et al., 2011), we also used live cell counts to further support cytotoxicity of lung cancer cells using ritanserin. Akin to results from cell viability assays, we observed substantial cell killing across all lung cancer cell lines exposed to ritanserin but not ketanserin (Fig. 3A). We observed potent cell killing (approximately 70%) even at the lower dose tested (10 µM; Fig. 3A). Next, we measured caspase activity in treated cells to determine whether ritanserin mediates cell killing through activation of apoptosis. Cells treated with ritanserin showed statistically significant (P < 0.05) enhanced caspase 3/7 activity after 24 hours compared with vehicle controls (Fig. 3B). Caspase activation by ritanserin was specific because ketanserin treatments under the same experimental conditions did not induce these effects (Fig. 3B). We compared ritanserin effects directly with staurosporine, which served as a positive control based on previous reports of activating apoptosis in treated lung cancer cells (Bartling et al., 2004; Wang et al., 2009). In both H1650 and H82 cells, we observed comparable activation of caspase 3/7 activity compared with staurosporine (Fig. 3B). Although ritanserin treatment of A549 cells resulted in a lower degree of activation, the increase in caspase 3/7 activity was statistically significant compared with vehicle-treated cells (P = 0.01; Fig. 3B). In summary, our cell viability and caspase activation data support ritanserin-mediated activation of apoptotic cell death in lung cancer cells that differ in mutation status (EGFR, KRAS) and subtype (NSCLC vs. SCLC).
Fig. 3.
Ritanserin treatments activate apoptosis in NSCLC and SCLC tumor cells. (A) Cell viability as measured by Trypan Blue cell counts after treatment with staurosporine, ketanserin, or ritanserin at the indicated concentrations for 2 days. Cell counts were normalized to the vehicle control (DMSO). Statistical significance was calculated by comparison with 10 µM ketanserin treatment. (B) Activation of apoptosis was determined by the commercial CaspaseGlo 3/7 assay (see Materials and Methods for additional details). Cells were incubated with compounds at the concentrations given and allowed to grow for 1 day, at which point caspase activity was measured. Statistical significance was calculated by comparison with vehicle control. All experiments were performed in triplicate and data are from two independent biologic replicates performed on separate days (n = 6). Data are shown as means ± S.E.M. *P ≤ 0.05; **P ≤ 0.01; ***P ≤ 0.001; ****P ≤ 0.0001. Ket, ketanserin; Rit, ritanserin; Staur, staurosporine.
Chemoproteomic Kinome Profiling of Ritanserin Action in Lung Tumor Cell Proteomes.
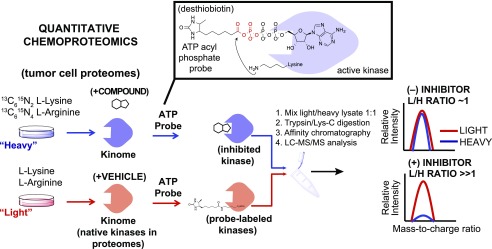
Based on previous chemical proteomic analyses (Franks et al., 2017; McCloud et al., 2018), we hypothesized that ritanserin is functioning as a kinase inhibitor to mediate cytotoxicity in our lung cancer cell studies. Since A549 and H1650 displayed similar sensitivities to ritanserin in our cell viability assays, we selected A549 and H82 for chemical proteomic evaluation of ritanserin targets in NSCLC and SCLC proteomes, respectively. We used desthiobiotin-tagged, ATP acyl phosphates (Patricelli et al., 2007, 2011; Shin et al., 2018) to measure selectivity of compounds against native kinases detected in lung cancer proteomes. ATP acyl phosphate probes permit global profiling of kinase activities by covalent attachment of reporter tags to conserved lysines in the ATP-binding site of protein/lipid kinases as well as other ATP-binding proteins (Patricelli et al., 2007, 2011; Franks et al., 2017; McCloud et al., 2018; Shin et al., 2018). For these studies, NSCLC and SCLC cells were cultured in media containing isotopically light and heavy amino acids to enable quantitative chemical proteomics (Hsu et al., 2013; Nagano et al., 2013; Chang et al., 2015) by SILAC (Fig. 4). Light and heavy cell proteomes were treated with DMSO vehicle or compound, respectively, prior to addition of desthiobiotin-tagged ATP acyl phosphate to label active-site lysines. After probe labeling, light and heavy proteomes were combined, digested with trypsin protease, and desthiobiotin-modified peptides enriched by avidin affinity chromatography and analyzed by LC-MS/MS to identify and quantify isotopically tagged active-site peptides from native kinases as previously described (Franks et al., 2017; McCloud et al., 2018) and depicted in Fig. 4.
Fig. 4.
Quantitative chemoproteomics to define the target spectrum of ritanserin in tumor cell proteomes. Proteomes from lung tumor cells cultured in SILAC media are treated differentially with DMSO vehicle (light) or compound (heavy). Next, the ATP acyl phosphate probe is added to both light and heavy proteomes to label active kinase via covalent modification of conserved lysines in kinase active sites. Proteomes are digested to tryptic peptides using proteases. Active-site probe-labeled peptides are enriched by avidin affinity chromatography and quantified by LC-MS/MS. SILAC (light/heavy) ratios are used to evaluate compound activity at individual kinase active sites. No inhibition results in a SILAC ratio of approximately 1, whereas competition at respective kinase active sites blocks probe labeling and enrichment, resulting in SILAC ratios >>1 to identify targets of small molecule inhibitors. H, heavy; L, light.
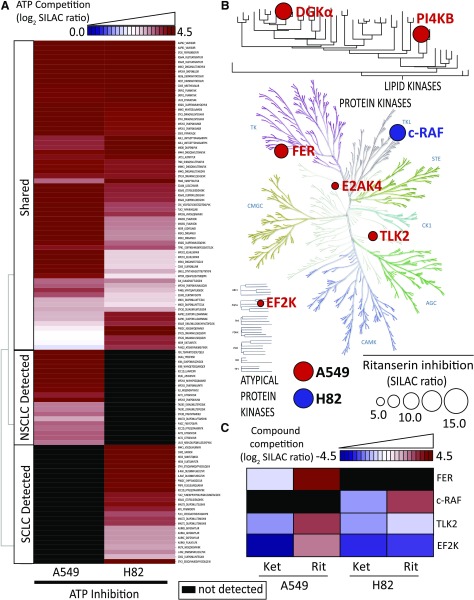
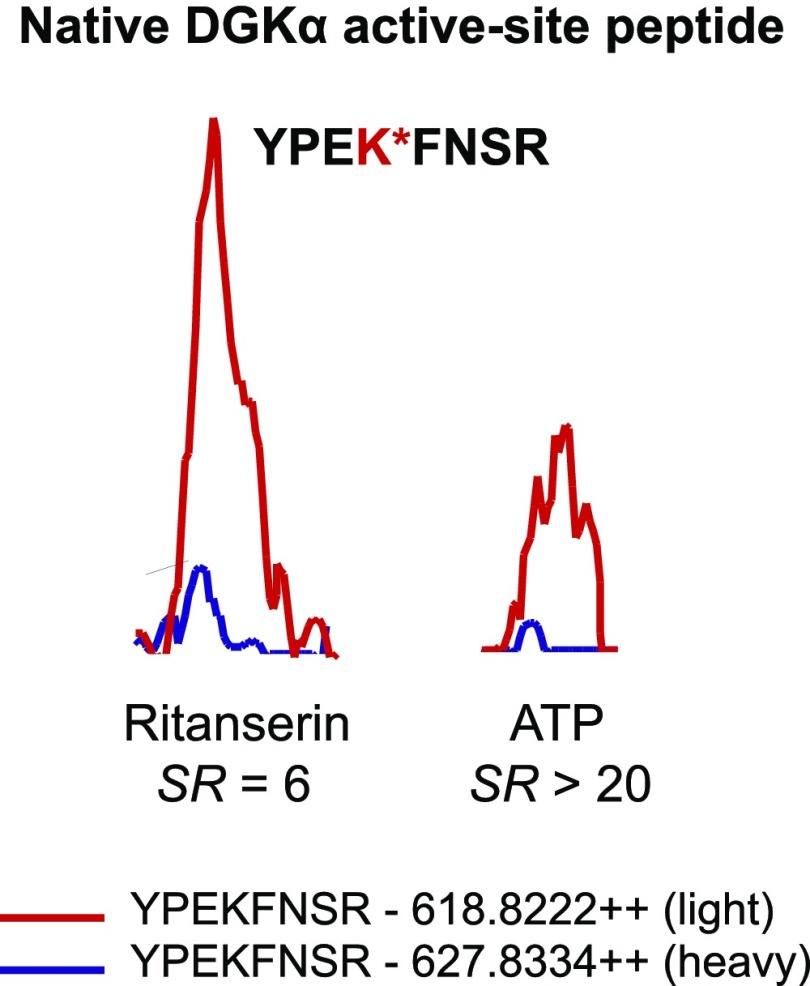
Using our quantitative chemical proteomics assay, we compared kinase activity profiles between A549 and H82 cell proteomes. Kinases included in our comparisons showed potent competition with free ATP [SILAC ratios (SRs) ≥5; Fig. 5A]. The latter criterion was important to distinguish specific probe binding at ATP-binding sites versus nonspecific labeling of surface lysines. We detected approximately 120 unique probe-modified peptides from approximately 110 distinct kinases. Using ATP competition profiles, we separated kinases into groups detected in both proteomes (shared) or detected in either A549 (NSCLC) or H82 (SCLC) samples (Fig. 5A; Supplemental Table 1). Specifically, we observed probe-dependent detection of several kinases (AKT1/2/3 and inhibitor of nuclear factor κ-B kinase subunit α) in A549 proteomes that are associated with phosphatidylinositol 3-kinase (PI3K)/AKT signaling (Agarwal et al., 2005) (Fig. 5A; Supplemental Table 1). These findings are consistent with enhanced PI3K/AKT signaling in NSCLC subtypes containing KRAS mutations (Castellano et al., 2013). Finally, we detected native DGKα activity in A549 proteomes (Fig. 6 shows MS1 data for DGKα peptide), which may indicate a potential role for diacylglycerol and phosphatidic acid metabolism/signaling in these NSCLC cells.
Fig. 5.
Target landscape of ritanserin in lung cancer kinomes. (A) Heatmap showing average log2 SILAC ratios of ATP competition at kinase active sites detected in A549 and H82 cell proteomes. (B) Kinome tree showing proteins with SILAC ratios ≥4 when treated with ritanserin. The size of the circle is proportional to SILAC ratio measured. The background image for protein kinase tree used by permission of Cell Signaling Technology (http://www.cellsignal.com). The lipid kinase tree was generated in-house using least-squared distances of MUSCLE aligned sequences (see Supplemental Fig. 1). (C) Heatmap showing log2 SILAC ratios for kinases inactivated by ritanserin but not ketanserin that have a minimum DMSO/ritanserin SILAC ratio ≥4. All experiments were measured two to three times (technical replicates in LC-MS) using data from two to three independent biologic replicates performed on separate days (n = 6–9). All values shown are normalized to the DMSO control and can be found in Supplemental Table 1. AGC, cyclic-nucleotide-dependent family; CAMK, calcium/calmodulin modulated family; CK1, casein kinase 1 like family; CMGC, cyclin-dependent kinases (CDKs), mitogen-activated protein kinases (MAP kinases), glycogen synthase kinases (GSK) and CDK-like kinases; E2AK4, eukaryotic translation initiation factor 2-α kinase 4; EF2K, eukaryotic elongation factor 2 kinase; Ket, ketanserin; PI4KB, phosphatidylinositol 4-kinase β; Rit, ritanserin; STE, homologous to the yeast STE7, STE11 and STE20 genes; TK, tyrosine kinase family; TLK2, tousled-like kinase 2.
Fig. 6.
Detection and inhibition of native DGKα in A549 proteomes. MS1-extracted ion chromatograms of the probe-labeled active-site peptide of DGKα. Pretreatment of heavy A549 proteomes with ritanserin (100 µM) or ATP (1 mM) resulted in inhibition of DGKα active-site peptide probe labeling (ritanserin SR = 6; ATP SR > 20). All experiments were measured three times (technical replicates in LC-MS) using data from three independent biologic replicates performed on separate days (n = 9). Peak images are a representative image from an individual injection.
A similar analysis of SCLC kinase profiles revealed enrichment of kinases involved in RAF signaling (A-RAF, B-RAF, and c-RAF; Sanclemente et al., 2018) as well as DNA damage response (ataxia telangiectasia and Rad3-related protein, checkpoint kinase 2, DNA-dependent protein kinase catalytic subunit, and tousled-like kinase 2; Blackford and Jackson, 2017) (Fig. 5A; Supplemental Table 1). These findings support previous reports that c-RAF is one of several proto-oncogenes that are highly expressed in SCLC cells and tumor tissues (Graziano et al., 1991). Collectively, our kinase profiling studies establish a global map of kinase activities detected in A549 and H82 proteomes, including discovery of kinases that appear enriched in NSCLC compared with SCLC subtypes.
Chemoproteomic Profiling Reveals c-RAF as a Principal Target of Ritanserin in SCLC Proteomes.
Next, we used our competitive ATP probe assay to determine the kinase targets of ritanserin in A549 and H82 proteomes (Fig. 5B). Ketanserin was included in our LC-MS studies to discern ritanserin-specific from general nonspecific activity of 5-HT2 receptor inverse agonists against the kinome. We chose to test inhibitor concentrations (100 µM) 10-fold higher than required for potent cell killing (10 µM; Fig. 3A) to account for potential shifts in the potency of reversible inhibitors due to irreversible labeling kinetics of the ATP acyl phosphate probe (Patricelli et al., 2011). Kinase targets of ritanserin were defined as those active-site peptides that showed SILAC ratios ≥4. As expected based on previous findings (Franks et al., 2017), we detected potent inhibition of FER and DGKα in A549 proteomes with ritanserin treatments (FER, SR = 9; DGKα, SR = 6) (Fig. 6; Supplemental Table 1). We identified an additional lipid kinase target, phosphatidylinositol 4-kinase β, in A549 proteomes, which is involved in modulating lipid-mediated PI3K/AKT signaling in tumor cells (Morrow et al., 2014). In addition to signaling, ritanserin treatment perturbed kinases implicated in glycolysis (eukaryotic elongation factor 2 kinase; Cheng et al., 2016), amino acid metabolism (eukaryotic translation initiation factor 2-α kinase 4; Ye et al., 2010), and DNA damage response (tousled-like kinase 2; Kim et al., 2016).
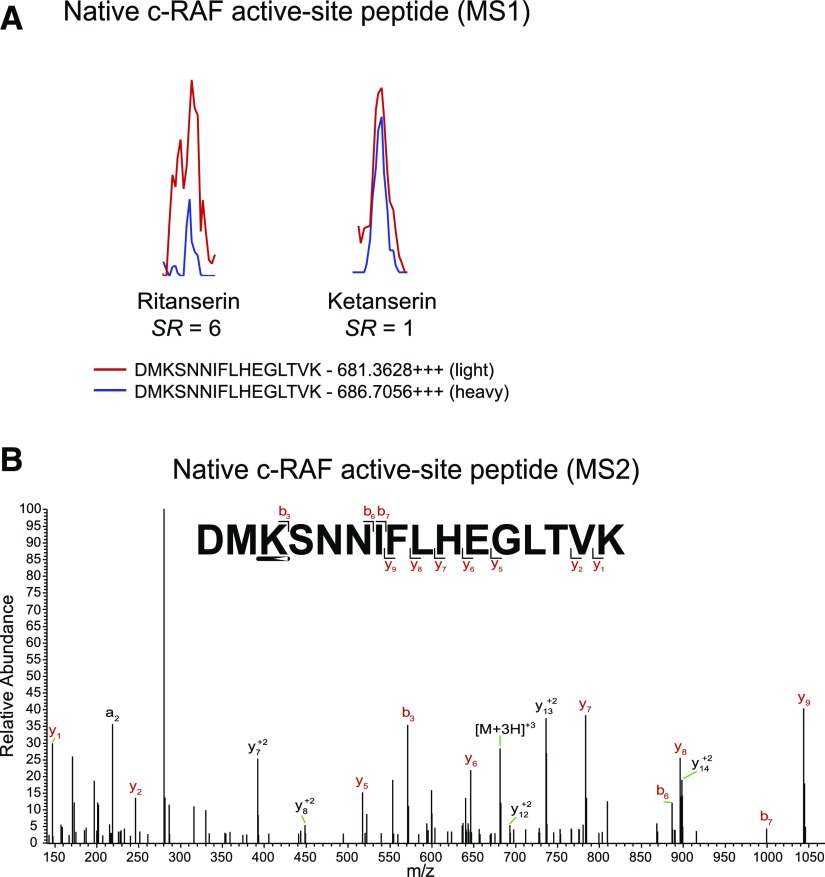
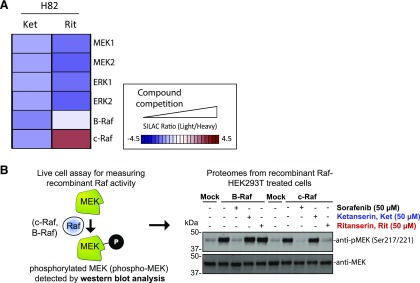
In contrast to polypharmacology observed in A549 proteomes, we identified c-RAF as the primary target of ritanserin in H82 proteomes (Fig. 5, B and C; Fig. 7 shows MS1 and MS2 data for c-RAF peptide). Ketanserin treatments did not perturb activity of key kinases involved in metabolism and signaling (Fig. 5C). Since c-RAF is a key regulator of the MAPK pathway, we also measured activity of ritanserin against other MAPK targets in H82 SCLC proteomes, including B-RAF, MAPK (extracellular signal-regulated kinases ERK1 and ERK2), and MAP2K (MEK1 and MEK2) kinases. We show that ritanserin shows selective perturbation of c-RAF compared with other MAPK mediators in H82 proteomes (Fig. 8A). Collectively, our findings reveal (to our knowledge, for the first time) a ritanserin-targeted lipid/protein kinase network involved in signaling, metabolism, and stress responses that help explain its broad antiproliferative activity in lung tumor cells. In addition, we demonstrate that ritanserin shows selective blockade of c-RAF compared with other MAPK kinases in H82 SCLC proteomes.
Fig. 7.
Native c-RAF active-site peptide detected in H82 proteomes. (A) MS1-extracted ion chromatograms of the probe-labeled active-site peptide for c-RAF identified in H82 proteomes. Pretreatment of heavy H82 proteomes with ritanserin (100 µM) results in blockade of c-RAF active-site probe labeling (SR > 6). Pretreatment with ketanserin (100 µM) results in no inhibition (SR = 1). (B) MS2 spectra of probe-modified peptide corresponding to the active site of c-RAF. Major b- and y-ion fragments derived from neutral losses of the precursor (M) are shown in red in the spectrum. All experiments were measured two to three times (technical replicates in LC-MS) using data from two independent biologic replicates performed on separate days (n = 6). (A) and (B) are representative images from a single measurement. m/z, mass-to-charge ratio.
Fig. 8.
Activity of ritanserin against kinases involved in MAPK signaling. (A) Activity of ritanserin against native kinases involved in MAPK signaling as evaluated by quantitative chemoproteomics described in Figs. 4 and 5. The results show that in H82 SCLC proteomes, ritanserin shows selective blockade of c-RAF compared with other MAPK kinases detected. Ketanserin show negligible activity, which supports serotonin-independent and ritanserin-specific effects. (B) Live cell activity assay to validate c-RAF as a target of ritanserin. RAF kinases (c-RAF and B-RAF) phosphorylate MEK, and phospho-MEK (S217/S221; approximately 40 kDa) can be used to measure RAF activity in live cells by Western blot (anti–phospho-MEK antibody). HEK293T cells overexpressing recombinant c-RAF or B-RAF were pretreated with DMSO vehicle or inhibitors (50 μM), followed by activation of cells with PMA (20 ng/mL, 20 minutes). Cells were lysed and proteomes were subjected to Western blots to measure endogenous phospho-MEK. Overexpression of c-RAF and B-RAF resulted in enhanced phospho-MEK levels. Pretreatment with the pan-RAF inhibitor sorafenib blocked c-RAF– and B-RAF–mediated enhancement of phospho-MEK. In contrast, ritanserin showed inhibition of c-RAF but not B-RAF in overexpressing cells. Ketanserin was largely inactive in this assay. Blots shown are representative of two independent biologic replicates (n = 2). Protein loading was comparable between sample conditions, as evidenced by equivalent MEK levels measured (anti-MEK blot). Ket, ketanserin; Rit, ritanserin.
Ritanserin Blocks c-RAF But Not B-RAF Activation of MEK Signaling in Live Cells.
Our chemoproteomic studies identified c-RAF as a potential target mediating ritanserin antitumor activity. Here, we sought to test whether ritanserin blocked c-RAF signaling pathways relevant for its antitumor activity. RAFs are part of the MAPK pathway involved in the regulation of cellular responses to external signals (Seger and Krebs, 1995; Lewis et al., 1998; Pearson et al., 2001). Growth factors and mitogens trigger activation of receptor tyrosine kinases that mediate GTP loading of the RAS GTPase (Simanshu et al., 2017). GTP-loaded RAS activate RAFs (A-RAF, B-RAF, and c-RAF) via recruitment to the cell membrane. Activated RAFs phosphorylate and activate MEK (MEK1 and MEK2), which phosphorylates and activates ERK (ERK1 and ERK2) as part of a signaling cascade to modulate cell proliferation, differentiation, apoptosis, and migration in cancer (Dhillon et al., 2007).
To directly measure c-RAF–mediated MEK phosphorylation in live cells, we overexpressed recombinant c-RAF in HEK293T cells, activated cells with PMA (Griner and Kazanietz, 2007), and measured the resulting levels of phosphorylated MEK1/2 (phospho-MEK) by Western blots (Fig. 8B). We also overexpressed recombinant B-RAF to directly compare specificity of ritanserin activity against the various RAF isoforms. Both c-RAF and B-RAF overexpression resulted in substantially enhanced phospho-MEK levels compared with non-overexpressed (mock) counterparts (Fig. 8B). Pretreatment of cells with ritanserin (50 µM) resulted in substantial blockade of recombinant c-RAF but not B-RAF signaling activity, as judged by reductions in phospho-MEK levels (Fig. 8B). Ketanserin did not produce the same effects as ritanserin, which supports ritanserin-specific effects in our assay. The RAF inhibitor sorafenib (Wu et al., 2015) was used as a positive control to demonstrate blockade of both recombinant c-RAF– and B-RAF–mediated increases in phospho-MEK levels. Taken together, our results demonstrate that ritanserin specifically blocks c-RAF activity in MAPK signaling pathways known to be important for tumor cell biology (Dhillon et al., 2007).
Discussion
Here, we provide evidence that ritanserin functions as a lipid and protein kinase inhibitor with broad action against diverse lung cancer types that is serotonin-independent. Using quantitative chemical proteomics, we discovered that ritanserin targets a kinase network in A549 proteomes (Fig. 5B), which suggests polypharmacology as a likely mode of action in A549 and potentially other NSCLC cells (including H1650). Despite promiscuous activity in the kinome, ritanserin was not cytotoxic in noncancerous primary cells (Fig. 2B), which is likely due to differences in cell metabolism and signaling between tumor and noncancerous cells, as previously reported for ritanserin in glioblastoma (Dominguez et al., 2013); further investigations are needed to determine whether ritanserin can specifically kill lung tumor cells in vivo.
A surprising finding from our studies was the identification of c-RAF as the primary target for ritanserin in H82 SCLC proteomes (Figs. 5 and 8). Recent studies demonstrated that loss of c-RAF activity resulted in tumor regression of aggressive K-RAS–driven cancers with reduced systemic toxicity because canonical MAPK signaling is unaffected (Sanclemente et al., 2018). Our chemoproteomic (Fig. 5) and cell biology (Fig. 8) studies show ritanserin specificity for blockade of c-RAF versus B-RAF activity. Thus, our findings position ritanserin as a novel scaffold for future medicinal chemistry efforts to develop potent and selective c-RAF inhibitors. The utility of targeting c-RAF in the clinic extends beyond studies of lung cancers. For example, clinical efficacy of B-RAF inhibitors in RAS-mutated cancers is limited by resistance through paradoxical activation (Hatzivassiliou et al., 2010; Heidorn et al., 2010; Poulikakos et al., 2010). Drugs that selectively block B-RAF drive B-RAF binding to c-RAF in a RAS-dependent manner, c-RAF activation, and consequent elevations in MEK and ERK signaling. Future studies are needed to determine whether ritanserin can be used to overcome resistance mechanisms associated with c-RAF activation.
We recognize that our selectivity profiling studies have been performed in lysates, and development of new activity-based probes for live cell profiling will be critical to fully understand the mechanism of action of ritanserin in future studies. Nonetheless, we identify a novel anticancer activity for ritanserin along with clinically relevant kinase targets like c-RAF that, coupled with its safety profiles in humans, should prove valuable for potential drug repurposing in cancer.
Acknowledgments
We thank all members of the Hsu laboratory and colleagues at the University of Virginia for review of the manuscript. We also thank Mark M. Ross for assistance with MS experiments and data analysis. We thank Kwon-Sik Park for kindly providing lung tumor cell lines.
Abbreviations
- 5-HTR
5-hydroxytryptamine receptor
- 5-HT2
serotonin receptor type 2
- ANOVA
analysis of variance
- DGKα
diacylglycerol kinase α
- DMSO
dimethylsulfoxide
- EGFR
epidermal growth factor receptor
- ERK
extracellular signal-regulated kinase
- FER
feline encephalitis virus-related kinase
- HEK293T
human embryonic kidney 293 T
- LC-MS
liquid chromatography-mass spectrometry
- MAPK
mitogen-activated protein kinase
- MEK
mitogen-activated protein kinase kinase
- MS
mass spectrometry
- NSCLC
non–small cell lung cancer
- PI3K
phosphatidylinositol 3-kinase
- PKA
protein kinase A
- PKC
protein kinase C
- PMA
phorbol 12-myristate 13-acetate
- RAF
rapidly accelerated fibrosarcoma
- SCLC
small cell lung cancer
- SILAC
stable isotope labeling with amino acids in cell culture
- SR
SILAC ratio
Authorship Contributions
Participated in research design: Campbell, Franks, Borne, Hsu.
Conducted experiments: Campbell, Franks, Borne, Shin, Zhang.
Performed data analysis: Campbell, Franks, Borne, Hsu.
Wrote or contributed to the writing of the manuscript: Campbell, Franks, Borne, Hsu.
Footnotes
This work was supported by the University of Virginia [Startup Funds (to K.-L.H.)], the National Institutes of Health National Institute on Drug Abuse [Grants DA035864 and DA043571 (to K.-L.H.)], the National Institutes of Health National Institute of General Medical Sciences [Grant T32-GM007055 (to C.E.F.)], the National Institutes of Health National Cancer Institute [Grant T32-CA009109 (to A.L.B. and S.T.C.)], the Schiff Foundation [Brain Tumor Research Award (to K.-L.H.)], and the U.S. Department of Defense [Grant W81XWH-17-1-0487 (to K.-L.H.)].
 This article has supplemental material available at molpharm.aspetjournals.org.
References
- Agarwal A, Das K, Lerner N, Sathe S, Cicek M, Casey G, Sizemore N. (2005) The AKT/I kappa B kinase pathway promotes angiogenic/metastatic gene expression in colorectal cancer by activating nuclear factor-kappa B and beta-catenin. Oncogene 24:1021–1031. [DOI] [PubMed] [Google Scholar]
- Barone JA, Bierman RH, Cornish JW, Hsuan A, Drake ND, Colaizzi JL. (1986) Safety evaluation of ritanserin--an investigational serotonin antagonist. Drug Intell Clin Pharm 20:770–775. [DOI] [PubMed] [Google Scholar]
- Bartling B, Yang JY, Michod D, Widmann C, Lewensohn R, Zhivotovsky B. (2004) RasGTPase-activating protein is a target of caspases in spontaneous apoptosis of lung carcinoma cells and in response to etoposide. Carcinogenesis 25:909–921. [DOI] [PubMed] [Google Scholar]
- Blackford AN, Jackson SP. (2017) ATM, ATR, and DNA-PK: the trinity at the heart of the DNA damage response. Mol Cell 66:801–817. [DOI] [PubMed] [Google Scholar]
- Boroda S, Niccum M, Raje V, Purow BW, Harris TE. (2017) Dual activities of ritanserin and R59022 as DGKα inhibitors and serotonin receptor antagonists. Biochem Pharmacol 123:29–39. [DOI] [PMC free article] [PubMed] [Google Scholar]
- Castellano E, Sheridan C, Thin MZ, Nye E, Spencer-Dene B, Diefenbacher ME, Moore C, Kumar MS, Murillo MM, Grönroos E, et al. (2013) Requirement for interaction of PI3-kinase p110α with RAS in lung tumor maintenance. Cancer Cell 24:617–630. [DOI] [PMC free article] [PubMed] [Google Scholar]
- Chang JW, Zuhl AM, Speers AE, Niessen S, Brown SJ, Mulvihill MM, Fan YC, Spicer TP, Southern M, Scampavia L, et al. (2015) Selective inhibitor of platelet-activating factor acetylhydrolases 1b2 and 1b3 that impairs cancer cell survival. ACS Chem Biol 10:925–932. [DOI] [PMC free article] [PubMed] [Google Scholar]
- Cheng Y, Ren X, Yuan Y, Shan Y, Li L, Chen X, Zhang L, Takahashi Y, Yang JW, Han B, et al. (2016) eEF-2 kinase is a critical regulator of Warburg effect through controlling PP2A-A synthesis. Oncogene 35:6293–6308. [DOI] [PubMed] [Google Scholar]
- Dhillon AS, Hagan S, Rath O, Kolch W. (2007) MAP kinase signalling pathways in cancer. Oncogene 26:3279–3290. [DOI] [PubMed] [Google Scholar]
- Dominguez CL, Floyd DH, Xiao A, Mullins GR, Kefas BA, Xin W, Yacur MN, Abounader R, Lee JK, Wilson GM, et al. (2013) Diacylglycerol kinase α is a critical signaling node and novel therapeutic target in glioblastoma and other cancers. Cancer Discov 3:782–797. [DOI] [PMC free article] [PubMed] [Google Scholar]
- Edgar RC. (2004) MUSCLE: a multiple sequence alignment method with reduced time and space complexity. BMC Bioinformatics 5:113. [DOI] [PMC free article] [PubMed] [Google Scholar]
- Franks CE, Campbell ST, Purow BW, Harris TE, Hsu KL. (2017) The ligand binding landscape of diacylglycerol kinases. Cell Chem Biol 24:870–880. [DOI] [PMC free article] [PubMed] [Google Scholar]
- Graziano SL, Pfeifer AM, Testa JR, Mark GE, Johnson BE, Hallinan EJ, Pettengill OS, Sorenson GD, Tatum AH, Brauch H, et al. (1991) Involvement of the RAF1 locus, at band 3p25, in the 3p deletion of small-cell lung cancer. Genes Chromosomes Cancer 3:283–293. [DOI] [PubMed] [Google Scholar]
- Greer P. (2002) Closing in on the biological functions of Fps/Fes and Fer. Nat Rev Mol Cell Biol 3:278–289. [DOI] [PubMed] [Google Scholar]
- Griner EM, Kazanietz MG. (2007) Protein kinase C and other diacylglycerol effectors in cancer. Nat Rev Cancer 7:281–294. [DOI] [PubMed] [Google Scholar]
- Hatzivassiliou G, Song K, Yen I, Brandhuber BJ, Anderson DJ, Alvarado R, Ludlam MJ, Stokoe D, Gloor SL, Vigers G, et al. (2010) RAF inhibitors prime wild-type RAF to activate the MAPK pathway and enhance growth. Nature 464:431–435. [DOI] [PubMed] [Google Scholar]
- Heidorn SJ, Milagre C, Whittaker S, Nourry A, Niculescu-Duvas I, Dhomen N, Hussain J, Reis-Filho JS, Springer CJ, Pritchard C, et al. (2010) Kinase-dead BRAF and oncogenic RAS cooperate to drive tumor progression through CRAF. Cell 140:209–221. [DOI] [PMC free article] [PubMed] [Google Scholar]
- Hsu KL, Tsuboi K, Whitby LR, Speers AE, Pugh H, Inloes J, Cravatt BF. (2013) Development and optimization of piperidyl-1,2,3-triazole ureas as selective chemical probes of endocannabinoid biosynthesis. J Med Chem 56:8257–8269. [DOI] [PMC free article] [PubMed] [Google Scholar]
- Kepp O, Galluzzi L, Lipinski M, Yuan J, Kroemer G. (2011) Cell death assays for drug discovery. Nat Rev Drug Discov 10:221–237. [DOI] [PubMed] [Google Scholar]
- Kim JA, Anurag M, Veeraraghavan J, Schiff R, Li K, Wang XS. (2016) Amplification of TLK2 induces genomic instability via impairing the G2-M checkpoint. Mol Cancer Res 14:920–927. [DOI] [PMC free article] [PubMed] [Google Scholar]
- Knight ZA, Lin H, Shokat KM. (2010) Targeting the cancer kinome through polypharmacology. Nat Rev Cancer 10:130–137. [DOI] [PMC free article] [PubMed] [Google Scholar]
- Lewis TS, Shapiro PS, Ahn NG. (1998) Signal transduction through MAP kinase cascades. Adv Cancer Res 74:49–139. [DOI] [PubMed] [Google Scholar]
- McCloud RL, Franks CE, Campbell ST, Purow BW, Harris TE, Hsu KL. (2018) Deconstructing lipid kinase inhibitors by chemical proteomics. Biochemistry 57:231–236. [DOI] [PMC free article] [PubMed] [Google Scholar]
- Morrow AA, Alipour MA, Bridges D, Yao Z, Saltiel AR, Lee JM. (2014) The lipid kinase PI4KIIIβ is highly expressed in breast tumors and activates Akt in cooperation with Rab11a. Mol Cancer Res 12:1492–1508. [DOI] [PubMed] [Google Scholar]
- Nagano JM, Hsu KL, Whitby LR, Niphakis MJ, Speers AE, Brown SJ, Spicer T, Fernandez-Vega V, Ferguson J, Hodder P, et al. (2013) Selective inhibitors and tailored activity probes for lipoprotein-associated phospholipase A(2). Bioorg Med Chem Lett 23:839–843. [DOI] [PMC free article] [PubMed] [Google Scholar]
- Olmez I, Love S, Xiao A, Manigat L, Randolph P, McKenna BD, Neal BP, Boroda S, Li M, Brenneman B, et al. (2018) Targeting the mesenchymal subtype in glioblastoma and other cancers via inhibition of diacylglycerol kinase alpha. Neuro-oncol 20:192–202. [DOI] [PMC free article] [PubMed] [Google Scholar]
- Patricelli MP, Nomanbhoy TK, Wu J, Brown H, Zhou D, Zhang J, Jagannathan S, Aban A, Okerberg E, Herring C, et al. (2011) In situ kinase profiling reveals functionally relevant properties of native kinases. Chem Biol 18:699–710. [DOI] [PMC free article] [PubMed] [Google Scholar]
- Patricelli MP, Szardenings AK, Liyanage M, Nomanbhoy TK, Wu M, Weissig H, Aban A, Chun D, Tanner S, Kozarich JW. (2007) Functional interrogation of the kinome using nucleotide acyl phosphates. Biochemistry 46:350–358. [DOI] [PubMed] [Google Scholar]
- Pearson G, Robinson F, Beers Gibson T, Xu BE, Karandikar M, Berman K, Cobb MH. (2001) Mitogen-activated protein (MAP) kinase pathways: regulation and physiological functions. Endocr Rev 22:153–183. [DOI] [PubMed] [Google Scholar]
- Peng Y, McCorvy JD, Harpsoe K, Lansu K, Yuan S, Popov P, Qu L, Pu M, Che T, Nikolajsen LF, et al. (2018) 5-HT2C receptor structures reveal the structural basis of GPCR polypharmacology. Cell 172:719–730. [DOI] [PMC free article] [PubMed] [Google Scholar]
- Poulikakos PI, Zhang C, Bollag G, Shokat KM, Rosen N. (2010) RAF inhibitors transactivate RAF dimers and ERK signalling in cells with wild-type BRAF. Nature 464:427–430. [DOI] [PMC free article] [PubMed] [Google Scholar]
- Purow B. (2015) Molecular pathways: targeting diacylglycerol kinase alpha in cancer. Clin Cancer Res 21:5008–5012. [DOI] [PMC free article] [PubMed] [Google Scholar]
- Rice P, Longden I, Bleasby A. (2000) EMBOSS: the European Molecular Biology Open Software Suite. Trends Genet 16:276–277. [DOI] [PubMed] [Google Scholar]
- Sakane F, Imai S, Kai M, Yasuda S, Kanoh H. (2007) Diacylglycerol kinases: why so many of them? Biochim Biophys Acta 1771:793–806. [DOI] [PubMed] [Google Scholar]
- Sanclemente M, Francoz S, Esteban-Burgos L, Bousquet-Mur E, Djurec M, Lopez-Casas PP, Hidalgo M, Guerra C, Drosten M, Musteanu M, et al. (2018) c-RAF ablation induces regression of advanced Kras/Trp53 mutant lung adenocarcinomas by a mechanism independent of MAPK signaling. Cancer Cell 33:217–228. [DOI] [PubMed] [Google Scholar]
- Seger R, Krebs EG. (1995) The MAPK signaling cascade. FASEB J 9:726–735. [PubMed] [Google Scholar]
- Shin M, Franks CE, Hsu K-L. (2018) Isoform-selective activity-based profiling of ERK signaling. Chem Sci (Camb) 9:2419–2431. [DOI] [PMC free article] [PubMed] [Google Scholar]
- Simanshu DK, Nissley DV, McCormick F. (2017) RAS proteins and their regulators in human disease. Cell 170:17–33. [DOI] [PMC free article] [PubMed] [Google Scholar]
- Wang Y, Yang H, Liu H, Huang J, Song X. (2009) Effect of staurosporine on the mobility and invasiveness of lung adenocarcinoma A549 cells: an in vitro study. BMC Cancer 9:174. [DOI] [PMC free article] [PubMed] [Google Scholar]
- Wu P, Nielsen TE, Clausen MH. (2015) FDA-approved small-molecule kinase inhibitors. Trends Pharmacol Sci 36:422–439. [DOI] [PubMed] [Google Scholar]
- Ye J, Kumanova M, Hart LS, Sloane K, Zhang H, De Panis DN, Bobrovnikova-Marjon E, Diehl JA, Ron D, Koumenis C. (2010) The GCN2-ATF4 pathway is critical for tumour cell survival and proliferation in response to nutrient deprivation. EMBO J 29:2082–2096. [DOI] [PMC free article] [PubMed] [Google Scholar]


