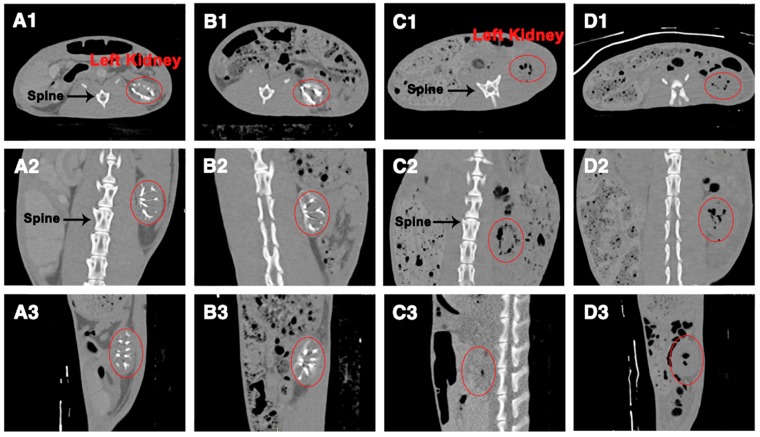
Figure 4.
CT images of rabbit abdomens after embolization of the left kidney with (A-B) Ta@CaAlg or (C-D) CaAlg microspheres for (A, C) 1 week and (B, D) 4 weeks. 1, 2 and 3 were views of the transverse, coronal and sagittal planes, respectively. The areas marked by the red circles are left embolized kidneys.

