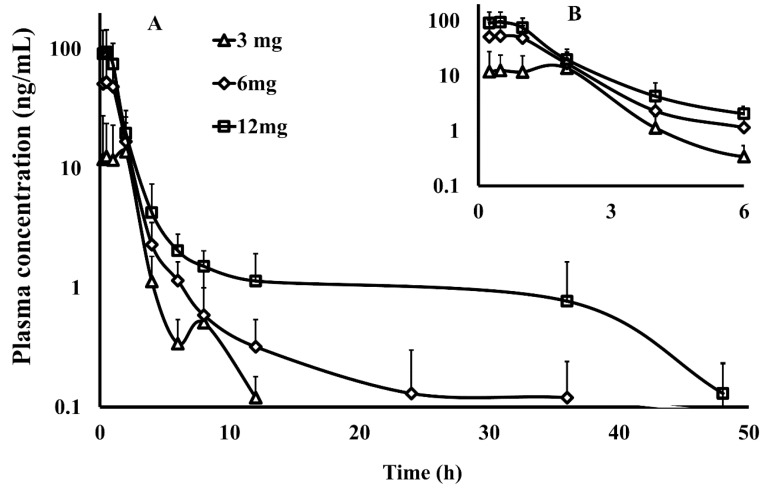
Figure 2.
The plasma concentration–time curve within 48 h ((A), the main graph) and 6 h ((B), the inset) by semi-log data plot (the y-coordinate was logarithmic coordinates) of methyl 3-amino-6-methoxythieno [2,3-b] quinolone-2-carboxylate (PU-48) after a single oral administration of PU-48 self-nanomicroemulsifying drug delivery system (SNEDDS) at three doses (3, 6, 12 mg/kg) in rats detected by the liquid chromatography-tandem mass spectrometry (LC-MS/MS) method (n = 6, mean ± SD).

