



Abstract
Background:
Quantitative real-time reverse-transcription polymerase chain reaction is frequently used as research tool in experimental oncology. There are some studies of valid endogenous control genes in the field of human glioma research, which, however, only focus on the comparison between normal brain with tumor tissue and malignant transformation toward secondary glioblastomas. Aim of this study was to validate a more general reference gene also suitable for pre- and posttreatment analysis and other evaluations (eg, primary vs secondary glioblastoma).
Methods:
This quantitative polymerase chain reaction analysis was performed to test a panel of the 6 most suitable reference genes from other studies representing different physiological pathways (ACTB, GAPDH, POLR2A, RPL13A, SDHA, and TBP) in all common glioma groups, namely: diffuse astrocytoma World Health Organization II, anaplastic astrocytoma World Health Organization III, secondary glioblastoma World Health Organization IV with and without chemotherapy, primary glioblastoma, recurrent glioblastoma, and gliomas before and after radiation. Expression stability was tested during the longitudinal course of the disease in 8 single patients.
Results:
Evaluation of the expression levels of the 6 target genes showed that ACTB, GAPDH, and RPL13A show higher expression compared to SDHA, POLR2A, and TBP. ACTB, GAPDH, and RPL13A showed different expression levels between astrozytoma grade II and primary glioblastoma. Except for this difference, the candidate genes were not differentially expressed between primary and secondary glioblastomas and between the World Health Organization tumor grades. Furthermore, they remained stable before and after radiotherapy and/or chemotherapy. Therefore, they are adequate references for glioblastoma gene expression studies. The comparison of all tested genes resulted in SDHA and ACTB as most stable reference genes determined by the NormFinder software. Our data revealed lowest intragroup variation in the SDHA, highest in the RPL13A gene.
Conclusions:
All tested genes may be recommended as universal reference genes for data normalization in gene expression studies under different treatment regimens both in primary glioblastomas and astrocytomas of different grades (World Health Organization grades II-IV), respectively. In summary, ACTB and SDHA exhibited the best stability values and showed the lowest intergroup expression variability.
Keywords: astrocytoma, glioblastoma multiforme, glioma, housekeeping gene, qPCR, quantitative real-time polymerase chain reaction, quantitative RT-PCR, reference gene, WHO grade
Introduction
As gene expression-based classification of gliomas correlates better with survival than histological classification,1 new prognostic and predictive biomarkers of potential use in both diagnosis and treatment are needed. Moreover, the identification of molecular markers associated with tumor progression, tumor grade, and patient survival using high throughput methods in order to understand the complex biology regulating tumor growth, malignant transformation, and the therapeutic accessibility of gliomas are important.2–4
Therefore, methods for the quantitative analysis of gene expression are increasingly important for the reliable investigation of expression profiles. Real-time RT-PCR is frequently used to analyze gene expression. Quantitative real-time reverse transcription PCR (qRT-PCR) is a highly sensitive and powerful tool to analyze gene expression. Some of the advantages of qRT-PCR include its high reproducibility, high sensitivity, and high specificity.5–7 However, methodological inherent issues such as the varying quality and quantity of RNA, differences in reverse transcription, and PCR efficiencies have to be considered for getting valid results. A proper normalization presumes the use of an internal control, often referred to as a “housekeeping” or reference gene. This must be carefully selected because its expression levels should not significantly differ among tissues and experimental conditions analyzed. These conditions include a stable expression in all samples independent of (1) different tissue types (ie, normal vs tumor), (2) tumor grades, (3) developmental stages, and (4) treatment regimens.8,9 Being constitutively expressed is an absolute prerequisite to act as control gene and to be able to measure differences in the amount of starting mRNA of a gene of interest and in complementary DNA (cDNA) synthesis efficiency in the tissues analyzed.10,11 Control genes have to be verified prior to each experimental setting and for all cDNA used.12 As no perfect reference gene exists, sometimes more than 1 gene has to be used for adequate normalization to avoid misinterpretation of gene expression data.13
Many reports have shown that “classical” housekeeping genes harbor variable expression levels under different experimental conditions.13–16 Thus, it is clear whether suitable control genes are extremely specific for particular sample sets and experimental models, being a crucial component in assessing confident gene expression patterns.17
The aim of this study was the selection of suitable reference genes for expression studies in primary, secondary, and recurrent human gliomas with respect to radiotherapy and chemotherapy using quantitative RT-PCR. In the present study, we tested the best 6 reference genes of the 3 earlier studies17–19 (RPL13A, GAPDH, SDHA, POLR2A, ACTB, and TBP) for their expression stability in the following groups: (1) diffuse astrocytoma World Health Organization (WHO) grade II, anaplastic astrocytoma WHO grade III, and glioblastoma (GBM) WHO grade IV; (2) primary and secondary GBM; (3) primary and recurrent glioma; (4) with and without chemotherapy (CTx), and (5) before and after radiotherapy. We aimed to identify a set of reference genes suitable as universal normalizers in gliomas of different grades and under different treatment regimens. This analysis enables longitudinally designed studies and the comparison of different astrocytoma types at the same time including pre- and postchemotherapy, after radiotherapy, and in astrocytomas before and after malignant transformation.
Patients, Materials, and Methods
Patients
The surgical specimen for this study was obtained from 35 patients at the Department of Neurosurgery of the University of Cologne from 1991 to 2013. We analyzed 60 tumor tissue samples altogether. Eight patients were followed during disease progression in the longitudinal course. Brain tissue samples were evaluated according to the WHO classification of tumors of the nervous system and divided into 6 different groups based on the grade of malignancy and prior treatment: astrocytoma WHO grade II, astrocytoma WHO grade III, and GBM WHO grade IV before and after chemotherapeutical treatment. Moreover, we distinguished between primary and secondary GBMs. Written informed consent of the patients to use tissue samples for scientific investigations was obtained according to the Helsinki declaration of ethical requirements and the local ethical committee from the University of Cologne (Application No. 03-170).
Tissue Samples
Tissue samples (n = 10 per group) were obtained from our tumor tissue bank. They were obtained during surgery, snap-frozen in liquid nitrogen immediately after excision, and stored in our tumor bank at −80°C until further treatment. Ten micrometer cryostat sections were taken from each sample and stained with hematoxylin/eosin for histological examination by a neuropathologist and to assure that representative tissue was used for the molecular analysis in order to ensure the exclusion of tissue presenting necrosis or not matching to GBM diagnostic prior to RNA extraction.
RNA Isolation and Quality Evaluation and cDNA Synthesis
Total RNA was isolated from fresh frozen tissue using the RNeasy Mini Kit (Qiagen, Hilden, Germany). Quantity and purity of RNA were assessed spectrophotometrically at 260 and 280 nm. After elimination of genomic DNA, reverse transcription was performed using the QuantiTect Reverse Trascription Kit (Qiagen, Hilden, Germany).
Quantitative Realtime PCR
All quantitative polymerase chain reactions (qPCRs) were done twice in duplicate. PCR was carried out in a final volume of 20 µL in the presence of 1× iQ SYBR Green Supermix (BioRad, München, Germany; containing dNTPs, iTaq DNA polymerase, MgCl2, SYBR Green I). The primers used (QuantiTect Primer Assay; Qiagen, Hilden, Germany) are depicted in Table 1. Five microliter of cDNA (diluted 1:200) was used. Amplification was performed on a Rotor-Gene Q cycler (Qiagen, Hilden, Germany) using a 2-step cycling program according to the following conditions: initial denaturation for 3 minutes at 95°C, followed by 45 cycles of 95°C for 5 seconds and 60°C for 10 seconds. After each run, a melting curve was added to confirm the specificity of the amplification.
Table 1.
Candidate Normalization Genes Analyzed in this Study.
| Symbol | Gene Name | Function | Gene ID | Accession No | Ensembl ID | Amplicon Length bp | Efficiency, % |
|---|---|---|---|---|---|---|---|
| ACTB | Beta-actin | Cytoskeletal structural protein | 60 | NM_0O1101 | ENSTU0000150302 | 146 | 102 |
| GAPDH | Glyceraldehyde-3-phosphate dehydrogenase | Glycolysis enzyme | 2597 | NM_002046 | ENST00000229239 | 95 | 104 |
| RPL13A | 60S ribosomal protein Ll3A | Ribosomal protein | 23521 | NM_012423 | ENST00000270634 | 161 | 102 |
| SDHA | Succinate dehydrogenase A | Oxidative phosphorylation | 6389 | NM_004168 | ENST00000264932 | 147 | 101 |
| POLR2A | Polypeptide A, 220 kDa | RNA polymerase II (DNA directed) polypeptide A | 5430 | NM_000937 | ENSTU0000322644 | 61 | 106 |
| TBP | TATA-box binding protein | Transcription factor | 6908 | NM_003194 | ENST00000230354 | 132 | 88 |
Statistical Data Analysis
The differences in gene expression levels were analyzed by the Mann–Whitney U test, using the SPSS 20.0 software. P values <.05 were considered statistically significant. For evaluation of expression stability of the candidate reference genes, we applied the NormFinder software (https://moma.dk/normfinder-software).20 This program is a Visual Basic application tool for Microsoft Excel. We selected the most stable candidate genes, whereby both the intragroup and the intergroup variation in candidate genes were modeled.
Results
The threshold cycles (Ct values) of the reference genes analyzed showed different transcription levels in all groups, ranging from 14 to 16 (ACTB, GAPDH, RPL13A, high expression) to 20 to 23 (SDHA, POLR2A, TBP, low expression; Figure 1). This difference between these 2 groups was significant (P < .05), whereas the differences in expression of selected reference genes within the single genes tested between astrocytoma grade II, anaplastic astrocytoma grade III, secondary GBM with chemotherapy, secondary GBM without chemotherapy, primary GBM, and primary recurrent GBM with chemotherapy showed no significance with 1 exception (see below).
Figure 1.

Comparison of threshold cycles (Ct values). GIIIR indicates anaplastic astrocytome grade III; pGBM, primary glioblastoma; pGBM R + C, primary recurrent glioblastoma with chemotherapy; pGII, astrocytoma grade II; sGBM R + C, secondary glioblastoma with chemotherapy; sGBM R − C, secondary glioblastoma without chemotherapy.
Analyzing glioma progression, Ct values of astrocytoma grade II, grade III, and secondary GBM remained stable within all reference genes tested (P > .05; Figure 2). Our results indicate that SDHA displayed the most stable values for recurrent astrocytomas with rising tumor grade (WHO grade II to III to IV). Moreover, the candidate genes were not differentially expressed between primary and secondary GBMs (Figure 3). They also remained stable comparing samples before and after chemotherapy (Figure 4: primary GBM vs recurrent primary GBM + CTx; Figure 5: secondary GBM vs recurrent secondary GBM + CTx). In addition, when comparing the potential reference genes in gliomas with and without radiotherapy also no differential expression occurred (Figure 6).
Figure 2.
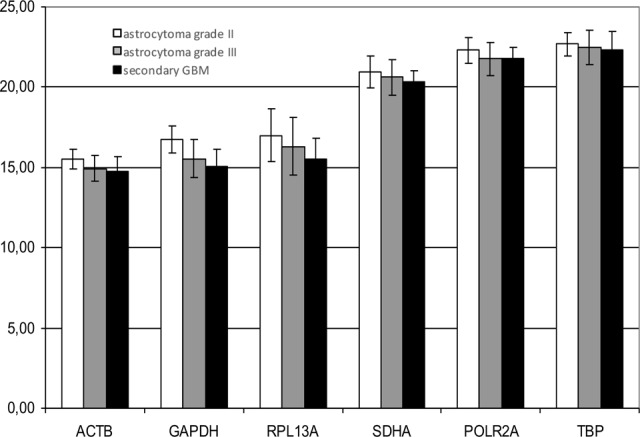
Comparison of World Health Organization (WHO) II, III, and IV Gliomas: Ct values of astrocytoma grade II (white), grade III (gray), and secondary glioblastoma (GBM; black).
Figure 3.
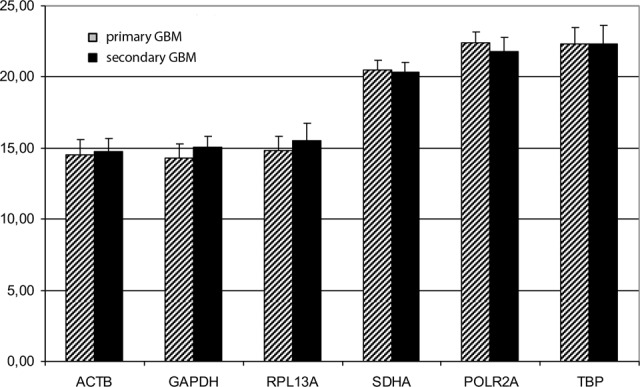
Primary glioblastoma (GBM) compared to secondary GBM (black).
Figure 4.
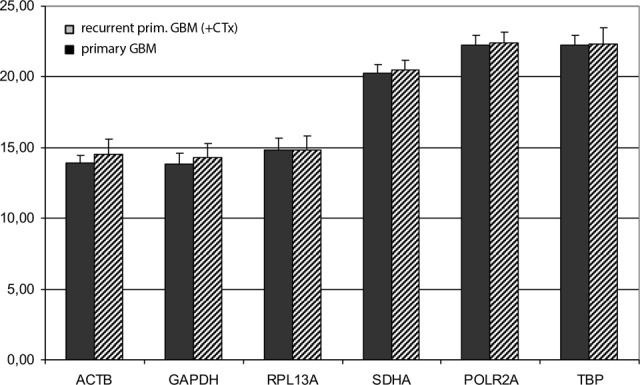
Primary glioblastoma (GBM; black) versus recurrent primary GBM (+CTx).
Figure 5.
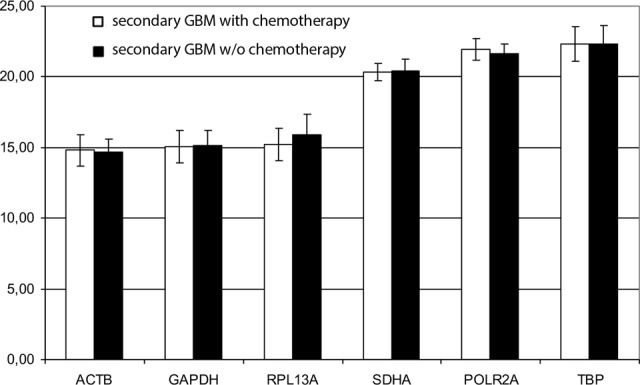
Secondary glioblastoma (GBM) with/without chemotherapy.
Figure 6.
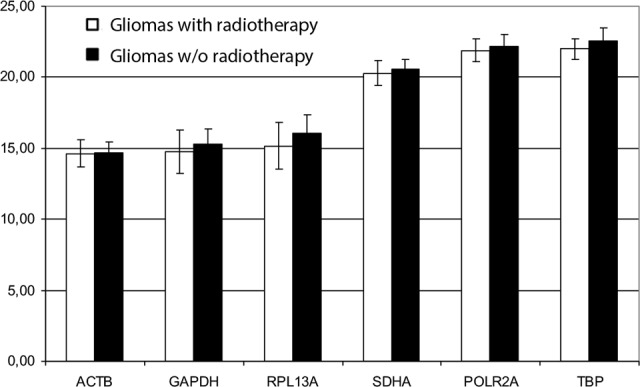
Gliomas with/without radiotherapy.
Only ACTB, GAPDH, and RPL13A showed significantly different expression levels between astrocytoma grade II and primary GBM (P > .05). Therefore, all 6 tested genes—the latter 3 ones are not suitable for comparisons between WHO II gliomas and primary GBM—are adequate references for glioma gene expression studies. Moreover, the comparison of different glioma entities resulted in SDHA and ACTB as most stable reference genes determined by the NormFinder software. Also important is the expression stability of candidate genes. The data revealed lowest intergroup and intragroup variation in the SDHA, highest in the RPL13A gene (Figure 7; Table 2). ACTB shows the most stable results as a gene which is highly expressed in brain tumor tissue. These results could also be reproduced in the longitudinal course of the disease in 8 single patients. Expression of candidate reference genes (Ct values) in these patients during progress of recurrency with malignant transformation showed a stable expression of all reference candidate genes tested (Figure 8).
Figure 7.

Intergroup variation. GIIIR indicates anaplastic astrocytome grade III; pGBM, primary glioblastoma; pGBM R + C, primary recurrent glioblastoma with chemotherapy; pGII, astrocytoma grade II; sGBM R + C, secondary glioblastoma with chemotherapy; sGBM R − C, secondary glioblastoma without chemotherapy.
Table 2.
Expression Stability of Candidate Reference Genes in All Glioma Groups Analyzed: Best Gene and Best Combination of Genes (NormFinder).
| Gene Name | Stability Value |
|---|---|
| ACTB | 0.237 |
| SDHA | 0.263 |
| TBP | 0.324 |
| GAPDH | 0.428 |
| POLR2A | 0.439 |
| RPL13A | 0.461 |
| Best Combination | |
| ACTB + TBP | 0.177 |
Figure 8.

Longitudinal course with malignant transformation in 3 single patients. Expression of candidate reference genes (Ct values) in 3 patients during progress of recurrency, ♦ glioma II, ▴ glioma III, ▪ glioblastoma.
Discussion
In human astrocytomas, only 3 studies have been performed validating reference genes; however, no systematic analysis of suitable endogenous control genes exists for recurrent tumors and under treatment conditions. So far, normalization of qRT-PCR in gliomas has only been performed by comparing tumor tissue to normal tissue17 (immediately snap-frozen tissue in liquid nitrogen; also SYBR Green PCR), by comparing the different glioma grades (WHO II-IV),18 or both together.19 Potential differential regulation of used reference genes between different treatment regimens has not yet been considered. Moreover, during the last years, genomic DNA sequencing revealed not only a clinical but also a molecular difference between primary and secondary GBM. The latter ones often harbor an isocitrate dehydrogenase 1/2 mutation for example.
So far, no study has been published in human glioma comparing both different grades of malignancies and the influence of radiotherapy and chemotherapy on the stability of reference genes. When aiming to analyze both questions in a complex study, a stable—or a combination of stable—reference gene(s) under these conditions is needed.
Valente et al showed that among 7 frequently used housekeeping genes, TBP and HPRT1 were adequate references for GBM gene expression analysis. They also found that the evaluation of the expression levels of 12 target genes utilizing different endogenous controls revealed that the normalization method applied might introduce errors in the estimation of relative quantities.17 However, they only compared GBM tissue to normal tissue.
Gresner et al tested a panel of 6 housekeeping genes (GAPDH, HPRT1, POLR2A, RPLP0, ACTB, and H3F). They compared different grades of malignancies in astrocytomas (WHO II, III, and IV). Under these conditions, they found GAPDH to be the most stable and HPRT1 the least stable reference gene. Furthermore, the effect of reference gene selection on qRT-PCR data interpretation was demonstrated, normalizing the expression data of a selected gene of interest.18 Kreth et al tested 19 commonly used reference genes for their expression stability in human glioma and compared astrocytoma WHO grade II, astrocytoma WHO grade III, and GBM. In addition, they compared them with normal brain,19 and their analysis indicated TBP and IPO8 being the most stable ones.
Our study compared the 6 most promising housekeeping genes investigated in the 3 studies earlier. As an additional value, we defined the optimal reference genes comparing primary and secondary GBM, as this differentiation seems to be more and more important. Furthermore, we considered possible effects of radiotherapy and chemotherapy and focused on individual clinical coursed during disease progression.
Conclusions
Taken together, our data show the relevance of previous validation of candidate control genes for each experimental design and indicate that the most suitable housekeeping genes are SDHA and ACTB for quantitative PCR analysis in glioma tissue of different malignancies, after recurrence, and under different treatment conditions.
Acknowledgment
The authors gratefully thank M. Perrech for critical reading and comments on the manuscript.
Abbreviations
- cDNA
complementary DNA
- GBM
glioblastoma
- qPCR
quantitative polymerase chain reaction
- qRT-PCR
quantitative real-time reverse transcription PCR
- WHO
World Health Organization.
Footnotes
Declaration of Conflicting Interests: The author(s) declared no potential conflicts of interest with respect to the research, authorship, and/or publication of this article.
Funding: The author(s) disclosed receipt of the following financial support for the research, authorship, and/or publication of this article: The study was supported by the institutional funds of the Department of General Neurosurgery, University of Cologne, Germany.
ORCID iD: Marco Timmer, MD  http://orcid.org/0000-0002-8790-9617
References
- 1. Nutt CL, Mani DR, Betensky RA, et al. Gene expression-based classification of malignant gliomas correlates better with survival than histological classification. Cancer Res. 2003;63(7):1602–1607. [PubMed] [Google Scholar]
- 2. Louis DN, Ohgaki H, Wiestler OD, et al. The 2007 WHO classification of tumors of the central nervous system. Acta Neuropathol. 2007;114(2):97–109. [DOI] [PMC free article] [PubMed] [Google Scholar]
- 3. Louis DN, Perry A, Reifenberger G, et al. The 2016 World Health Organization Classification of Tumors of the Central Nervous System: a summary. Acta Neuropathol, 2016: 131(6)803–20 [DOI] [PubMed] [Google Scholar]
- 4. Malzkorn B, Reifenberger G. Practical implications of integrated glioma classification according to the World Health Organization classification of tumors of the central nervous system 2016. Curr Opin Oncol, 2016: 28(6)494–501. [DOI] [PubMed] [Google Scholar]
- 5. Mishima K, Kato Y, Kaneko MK, Nishikawa R, Hirose T, Matsutani M. Increased expression of podoplanin in malignant astrocytic tumors as a novel molecular marker of malignant progression. Acta Neuropathol. 2006;111(5):483–488. [DOI] [PubMed] [Google Scholar]
- 6. Blazquez C, Salazar M, Carracedo A, et al. Cannabinoids inhibit glioma cell invasion by down-regulating matrix metalloproteinase-2 expression. Cancer Res. 2008;68(6):1945–1952. [DOI] [PubMed] [Google Scholar]
- 7. Ruano Y, Mollejo M, Camacho FI, et al. Identification of survival-related genes of the phosphatidylinositol 30-kinase signaling pathway in glioblastoma multiforme. Cancer. 2008;112(7):1575–1584. [DOI] [PubMed] [Google Scholar]
- 8. Dheda K, Huggett JF, Chang JS, et al. The implications of using an inappropriate reference gene for real-time reverse transcription PCR data normalization. Anal Biochem. 2005;344(1):141–143. [DOI] [PubMed] [Google Scholar]
- 9. Bonefeld BE, Elfving B, Wegener G. Reference genes for normalization: a study of rat brain tissue. Synapse. 2008;62(4):302–309. [DOI] [PubMed] [Google Scholar]
- 10. Huggett J, Dheda K, Bustin S, Zumla A. Real-time RT-PCR normalisation; strategies and considerations. Genes Immun. 2005;6(4):279–284. [DOI] [PubMed] [Google Scholar]
- 11. Wong ML, Medrano JF. Real-time PCR for mRNA quantitation. Biotechniques. 2005;39(1):75–85. [DOI] [PubMed] [Google Scholar]
- 12. Klatte M, Bauer P. Accurate real-time reverse transcription quantitative PCR. Methods Mol Biol. 2009;479:61–77. [DOI] [PubMed] [Google Scholar]
- 13. Tricarico C, Pinzani P, Bianchi S, et al. Quantitative real-time reverse transcription polymerase chain reaction: normalization to rRNA or single housekeeping genes is inappropriate for human tissue biopsies. Anal Biochem. 2002;309(2):293–300. [DOI] [PubMed] [Google Scholar]
- 14. de Kok JB, Roelofs RW, Giesendorf BA, et al. Span PN: normalization of gene expression measurements in tumor tissues: comparison of 13 endogenous control genes. Lab Invest. 2005;85(1):154–159. [DOI] [PubMed] [Google Scholar]
- 15. Selvey S, Thompson EW, Matthaei K, Lea RA, Irving MG, Griffiths LR. Beta-actin—an unsuitable internal control for RT-PCR. Mol Cell Probes. 2001;15(5):307–311. [DOI] [PubMed] [Google Scholar]
- 16. Glare EM, Divjak M, Bailey MJ, Walters EH. beta-Actin and GAPDH housekeeping gene expression in asthmatic airways is variable and not suitable for normalising mRNA levels. Thorax. 2002;57(9):765–770. [DOI] [PMC free article] [PubMed] [Google Scholar]
- 17. Valente V, Teixeira SA, Neder L, et al. Selection of suitable housekeeping genes for expression analysis in glioblastoma using quantitative RT-PCR. BMC Mol Biol. 2009;10:17. [DOI] [PMC free article] [PubMed] [Google Scholar]
- 18. Gresner SM, Golanska E, Kulczycka-Wojdala D, Jaskolski DJ, Papierz W, Liberski PP. Selection of reference genes for gene expression studies in astrocytomas. Anal Biochem. 2011;408(1):163–165. [DOI] [PubMed] [Google Scholar]
- 19. Kreth S, Heyn J, Grau S, Kretzschmar HA, Egensperger R, Kreth FW. Identification of valid endogenous control genes for determining gene expression in human glioma. Neurooncol. 2010;12(6):570–579. [DOI] [PMC free article] [PubMed] [Google Scholar]
- 20. Andersen CL, Jensen JL, Orntoft TF. Normalization of real-time quantitative reverse transcription-PCR data: a model-based variance estimation approach to identify genes suited for normalization, applied to bladder and colon cancer data sets. Cancer Res. 2004;64(15):5245–5250. [DOI] [PubMed] [Google Scholar]