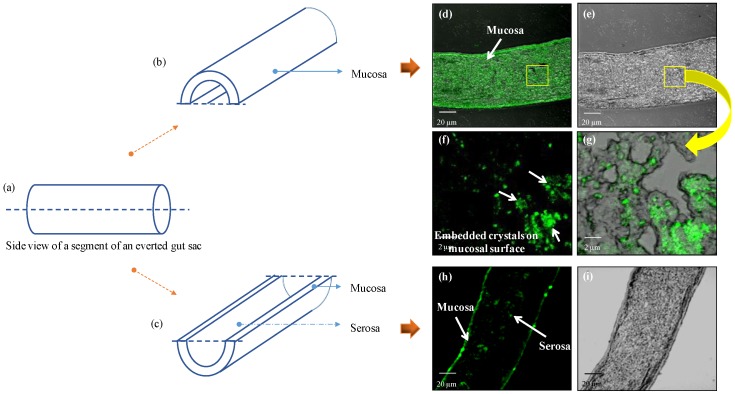
Figure 7.
Schematic representation of the mucosal and serosal side on everted gut sac: (a) Side view of the jejunum segment of the everted gut sac; (b,c) depict the mucosal and serosal side of the gut sac after sectioning (longitudinal). CLSM images (d–i) of NSD treated gut represent: (d) phase contrast and (e) bright field of the mucosal side. Images (f,g) represent a zoomed in picture of the images (d,e) which show the presence of crystals embedded on the mucosal surface. Images (h,i) represent the phase contrast and bright field of the serosal side of the gut.

