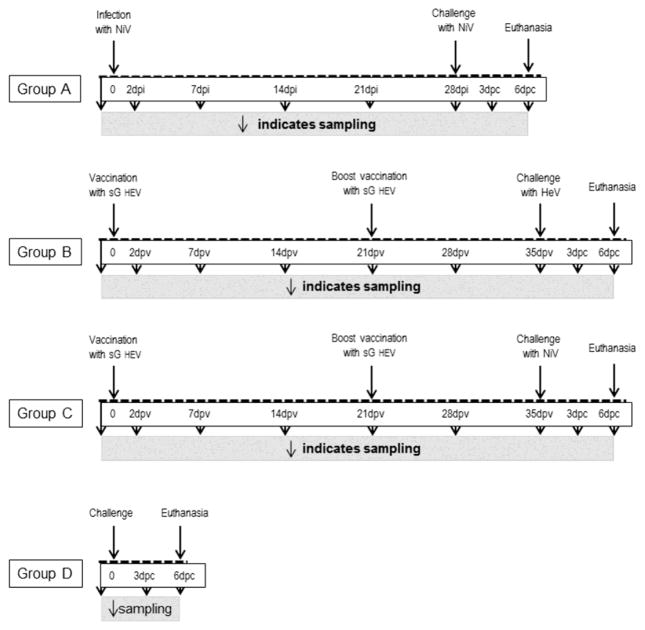
Figure 1. Experimental Design.
Schematic representation of each group is detailed to indicate sampling, vaccination/inoculation and euthanasia timelines. Group A, primary NiV infection is indicated as days post infection (dpi); while secondary NiV challenge is indicated by days post challenge (dpc). Group B and group C were both vaccinated, therefore dpv represents days post vaccination. Here, dpc represents subsequent challenge with either HeV or NiV as indicated. Group D, challenge control pigs have no pre-treatment, therefore no timeline is present prior to challenge. Sampling is indicated by downward facing arrows.

