Abstract
Purpose
Outcomes for patients with diffuse large B-cell lymphoma remain heterogeneous, with existing methods failing to consistently predict treatment failure. We examined the additional prognostic value of circulating tumor DNA (ctDNA) before and during therapy for predicting patient outcomes.
Patients and Methods
We studied the dynamics of ctDNA from 217 patients treated at six centers, using a training and validation framework. We densely characterized early ctDNA dynamics during therapy using cancer personalized profiling by deep sequencing to define response-associated thresholds within a discovery set. These thresholds were assessed in two independent validation sets. Finally, we assessed the prognostic value of ctDNA in the context of established risk factors, including the International Prognostic Index and interim positron emission tomography/computed tomography scans.
Results
Before therapy, ctDNA was detectable in 98% of patients; pretreatment levels were prognostic in both front-line and salvage settings. In the discovery set, ctDNA levels changed rapidly, with a 2-log decrease after one cycle (early molecular response [EMR]) and a 2.5-log decrease after two cycles (major molecular response [MMR]) stratifying outcomes. In the first validation set, patients receiving front-line therapy achieving EMR or MMR had superior outcomes at 24 months (EMR: EFS, 83% v 50%; P = .0015; MMR: EFS, 82% v 46%; P < .001). EMR also predicted superior 24-month outcomes in patients receiving salvage therapy in the first validation set (EFS, 100% v 13%; P = .011). The prognostic value of EMR and MMR was further confirmed in the second validation set. In multivariable analyses including International Prognostic Index and interim positron emission tomography/computed tomography scans across both cohorts, molecular response was independently prognostic of outcomes, including event-free and overall survival.
Conclusion
Pretreatment ctDNA levels and molecular responses are independently prognostic of outcomes in aggressive lymphomas. These risk factors could potentially guide future personalized risk-directed approaches.
INTRODUCTION
The addition of rituximab to combination cyclophosphamide, doxorubicin, vincristine, and prednisone (R-CHOP) chemotherapy has improved outcomes for patients with diffuse large B-cell lymphoma (DLBCL). Despite this, a significant fraction of patients continue to experience disease relapse or mortality. Previous studies have related clinical and molecular features with outcomes in patients with DLBCL.1-5 This has resulted in several prognostic tools to stratify patients into risk groups; however, the impact of these tools on improving outcomes has been limited.6-8 Prior studies using the International Prognostic Index (IPI) and interim positron emission tomography (PET) to select patients for intensified therapy have failed to improve survival.7,9-12 These approaches are confounded in part by imperfect risk stratification, including the variable specificity of interim PET/computed tomography (CT).6 Accordingly, alternative methods to predict outcomes are needed.
Circulating tumor DNA (ctDNA) is an emerging biomarker across oncology, including for lymphomas.13-17 Previous studies have highlighted the potential of ctDNA for noninvasive detection of tumor-specific mutations and molecular subtyping.15,17 Detection of ctDNA in DLBCL at the start of the third cycle of dose-adjusted chemotherapy by immunoglobulin gene sequencing has demonstrated utility in predicting time to progression; however, the impact of interim ctDNA on survival remains unclear.14 Furthermore, because of the ease of sample collection, ctDNA offers unique possibilities for repeated assessment before and during therapy.18,19 Moreover, the prognostic performance of ctDNA in the context of other risk factors, including the IPI and interim PET/CT, has not yet been explored.
Here, we apply cancer personalized profiling by deep sequencing (CAPP-Seq) to examine the performance of ctDNA in mutational genotyping and disease burden measurement in large B-cell lymphomas. We explore the utility of ctDNA quantification before and during therapy for predicting event-free survival (EFS) at 24 months, an important disease milestone in DLBCL,20,21 and overall survival (OS). In a training and validation context, we define thresholds for molecular response capable of predicting outcomes after as little as a single cycle of therapy. Finally, we assess the utility of ctDNA in the context of established prognostic tools, demonstrating independent value for prediction of outcomes.
PATIENTS AND METHODS
Patients and Sample Collection
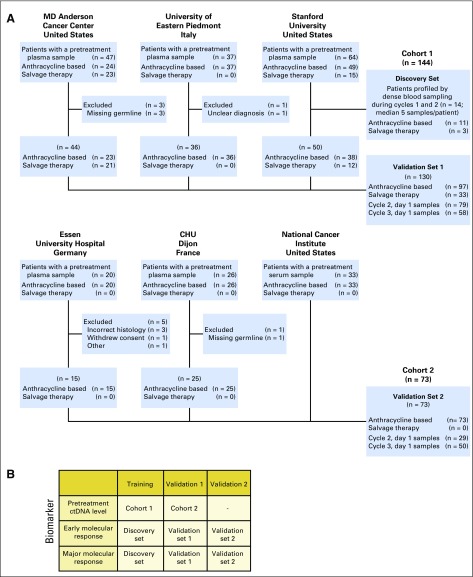
To study the dynamics of ctDNA in aggressive B-cell non-Hodgkin lymphomas, we enrolled patients with large B-cell lymphomas undergoing treatment at six institutions across North America and Europe. Patients were enrolled separately at each institution for observational study of blood-based biomarkers with serial blood samples collected and stored locally. Samples were subsequently retrospectively analyzed centrally (Stanford University, Stanford, CA). Patients had a pathologic diagnosis of DLBCL or primary mediastinal large B-cell lymphoma according to the 2008 WHO criteria.22 Patients with an antecedent low-grade lymphoma with histologic transformation were considered eligible, as were patients with MYC and BCL2/BCL6 rearrangements. This study was approved by the local institutional review board of each institution, and all patients provided written informed consent. Patients were considered eligible if they fulfilled these diagnostic criteria, received curative-intent systemic therapy classified as either front-line or salvage, had pretreatment blood plasma or serum, and had a source of germline DNA. Samples from 227 patients were screened, with 217 patients evaluable for analysis (Appendix Fig A1A, online only).
To identify the optimal timing and thresholds for molecular response, we profiled samples throughout the first two cycles of therapy in a discovery set of 14 patients. After identifying the optimal timing and thresholds, we profiled samples before the first, second, and third cycles of therapy from an additional 203 patients across all six institutions.
We divided patients into two cohorts on the basis of site of enrollment. Patients from Stanford Cancer Center, MD Anderson Cancer Center (Houston, TX), and University of Eastern Piedmont (Novara, Italy) comprised cohort 1 (n = 144); 14 patients comprised the discovery set, and the remaining 130 comprised validation set 1. Patients from the National Cancer Institute (Bethesda, MD), Centre Hospitalier Universitaire Dijon (Dijon, France), and Essen University Hospital (Essen, Germany) comprised cohort 2 (n = 73), which also served as validation set 2 for molecular response thresholds. A group of 48 healthy adults served as controls for establishing specificity.23 Additional details on patient allocation are available in Appendix Fig A1B.
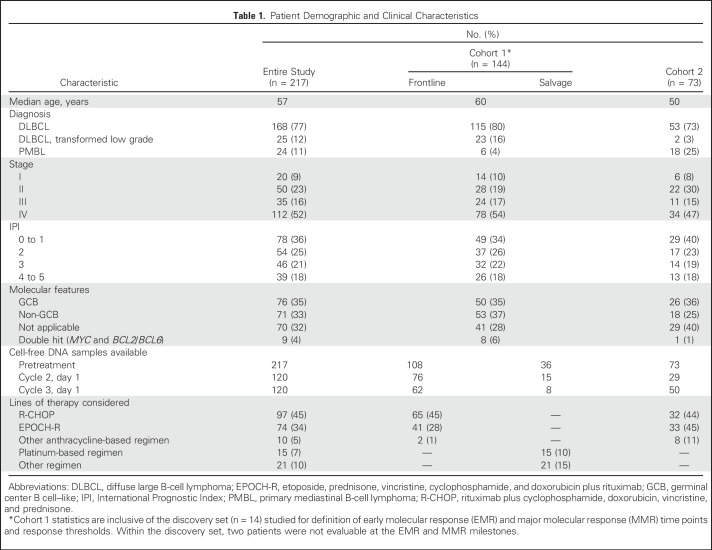
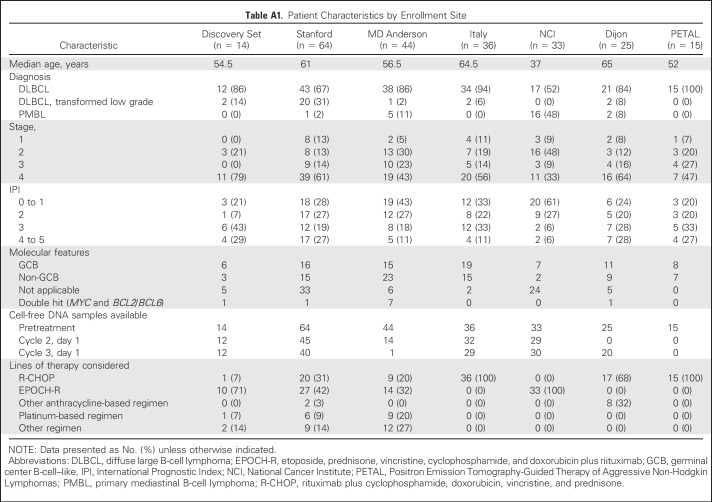
Patients were treated with combination immunochemotherapy according to local standards. Treatment was classified as either front-line or salvage, with front-line therapy being anthracycline and rituximab based. Survival analyses were performed separately for patients receiving front-line or salvage therapy. Patients in cohort 1 were largely treated with front-line therapy (frontline, 75%; salvage, 25%). Patients in cohort 2 were uniformly treated with front-line therapy. The characteristics of patients in this study are listed in Table 1 and in Appendix Table A1 (online only). Responses were assessed by end-of-therapy PET/CT according to guidelines.24 Interim PET/CT scans were available for patients treated at Stanford, MD Anderson, Essen, and Dijon. Interim PET/CT scans were performed after two to four cycles and interpreted according to Deauville criteria by local radiologists, with a score of 4 or 5 defined as positive.24 Across all cohorts, patients were enrolled from December 1999 to September 2016; follow-up concluded in February 2018, with a median follow-up time of 31.2 months. Additional details of individual cohorts are available in the Data Supplement.
Table 1.
Patient Demographic and Clinical Characteristics
Mutational Analysis and ctDNA Quantitation
We performed targeted sequencing by CAPP-Seq as previously described.23,25 Genes targeted by panels in this study are listed in the Data Supplement. Somatic mutations were identified by paired analysis of either tumor or pretreatment plasma/serum and germline DNA. Blood samples were assessed for ctDNA by tracking somatic alterations in pretreatment and serial samples. Quantitative levels of ctDNA were measured in haploid genome equivalents per milliliter (hGE/mL), determined as the product of total cell-free DNA concentration and the mean allele fraction of somatic mutations, expressed in log scale (log hGE/mL). A total of 850 specimens were profiled. All samples were deidentified before processing through uniform molecular biology, sequencing, and bioinformatic workflows (Data Supplement).
Statistical Analysis
Comparisons of continuous variables were performed by unpaired t test with Welch’s correction when assessing two sets or analysis of variance when assessing more than two sets. Survival probabilities were estimated using the Kaplan-Meier method; survival of groups was compared using the log-rank test. We considered two survival end points: EFS, where an event was defined as progression or relapse, unplanned retreatment of lymphoma, or death resulting from any cause, and overall survival (OS), where an event was defined as death resulting from any cause. Regression analysis of multiple covariates was conducted by Cox proportional hazards modeling, with P values assessed using the log-likelihood test. All P values were two-sided.
Potential confounding by guarantee-time bias in survival analyses on the basis of molecular response was mitigated by calculating survival from the time point of response assessment (landmark approach).26 For each analysis, survival was calculated from the time point of the latest assessment of interest; for example, survival in analyses investigating early molecular response (EMR) were calculated from the time of EMR assessment or the start of cycle 2. Analyses were performed with MATLAB (version 2017a; MathWorks, Natick, MA), R (version 3.4.1; R Foundation, Vienna, Austria), and GraphPad Prism software (version 7.0a; GraphPad, La Jolla, CA).
RESULTS
Detection of Genetic Alterations in Cell-Free DNA
We sequenced tumor or pretreatment cell-free DNA to identify somatic alterations for ctDNA quantitation and disease monitoring from all patients. All but two patients (215 [99%] of 217) had at least one tumor-specific alteration identified for tumor monitoring, with 95% of patients harboring more than five mutations. Patients had a sufficient number of mutations to enable tumor monitoring when genotyped from either tumor biopsies or pretreatment plasma (median, 160 and 117 mutations, respectively).
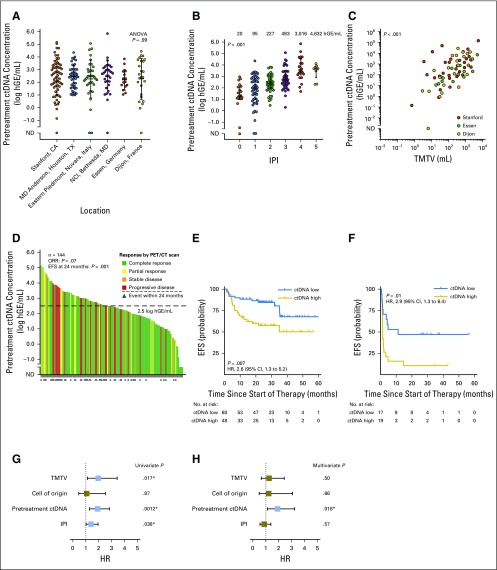
We detected ctDNA in 212 (98%) of 217 cell-free DNA samples before therapy. There was no significant difference in the burden of pretreatment ctDNA between sites of enrollment, allowing comparison between cohorts (Fig 1A). This suggests that quantitation of absolute ctDNA concentration is robust to preanalytic sample considerations. Pretreatment ctDNA was significantly associated with both IPI and total metabolic tumor volume27 (TMTV) in patients receiving front-line therapy (Figs 1B and 1C). This suggests ctDNA could serve as both a prognostic factor and a quantitative proxy for disease burden, another known prognostic factor for lymphomas.28
Fig 1.
Pretreatment circulating tumor DNA (ctDNA) is a robust biomarker in diffuse large B-cell lymphoma. (A) Stacked scatter plot of pretreatment ctDNA levels (mean and 95% CI) in study patients across cohorts. Cohort 1 is comprised of patients from Stanford (Stanford, CA), MD Anderson (Houston, TX), and Eastern Piedmont (Novara, Italy); Cohort 2 is comprised of patients from the NCI (Bethesda, MD), Essen University Hospital (Essen, Germany), and Centre Hospitalier Universitaire (Dijon, France) (B) Stacked scatter plot demonstrates the relationship between pretreatment ctDNA levels and International Prognostic Index (IPI). (C) Scatter plot shows the correlation between total metabolic tumor volume (TMTV) and ctDNA concentration. (D) Waterfall plot of pretreatment ctDNA levels (y-axis) for individual patients in cohort 1 (bars) and best responses by positron emission tomography/computed tomography (PET/CT; colors) and event-free survival (EFS) at 24 months (triangles). The threshold best separating patients for EFS is shown by a dashed line. The relationship between pretreatment ctDNA levels and overall response rate (ORR)/EFS at 24 months is also shown (Fisher’s exact test). (E, F) Kaplan-Meier estimates of EFS from the start of therapy for patients in cohort 1 stratified by pretreatment ctDNA levels are shown. (E) EFS in patients receiving front-line anthracycline-based therapy; (F) EFS in patients receiving salvage therapy. (G, H) Results of univariable and multivariable proportional hazards models for EFS are shown in patients with TMTV data available. Full results of the proportional hazards models are shown in Appendix Table A3. ANOVA, analysis of variance; hGE, haploid genome equivalent; HR, hazard ratio; NCI, National Cancer Institute; ND, not detected. (*) Significant.
Prognostic Value of Pretreatment ctDNA
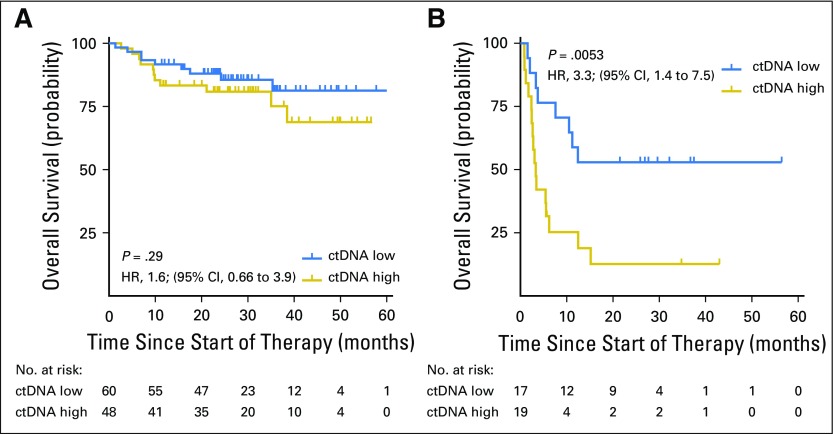
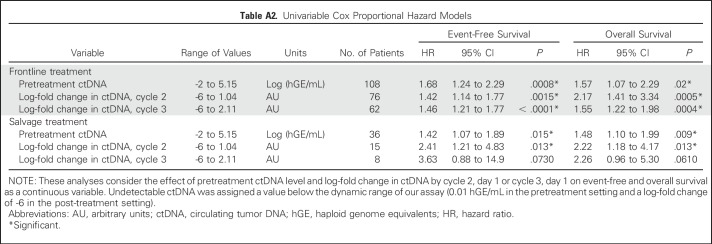
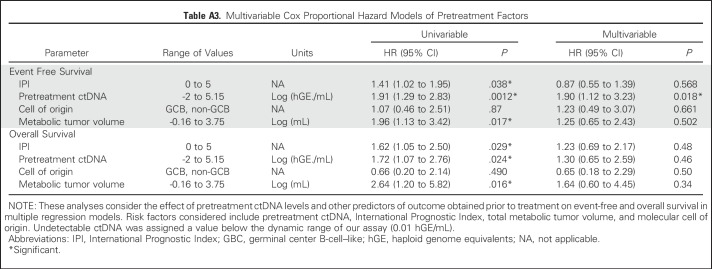
We next examined the effect of pretreatment ctDNA on outcomes in patients from cohort 1. Levels of ctDNA were continuously associated with both EFS and OS in patients receiving either front-line or salvage therapy (Appendix Table A2, online only). We then determined an optimized threshold to stratify EFS in patients from cohort 1 by bootstrap resampling (Appendix Fig A2A, online only). Using this threshold of 2.5 log hGE/mL of ctDNA, patients with high levels had significantly inferior rates of EFS at 24 months than those with low levels (Fig 1D). This association was significant for EFS in both front-line and salvage settings (front-line: hazard ratio, 2.6; P = .007; salvage: hazard ratio, 2.9; P = .01; Figs 1E and 1F). Furthermore, high levels of ctDNA predicted significantly worse OS in the salvage setting (Appendix Fig A3, online only). In multivariable analysis, pretreatment ctDNA remained prognostic for EFS in patients receiving front-line treatment when controlling for IPI, molecular subtype, and TMTV (Figs 1G and 1H; Appendix Table A3, online only).
Dynamics of ctDNA During Therapy Correlate With Disease Response
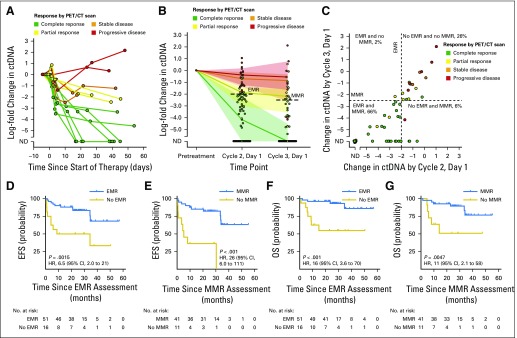
Interestingly, although baseline ctDNA level was prognostic for outcome, there was only a nonsignificant trend for association with standardized best response category (P = .07; Fig 1D). We therefore hypothesized that early ctDNA dynamics during therapy might better predict response. To define the optimal timing and thresholds to predict therapy response, we observed densely timed serial plasma samples during the first three cycles in a discovery set of 14 patients. Levels changed rapidly, such that patients achieving an eventual complete response had a large drop in ctDNA within 1 week (Fig 2A). We next used the change in ctDNA from baseline at various time points to predict the best PET/CT response assessment (Appendix Fig A2B). Changes in ctDNA were prognostic of complete response; by the midpoint of the first cycle (6 to 16 days), patients could be perfectly discriminated as responders and nonresponders. By the start of cycle 2 of therapy (ie, 21 days after start of therapy), a clear separation between groups emerged, with a 100-fold or 2-log drop in ctDNA predicting an eventual complete response. A similar 2.5-log drop by the start of cycle 3 also separated responders from nonresponders (Fig 2A).
Fig 2.
Dynamics of circulating tumor DNA (ctDNA) during therapy. (A) The dynamics of ctDNA during the first two cycles of therapy in 14 patients comprising the discovery set are shown as a spider plot. Levels of ctDNA are normalized to pretreatment levels; dots represent individual ctDNA measurements. Each line is colored according to the patient’s best response to therapy measured by positron emission tomography/computed tomography (PET/CT). (B) The population dynamics of ctDNA during the first two cycles of therapy in cohort 1. Patients were grouped on the basis of their best PET/CT response. The line and confidence envelope represent the median ctDNA level and interquartile range, respectively. The changes in ctDNA levels at cycle 2, day 1, and cycle 3, day 1, for individual patients are shown as a scatter plot. Dashed lines represent the thresholds for early molecular response (EMR) and major molecular response (MMR). (C) The log-fold change in ctDNA by cycle 2, day 1, and by cycle 3, day 1, in patients from cohort 1 for whom both time points were evaluable. The thresholds for EMR and MMR are shown as vertical and horizontal lines, respectively. Although 92% of patients showed concordant EMR and MMR status, one patient (2%) achieved EMR that did not translate to MMR (and was ultimately associated with a partial response as the best PET response). Conversely, 6% of patients achieved MMR without having achieved EMR. Points are colored according to the best response obtained by each patient. (D-G) Kaplan-Meier estimates demonstrate the event-free (EFS) and overall survival (OS) for patients in validation set 1 receiving front-line therapy on the basis of EMR or MMR. (D, E) EFS for patients on the basis of EMR and MMR, respectively. (F, G) OS for patients on the basis of EMR and MMR, respectively. Survival is calculated from (D, F) the time of EMR assessment or (E, G) the time of MMR assessment. HR, hazard ratio; ND, not detected.
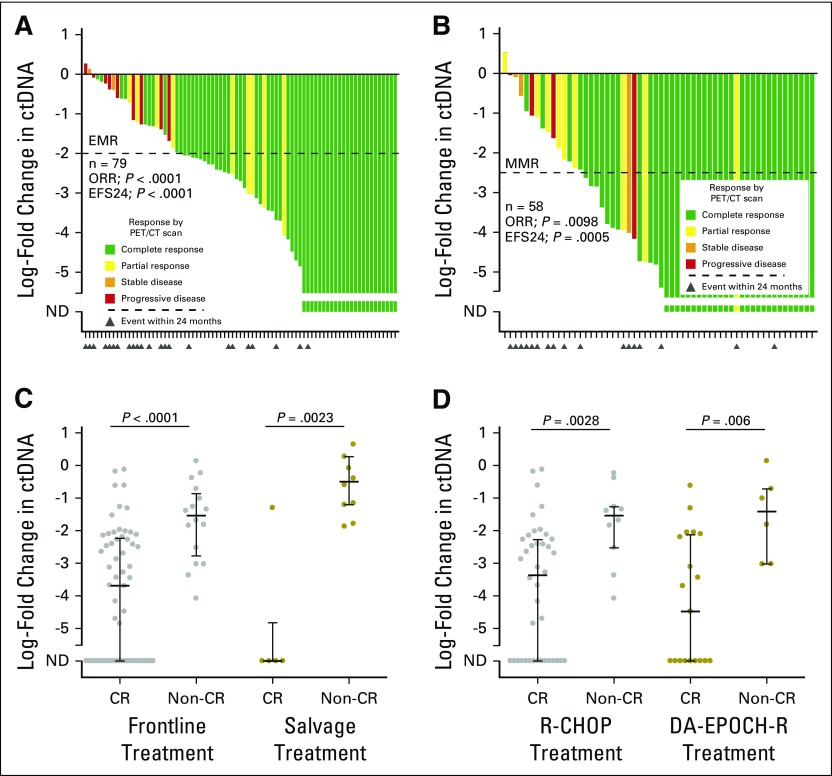
Having observed this effect in our discovery set, we further explored the dynamics of ctDNA in all patients from cohort 1. We assessed the change in ctDNA at the start of cycle 2 and cycle 3 of therapy for patients achieving standardized best response categories according to end of therapy PET/CT scans.24 As in the discovery set, the decline in ctDNA after a single cycle was larger in responders than in nonresponders (Fig 2B; Appendix Fig A4A and A4B, online only). This was true regardless of the line (ie, front line v salvage) or type of therapy (ie, R-CHOP v dose-adjusted etoposide, doxorubicin, cyclophosphamide, vincristine, and prednisone plus rituximab [EPOCH-R]; Appendix Fig A4C and A4D). These consistent findings confirm the prognostic value of ctDNA when assessing response to diverse systemic regimens, whether administered at diagnosis or relapse.
Furthermore, we found that our previously discovered 2-log drop in ctDNA by the start of cycle 2 separated patients achieving a complete response from those who did not (Fig 2B); this threshold was therefore defined as an early molecular response (EMR). Similarly, a 2.5-log drop by the start of cycle 3 was defined as a major molecular response (MMR). Importantly, these thresholds initially found in the discovery set were further confirmed to be the optimum thresholds for determining EFS using bootstrap resampling (Appendix Fig A2C and A2D). Notably, EMR and MMR were concordant in 92% of patients (57 of 62) in whom both were evaluable, demonstrating robust performance of molecular response (Fig 2C).
EMR and MMR Predict Survival in DLBCL
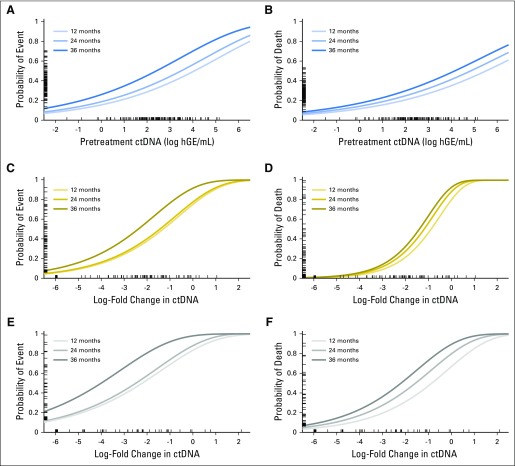
We next explored the association between ctDNA dynamics and survival. Similar to pretreatment ctDNA levels, the change in ctDNA after one or two cycles of therapy was continuously associated with both EFS and OS (Appendix Table A2). However, changes in ctDNA corresponded to a wider dynamic range of outcome predictions compared with pretreatment levels, suggesting its importance as a prognostic factor (Appendix Fig A5, online only).
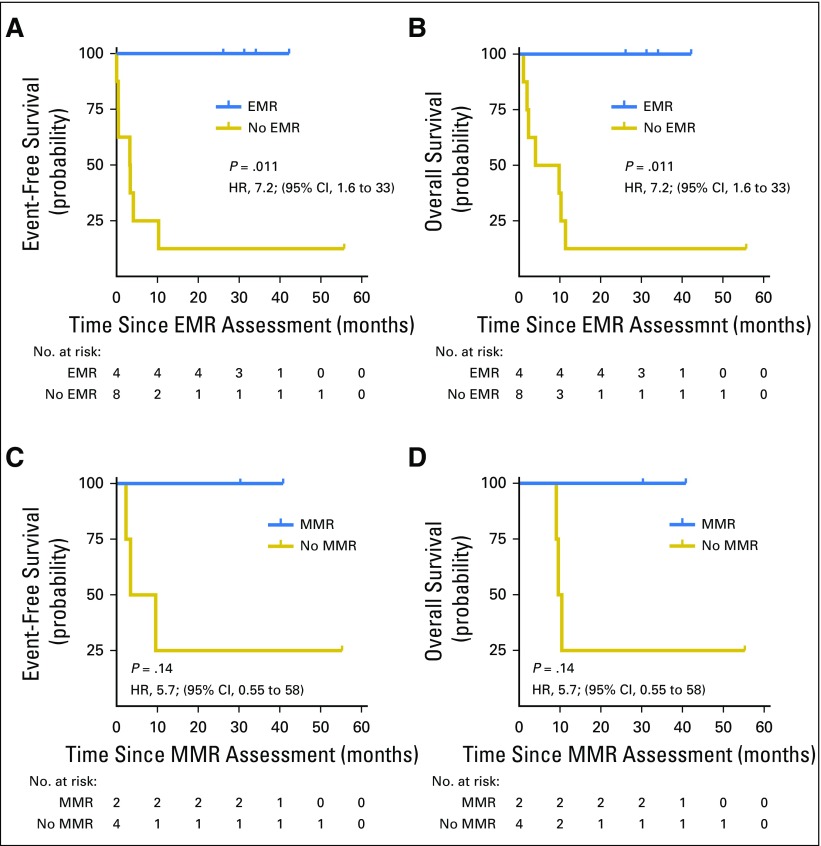
We further assessed the performance of EMR and MMR thresholds for predicting survival in the first validation set. Here, EMR and MMR were prognostic for both EFS and OS in patients receiving front-line therapy (EMR, P = .0015 and P < .001; MMR, P < .001 and P = .0047, respectively; Figs 2D to 2G). EMR was also prognostic for both EFS and OS in patients receiving salvage therapy (P = .011 and P = .011, respectively; Appendix Fig A6, online only); too few patients receiving salvage therapy had data available to evaluate MMR in this subgroup.
Independent Validation of Prognostic Significance of Pretreatment ctDNA, EMR, and MMR
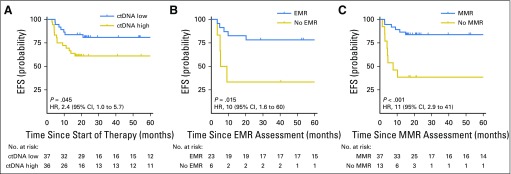
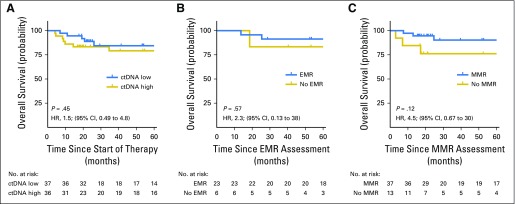
To further confirm the prognostic significance of pretreatment ctDNA and molecular response, we assessed their performance in a second validation set of patients receiving front-line therapy. As in cohort 1, patients with lower pretreatment ctDNA levels (< 2.5 log hGE/mL) had superior EFS (Fig 3A). Similarly, patients in validation set 2 achieving either EMR or MMR had significantly better EFS than patients who did not (Figs 3B and 3C). The magnitude of these effects was similar between validation set 1 and validation set 2. These associations were not significant for OS in validation set 2, although this analysis was limited by the small cohort and a low number of events (Appendix Fig A7, online only).
Fig 3.
Validation of the prognostic value of circulating tumor DNA (ctDNA). (A) Kaplan-Meier estimates of event-free survival (EFS) from the start of therapy for patients in cohort 2 stratified by pretreatment ctDNA levels are shown. The cut point separating high from low ctDNA was determined in cohort 1. (B) Kaplan-Meier estimates of EFS from the time of early molecular response (EMR) assessment for patients in validation set 2 achieving or not achieving EMR. (C) Kaplan-Meier estimates of EFS from the time of major molecular response (MMR) assessment for patients in validation set 2 achieving or not achieving MMR.
Prognostic Value of ctDNA Measurements Is Independent of IPI and Interim Imaging Studies
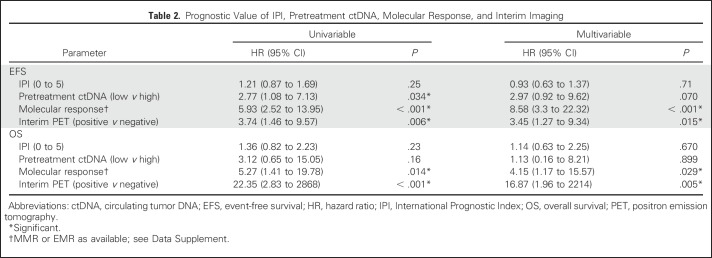
Finally, we assessed the ability of ctDNA dynamics to predict outcomes for patients in the context of established risk factors, including IPI and interim PET/CT. We performed a multivariable analysis of patients across both cohorts who were evaluable for molecular response (MMR or EMR as available; Data Supplement) and also had an interim PET/CT scan. Here, the change in ctDNA remained significantly prognostic for both EFS and OS (Table 2).
Table 2.
Prognostic Value of IPI, Pretreatment ctDNA, Molecular Response, and Interim Imaging
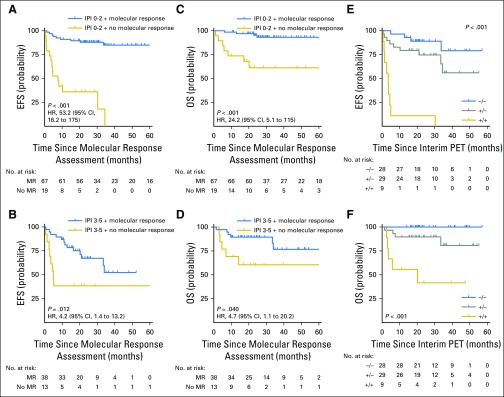
We further assessed the ability of molecular response to predict outcomes in subsets of patients defined by IPI and interim PET/CT. Molecular response (MMR or EMR as available) remained prognostic for EFS and OS in patients with low (0 to 2) or high (3 to 5) IPI (Figs 4A to 4D). Furthermore, molecular response remained prognostic for both EFS and OS in the context of interim PET/CT. Patients with favorable results for both molecular response and interim PET had excellent outcomes. In contrast, the combination of a positive interim PET scan and no molecular response identified a group of patients at extremely high risk for treatment failure (Figs 4E and 4F).
Fig 4.
Prognostic value of molecular response is independent of International Prognostic Index (IPI) and interim imaging. (A, B) Kaplan-Meier estimates show the effect of molecular response on event-free survival (EFS) in patients receiving front-line therapy with (A) low-risk/low-intermediate-risk IPI (score, 0 to 2) or (B) high-intermediate risk/high-risk IPI (score, 3 to 5). (C, D) Kaplan-Meier estimates show the effect of molecular response on overall survival (OS) in patients receiving front-line therapy with (C) low-risk/low-intermediate-risk IPI (score, 0 to 2) or (D) high-intermediate-risk/high-risk IPI (score, 3 to 5). (A-D) Survival is calculated from the time of molecular response assessment. (E, F) Kaplan-Meier estimates show the (E) EFS and (F) OS of patients on the basis of the combination of interim positron emission tomography/computed tomography (PET/CT) and molecular response assessment. Patients are divided into three groups: negative interim PET and molecular response (−/−), positive interim PET and no molecular response (+/+), and either positive interim PET or no molecular response but not both (+/−). Survival is calculated from the time of the latest response assessment (ie, interim PET/CT scan).
DISCUSSION
Here, we assessed the utility of ctDNA profiling by targeted high-throughput sequencing for risk monitoring in DLBCL. By studying more than 200 patients from six centers, we demonstrate robust performance of ctDNA detection by CAPP-Seq. Specifically, we were able to identify more than 100 mutations to enable tumor monitoring in the median patient. Furthermore, ctDNA was detectable in 98% of patients, demonstrating its potentially universal applicability. We also demonstrate similar levels of ctDNA across sites of enrollment. This suggests ctDNA could serve as a biomarker in multicenter trials.
In addition, we explored the significance of pretreatment and dynamic ctDNA measurements for predicting outcomes. We found pretreatment levels to be prognostic, with a threshold of 2.5 log hGE/mL stratifying patients for EFS. Pretreatment ctDNA levels were highly correlated with both IPI and TMTV, suggesting its role as a surrogate for disease burden. Furthermore, pretreatment ctDNA was prognostic of EFS independently of IPI and TMTV, suggesting ctDNA could improve pretreatment risk stratification.
We found that ctDNA dynamics as early as 21 days into therapy were prognostic for patient outcomes. We discovered and validated optimal thresholds for the change in ctDNA during therapy to predict outcomes. These thresholds, including a 2-log drop in ctDNA after one cycle (EMR) and a 2.5-log drop after two cycles (MMR), predicted EFS during front-line therapy in two validation sets. In comparison with pretreatment levels, EMR and MMR demonstrated superior stratification of outcomes, indicating their importance as risk factors. Although EMR and MMR were prognostic for EFS in both validation sets, significant prognostic value for OS was only observed in validation set 1. This analysis was likely confounded by the low number of deaths in validation set 2. Prospective studies confirming the prognostic significance of EMR and MMR for OS will be useful.
Additionally, we found that pretreatment ctDNA and EMR were prognostic in both front-line and salvage settings, suggesting molecular response is potentially applicable regardless of line of therapy. However, it is important to note that cohort 2 focused exclusively on front-line therapy; thus, additional studies specific to salvage therapy will be essential. Furthermore, although our study was inclusive of all DLBCL subtypes, it was not powered to assess individual subgroups. Accordingly, EMR (n = 12) and MMR (n = 15) were not prognostic when considering patients with transformed indolent lymphomas receiving front-line therapy. Larger studies dedicated to specific subtypes such as transformed lymphomas will therefore be required.
Interestingly, the prognostic value of molecular response was independent of established factors; in multivariable analyses, both molecular response and interim PET/CT remained independently prognostic for survival. Moreover, the combination of molecular response and interim PET/CT response was able to robustly stratify EFS and OS. The identification of patients at exceptionally high risk (ie, interim PET/CT positive and not achieving EMR/MMR) could provide an opportunity for early intervention with alternative treatments, including autologous bone marrow transplantation or chimeric antigen receptor T cells.29-31 The identification of this highest-risk group could improve risk-adapted approaches that have previously failed to improve outcomes.6 Additional studies in patients with standardized interim PET/CT scans performed at uniform landmarks will be needed. Furthermore, studies to determine the natural history of patients achieving only molecular response but not interim imaging response, or vice versa, will be useful.
We envision early milestones such as EMR and MMR will be useful in many areas. EMR may be used in drug development as an early surrogate end point in trials.32 Alternatively, ctDNA quantitation could be used in clinical practice as a prognostic factor for individual patients. Finally, these biomarkers could guide personalized approaches in novel clinical trial designs. One first approach could include intensifying therapy for patients who do not achieve EMR/MMR and have a positive interim PET/CT scan. Additional studies exploring approaches for integrating ctDNA with traditional risk-assessment tools will be useful.
Although ctDNA assays are becoming increasingly common in the clinic, the success of molecularly driven approaches will require standardization, harmonization, and broad availability. Our data suggest that both pretreatment and dynamic assessments of ctDNA are feasible and can add to established risk factors. These approaches may allow novel clinical trial designs, with wide applicability to patients with DLBCL and potentially other lymphomas.
ACKNOWLEDGMENT
We thank the patients and their families who participated in this study. We thank Li Zhou and Rashi Krishnan for assistance with tissue banking. Custom software used in this work was previously published and is available by request for nonprofit use.
Appendix
Fig A1.
Patient recruitment flowchart and training/validation schema. (A) A flowchart depicts the patients and samples included in this study from each of the six participating institutions, and their allocation to cohorts used to discover/train time-points and response thresholds for the early molecular response and major molecular response, and to validate these indices. Samples were collected and stored at each of six independent centers. Patient samples were then sent to Stanford University for processing and study. (B) Table showing how patients were allocated for training and validation of each threshold described in this study.
Fig A2.
Identification of optimized cut-point for pretreatment circulating tumor DNA (ctDNA), early molecular response, and major molecular response. (A) Patients from cohort 1 (n = 144) were randomly sampled with replacement 2,000 times (bootstrap resampling). The threshold for pretreatment ctDNA that best separated patients for event-free survival was selected in each of these 2,000 datasets, when considering this threshold in quarter-log steps. The best cut-point from each of these 2,000 samples is shown on a histogram. (B) Top panels: Receiver operating characteristic curves using serial ctDNA measurements to predict eventual best response in the discovery set (Fig 2A). The optimum cut-point is labeled with a dot. Bottom panels: The performance of the optimum cut-point for prediction of eventual best response in the discovery set. (C) Bootstrap resampling of patients from cohort 1 as shown in panel A, but for cycle 2, day 1 ctDNA from patients with data available (n = 91). The best cut-point from each of these 2,000 samples is shown on a histogram. (D) Bootstrap resampling of patients from cohort 1 as shown in panel A, but for cycle 3, day 1 ctDNA from patients with data available (n = 70). The best cut-point from each of these 2,000 samples is shown on a histogram.
Fig A3.
Relationship of pretreatment circulating tumor DNA (ctDNA) levels and overall survival. Kaplan-Meier estimates of overall survival are shown for patients with ctDNA levels higher or lower than 2.5 log hGE/mL who received (A) frontline or (B) salvage therapy in cohort 1.
Fig A4.
The change in circulating tumor DNA (ctDNA) by the start of cycle 2 or 3 of therapy. (A) A waterfall plot demonstrates the log-fold change in ctDNA after one cycle of therapy in the validation set 1. Bars are colored according to best response by PET/CT; triangles represent events within 24 months of therapy. The threshold for an early molecular response (EMR) is shown with a dashed line. (B) Same as in (A), but for major molecular response (MMR) defined at the start of cycle 3. (C) A stacked scatter plot shows the log-fold change in ctDNA after one cycle of therapy for patients in cohort 1 treated with either frontline or salvage therapy, achieving or not achieving a complete response. (D) A stacked scatter plot shows the log-fold change in ctDNA after one cycle of therapy for patients in cohort 1 treated with either R-CHOP or DA-EPOCH-R, achieving or not achieving a complete response. The median and interquartile ranges are shown as lines. CR, complete response; DA-EPOCH-R, dose adjusted EPOCH-R; EFS24, event-free survival at 24 months; Non-CR, no complete response; ND, not detected; ORR, overall response rate.
Fig A5.
Relationship between circulating tumor DNA (ctDNA) as a continuous variable and survival. Here, the six panels demonstrate the relationship between pretreatment ctDNA levels (A, B) or the change in ctDNA levels after one (C, D) or two (E, F) cycles of therapy and event-free or overall survival as continuous variables in cohort 1. For each predictor (pretreatment ctDNA or change in ctDNA after one or two cycles), a univariate Cox proportional hazard model was built as described in the Data Supplement. The relationship between the predictor and the probability of event-free (A, C, E) or overall survival (B, D, F) are shown, with higher concentrations of ctDNA both prior to and during therapy predicting inferior survival. Three curves demonstrate the probability of event or death at 12, 24, and 36 months. The concentration or change in ctDNA is shown on the x-axis, with patient-values from cohort 1 shown as a rug plot. The corresponding probability of an event at 24 months for each patient is shown on the y-axis as an individual tick mark within each rug plot. ND, not detected.
Fig A6.
Early (EMR) and major molecular response (MMR) in salvage therapy. (A, B) Kaplan-Meier estimates demonstrate the event-free and overall survival for patients in validation set 1 who received salvage therapy based on EMR, calculated from the start of cycle 2. (C, D) Kaplan-Meier estimates demonstrate the event-free and overall survival for patients who received salvage therapy based on MMR, calculated from the start of cycle 3.
Fig A7.
Overall survival of validation cohort 2. (A) Kaplan-Meier estimates of overall survival from the start of therapy for patients in cohort 2 stratified by pretreatment circulating tumor DNA (ctDNA) levels are shown. The cut-point separating high from low ctDNA was determined in cohort 1. (B) Kaplan-Meier estimates of overall survival from the time of early molecular response (EMR) assessment for patients in validation set 2 achieving or not achieving EMR. (C) Kaplan-Meier estimates of overall survival from the time of major molecular response (MMR) assessment for patients in validation set 2 achieving or not achieving MMR.
Table A1.
Patient Characteristics by Enrollment Site
Table A2.
Univariable Cox Proportional Hazard Models
Table A3.
Multivariable Cox Proportional Hazard Models of Pretreatment Factors
Footnotes
Supported by Damon Runyon Cancer Research Foundation Grants No. DR-CI#71-14 (A.A.A.) and PST#09-16 (D.M.K.), an American Society of Hematology Scholar Award (A.A.A.), the V Foundation for Cancer Research Abeloff Scholar Award (A.A.A.), German Research Foundation Grant No. SCHE 1870/1-1 (F.S.), a Stanford Translational Research and Applied Medicine Pilot Grant (A.A.A., F.S.), the Conquer Cancer Foundation of the American Society of Clinical Oncology (D.M.K.), the Emerson Collective Cancer Research Fund (A.A.A.), the Stinehart/Reed Award (A.A.A.), National Cancer Institute Grants No. R01CA188298 (M.D., A.A.A.) and 1K99CA187192-01A1 (A.M.N.), Grant No. 1-DP2-CA186569 from the National Institutes of Health Director’s New Innovator Award Program, and the Ludwig Institute for Cancer Research.
Clinical trial information: NCT00398177, NCT00001563, NCT00001337, NCT00006436, and NCT00554164.
AUTHOR CONTRIBUTIONS
Conception and design: David M. Kurtz, Florian Scherer, Aaron M. Newman, Maximilian Diehn, Ash A. Alizadeh
Financial support: Maximilian Diehn, Ash A. Alizadeh
Administrative support: Ash A. Alizadeh
Provision of study materials or patients: David M. Kurtz, Lauren S. Maeda, Neel K. Gupta, Michael S. Khodadoust, Ranjana H. Advani, Ronald Levy, Ulrich Dührsen, Andreas Hüttmann, Michel Meignan, René-Olivier Casasnovas, Jason R. Westin, Mark Roschewski, Wyndham H. Wilson, Gianluca Gaidano, Davide Rossi, Ash A. Alizadeh
Collection and assembly of data: David M. Kurtz, Florian Scherer, Michael C. Jin, Joanne Soo, Alexander F.M. Craig, Jacob J. Chabon, Chih Long Liu, Lauren S. Maeda, Neel K. Gupta, Michael S. Khodadoust, Ranjana H. Advani, Ronald Levy, Ulrich Dührsen, Andreas Hüttmann, Michel Meignan, René-Olivier Casasnovas, Jason R. Westin, Mark Roschewski, Wyndham H. Wilson, Gianluca Gaidano, Davide Rossi
Data analysis and interpretation: David M. Kurtz, Florian Scherer, Michael C. Jin, Joanne Soo, Alexander F.M. Craig, Mohammad Shahrokh Esfahani, Jacob J. Chabon, Henning Stehr, Robert Tibshirani, Aaron M. Newman, Maximilian Diehn, Ash A. Alizadeh
Manuscript writing: All authors
Final approval of manuscript: All authors
Accountable for all aspects of the work: All authors
AUTHORS' DISCLOSURES OF POTENTIAL CONFLICTS OF INTEREST
Circulating Tumor DNA Measurements As Early Outcome Predictors in Diffuse Large B-Cell Lymphoma
The following represents disclosure information provided by authors of this manuscript. All relationships are considered compensated. Relationships are self-held unless noted. I = Immediate Family Member, Inst = My Institution. Relationships may not relate to the subject matter of this manuscript. For more information about ASCO's conflict of interest policy, please refer to www.asco.org/rwc or ascopubs.org/jco/site/ifc.
David M. Kurtz
Consulting or Advisory Role: Roche Molecular Diagnostics
Florian Scherer
No relationship to disclose
Michael C. Jin
No relationship to disclose
Joanne Soo
No relationship to disclose
Alexander F.M. Craig
No relationship to disclose
Mohammad Shahrokh Esfahani
No relationship to disclose
Jacob J. Chabon
Consulting or Advisory Role: Forty Seven
Henning Stehr
No relationship to disclose
Chih Long Liu
No relationship to disclose
Robert Tibshirani
No relationship to disclose
Lauren S. Maeda
No relationship to disclose
Neel K. Gupta
No relationship to disclose
Michael S. Khodadoust
No relationship to disclose
Ranjana H. Advani
Consulting or Advisory Role: Genentech/Roche, Bristol-Myers Squibb, Pharmacyclics, Gilead Sciences, Bayer HealthCare Pharmaceuticals, Cell Medica, Seattle Genetics, AstraZeneca, Autolus, Takeda Pharmaceuticals
Research Funding: Millennium Pharmaceuticals (Inst), Seattle Genetics (Inst), Genentech/Roche (Inst), Pharmacyclics (Inst), Janssen (Inst), Celgene (Inst), Agensys (Inst), Merck (Inst), Kura (Inst), Regeneron (Inst), Forty Seven (Inst)
Ronald Levy
Stock or Other Ownership: Merck, Kite Pharma, Five Prime Therapeutics
Consulting or Advisory Role: Five Prime Therapeutics, Kite Pharma, BeiGene, Inate Pharma, Immune Design, Corvus Pharmaceuticals, Checkmate Pharmaceuticals, Gigagen, Quadriga, Teneobio, Sutro, Nurd, Dragonfly, Abpro, Apexigen
Research Funding: Bristol-Myers Squibb (Inst), Pfizer (Inst), Pharmacyclics (Inst), MedImmune (Inst)
Travel, Accommodations, Expenses: Bristol-Myers Squibb, GlaxoSmithKline, MedImmune
Aaron M. Newman
Consulting or Advisory Role: Roche Molecular Diagnostics, CiberMed
Patents, Royalties, Other Intellectual Property: Patent entitled “Identification and use of circulating tumor markers” licensed to Roche Molecular
Ulrich Dührsen
Honoraria: Amgen, Roche
Research Funding: Amgen (Inst), Roche (Inst)
Andreas Hüttmann
No relationship to disclose
Michel Meignan
No relationship to disclose
René-Olivier Casasnovas
Honoraria: Roche/Genentech, Takeda Pharmaceuticals, Gilead Sciences, Sanofi, Bristol-Myers Squibb, Merck, AbbVie, Celgene, Janssen
Consulting or Advisory Role: Roche/Genentech, Takeda Pharmaceuticals, Gilead Sciences, Bristol-Myers Squibb, Merck, AbbVie, Celgene, Janssen
Research Funding: Roche/Genentech (Inst), Gilead Sciences (Inst)
Travel, Accommodations, Expenses: Roche/Genentech, Takeda Pharmaceuticals, Gilead Sciences, Janssen
Jason R. Westin
Consulting or Advisory Role: Apotex, Novartis, Kite Pharma, Celgene
Mark Roschewski
No relationship to disclose
Wyndham H. Wilson
No relationship to disclose
Gianluca Gaidano
Consulting or Advisory Role: AbbVie, Janssen Pharmaceuticals, Roche, Gilead Sciences, Morphosys
Davide Rossi
No relationship to disclose
Maximilian Diehn
Stock or Other Ownership: CiberMed
Consulting or Advisory Role: Roche
Research Funding: Varian Medical Systems
Patents, Royalties, Other Intellectual Property: Patent filings on circulating tumor DNA detection assigned to Stanford University (Inst), patent filings on tumor treatment resistance mechanisms assigned to Stanford University (Inst)
Travel, Accommodations, Expenses: Roche, Varian Medical Systems
Ash A. Alizadeh
Stock or Other Ownership: CiberMed, Forty Seven
Honoraria: Janssen Oncology
Consulting or Advisory Role: Celgene, Roche/Genentech, Gilead Sciences
Research Funding: Celgene
Patents, Royalties, Other Intellectual Property: Patent filings on circulating tumor DNA detection assigned to Stanford University (Inst)
Travel, Accommodations, Expenses: Roche, Gilead Sciences
REFERENCES
- 1.International Non-Hodgkin’s Lymphoma Prognostic Factors Project : A predictive model for aggressive non-Hodgkin’s lymphoma. N Engl J Med 329:987-994, 1993 [DOI] [PubMed] [Google Scholar]
- 2.Alizadeh AA, Eisen MB, Davis RE, et al. : Distinct types of diffuse large B-cell lymphoma identified by gene expression profiling. Nature 403:503-511, 2000 [DOI] [PubMed] [Google Scholar]
- 3.Rosenwald A, Wright G, Chan WC, et al. : The use of molecular profiling to predict survival after chemotherapy for diffuse large-B-cell lymphoma. N Engl J Med 346:1937-1947, 2002 [DOI] [PubMed] [Google Scholar]
- 4.Safar V, Dupuis J, Itti E, et al. : Interim [18F]fluorodeoxyglucose positron emission tomography scan in diffuse large B-cell lymphoma treated with anthracycline-based chemotherapy plus rituximab. J Clin Oncol 30:184-190, 2012 [DOI] [PubMed] [Google Scholar]
- 5.Moffitt AB, Dave SS: Clinical applications of the genomic landscape of aggressive non-Hodgkin lymphoma. J Clin Oncol 35:955-962, 2017 [DOI] [PubMed] [Google Scholar]
- 6.Moskowitz CH, Schöder H, Teruya-Feldstein J, et al. : Risk-adapted dose-dense immunochemotherapy determined by interim FDG-PET in advanced-stage diffuse large B-cell lymphoma. J Clin Oncol 28:1896-1903, 2010 [DOI] [PMC free article] [PubMed] [Google Scholar]
- 7.Stiff PJ, Unger JM, Cook JR, et al. : Autologous transplantation as consolidation for aggressive non-Hodgkin’s lymphoma. N Engl J Med 369:1681-1690, 2013 [DOI] [PMC free article] [PubMed] [Google Scholar]
- 8.Leonard JP, Kolibaba KS, Reeves JA, et al. : Randomized phase II study of R-CHOP with or without bortezomib in previously untreated patients with non-germinal center B-cell-like diffuse large B-cell lymphoma. J Clin Oncol 35:3538-3546, 2017 [DOI] [PubMed] [Google Scholar]
- 9.Swinnen LJ, Li H, Quon A, et al. : Response-adapted therapy for aggressive non-Hodgkin’s lymphomas based on early [18F] FDG-PET scanning: ECOG-ACRIN Cancer Research Group study (E3404). Br J Haematol 170:56-65, 2015 [DOI] [PMC free article] [PubMed] [Google Scholar]
- 10.Casasnovas RO, Ysebaert L, Thieblemont C, et al. : FDG-PET-driven consolidation strategy in diffuse large B-cell lymphoma: Final results of a randomized phase 2 study. Blood 130:1315-1326, 2017 [DOI] [PubMed] [Google Scholar]
- 11.Chiappella A, Martelli M, Angelucci E, et al. : Rituximab-dose-dense chemotherapy with or without high-dose chemotherapy plus autologous stem-cell transplantation in high-risk diffuse large B-cell lymphoma (DLCL04): Final results of a multicentre, open-label, randomised, controlled, phase 3 study. Lancet Oncol 18:1076-1088, 2017 [DOI] [PubMed] [Google Scholar]
- 12.Hertzberg M, Gandhi MK, Trotman J, et al. : Early treatment intensification with R-ICE and 90Y-ibritumomab tiuxetan (Zevalin)-BEAM stem cell transplantation in patients with high-risk diffuse large B-cell lymphoma patients and positive interim PET after 4 cycles of R-CHOP-14. Haematologica 102:356-363, 2017 [DOI] [PMC free article] [PubMed] [Google Scholar]
- 13.Kurtz DM, Green MR, Bratman SV, et al. : Noninvasive monitoring of diffuse large B-cell lymphoma by immunoglobulin high-throughput sequencing. Blood 125:3679-3687, 2015 [DOI] [PMC free article] [PubMed] [Google Scholar]
- 14.Roschewski M, Dunleavy K, Pittaluga S, et al. : Circulating tumour DNA and CT monitoring in patients with untreated diffuse large B-cell lymphoma: A correlative biomarker study. Lancet Oncol 16:541-549, 2015 [DOI] [PMC free article] [PubMed] [Google Scholar]
- 15.Scherer F, Kurtz DM, Newman AM, et al. : Distinct biological subtypes and patterns of genome evolution in lymphoma revealed by circulating tumor DNA. Sci Transl Med 8:364ra155, 2016 [DOI] [PMC free article] [PubMed] [Google Scholar]
- 16.Herrera AF, Armand P: Minimal residual disease assessment in lymphoma: Methods and applications. J Clin Oncol 35:3877-3887, 2017 [DOI] [PMC free article] [PubMed] [Google Scholar]
- 17.Rossi D, Diop F, Spaccarotella E, et al. : Diffuse large B-cell lymphoma genotyping on the liquid biopsy. Blood 129:1947-1957, 2017 [DOI] [PubMed] [Google Scholar]
- 18.Roschewski M, Staudt LM, Wilson WH: Dynamic monitoring of circulating tumor DNA in non-Hodgkin lymphoma. Blood 127:3127-3132, 2016 [DOI] [PMC free article] [PubMed] [Google Scholar]
- 19.Scherer F, Kurtz DM, Diehn M, et al. : High-throughput sequencing for noninvasive disease detection in hematologic malignancies. Blood 130:440-452, 2017 [DOI] [PMC free article] [PubMed] [Google Scholar]
- 20.Maurer MJ, Ghesquières H, Jais JP, et al. : Event-free survival at 24 months is a robust end point for disease-related outcome in diffuse large B-cell lymphoma treated with immunochemotherapy. J Clin Oncol 32:1066-1073, 2014 [DOI] [PMC free article] [PubMed] [Google Scholar]
- 21.Jakobsen LH, Bøgsted M, Brown PN, et al. : Minimal loss of lifetime for patients with diffuse large B-cell lymphoma in remission and event free 24 months after treatment: A Danish population-based study. J Clin Oncol 35:778-784, 2017 [DOI] [PubMed] [Google Scholar]
- 22. Swedlow SH, Campo E, Harris NL, et al. WHO Classification of Tumours of Haematopoietic and Lymphoid Tissues (ed 4). Lyon, France, IARC Press, 2008. [Google Scholar]
- 23.Newman AM, Lovejoy AF, Klass DM, et al. : Integrated digital error suppression for improved detection of circulating tumor DNA. Nat Biotechnol 34:547-555, 2016 [DOI] [PMC free article] [PubMed] [Google Scholar]
- 24.Cheson BD, Fisher RI, Barrington SF, et al. : Recommendations for initial evaluation, staging, and response assessment of Hodgkin and non-Hodgkin lymphoma: the Lugano classification. J Clin Oncol 32:3059-3068, 2014 [DOI] [PMC free article] [PubMed] [Google Scholar]
- 25.Newman AM, Bratman SV, To J, et al. : An ultrasensitive method for quantitating circulating tumor DNA with broad patient coverage. Nat Med 20:548-554, 2014 [DOI] [PMC free article] [PubMed] [Google Scholar]
- 26.Giobbie-Hurder A, Gelber RD, Regan MM: Challenges of guarantee-time bias. J Clin Oncol 31:2963-2969, 2013 [DOI] [PMC free article] [PubMed] [Google Scholar]
- 27.Meignan M, Sasanelli M, Casasnovas RO, et al. : Metabolic tumour volumes measured at staging in lymphoma: methodological evaluation on phantom experiments and patients. Eur J Nucl Med Mol Imaging 41:1113-1122, 2014 [DOI] [PubMed] [Google Scholar]
- 28.Cottereau AS, Lanic H, Mareschal S, et al. : Molecular profile and FDG-PET/CT total metabolic tumor volume improve risk classification at diagnosis for patients with diffuse large B-cell lymphoma. Clin Cancer Res 22:3801-3809, 2016 [DOI] [PubMed] [Google Scholar]
- 29. Neelapu SS, Locke FL, Bartlett NL, et al: Axicabtagene ciloleucel CAR T-cell therapy in refractory large B-cell lymphoma. N Engl J Med 377:2531-2544, 2017. [DOI] [PMC free article] [PubMed]
- 30. Schuster SJ, Svoboda J, Chong EA, et al: Chimeric antigen receptor T cells in refractory B-cell lymphomas. N Engl J Med 377:2545-2554, 2017. [DOI] [PMC free article] [PubMed]
- 31.Kochenderfer JN, Dudley ME, Kassim SH, et al. : Chemotherapy-refractory diffuse large B-cell lymphoma and indolent B-cell malignancies can be effectively treated with autologous T cells expressing an anti-CD19 chimeric antigen receptor. J Clin Oncol 33:540-549, 2015 [DOI] [PMC free article] [PubMed] [Google Scholar]
- 32.Shi Q, Flowers CR, Hiddemann W, et al. : Thirty-month complete response as a surrogate end point in first-line follicular lymphoma therapy: An individual patient-level analysis of multiple randomized trials. J Clin Oncol 35:552-560, 2017 [DOI] [PubMed] [Google Scholar]


