Abstract
Purpose
Pancreatic ductal adenocarcinoma (PDAC) has a poor prognosis, with a 5-year survival of < 10% because of diffuse symptoms leading to late-stage diagnosis. That survival could increase significantly if localized tumors could be detected early. Therefore, we used multiparametric analysis of blood samples to obtain a novel biomarker signature of early-stage PDAC. The signature was derived from a large patient cohort, including patients with well-defined early-stage (I and II) PDAC. This biomarker signature was validated subsequently in an independent patient cohort.
Patients and Methods
The biomarker signature was derived from a case-control study, using a Scandinavian cohort, consisting of 16 patients with stage I, 132 patients with stage II, 65 patients with stage III, and 230 patients with stage IV PDAC, and 888 controls. This signature was validated subsequently in an independent case-control cohort in the United States with 15 patients with stage I, 75 patients with stage II, 15 patients with stage III, and 38 patients with stage IV PDAC, and 219 controls. An antibody microarray platform was used to identify the serum biomarker signature associated with early-stage PDAC.
Results
Using the Scandinavian case-control study, a biomarker signature was created, discriminating samples derived from patients with stage I and II from those from controls with a receiver operating characteristic area under the curve value of 0.96. This signature, consisting of 29 biomarkers, was then validated in an independent case-control study in the United States. The biomarker signature could discriminate patients with stage I and II PDAC from controls in this independent patient cohort with a receiver operating characteristic area under the curve value of 0.96.
Conclusion
This serum biomarker signature might represent a tenable approach to detecting early-stage, localized PDAC if these findings are supported by a prospective validation study.
INTRODUCTION
The incidence of pancreatic ductal adenocarcinoma (PDAC) is increasing and has been the cause of death in 330,400 patients worldwide.1 PDAC is one of the most lethal cancers, with a 5-year survival of < 10%.2-4 It is expected that, by 2030, PDAC will become the second leading cause of death as a result of cancer.5 One factor behind this dismal development is diffuse symptoms resulting in late diagnosis, when only approximately 15% of patients present with a resectable tumor.2-4,6,7 Consequently, because surgical resection is the only potentially curative treatment of PDAC, earlier detection is required. In line with this, if localized tumors could be resected, the 5-year survival has been shown to increase from 43% (stage II) to > 50% (stage I).8 Furthermore, pancreatic tumors have been reported to be resectable at an asymptomatic stage 6 months before clinical diagnosis.9,10 A recent surveillance study of asymptomatic high-risk patients carrying the CDKN2A mutation resulted in a 75% resection rate and a 24% 5-year survival, which is much improved compared with patients with sporadic PDAC.11 Taken together, it is reasonable to believe that earlier diagnosis would result in increased survival for patients with PDAC12,13 and that asymptomatic high-risk patients would benefit from effective surveillance.14
The most evaluated biomarker for PDAC so far, serum CA19-9, suffers from inadequate specificity, with elevated levels in several other indications, as well as a complete absence in patients who are genotypically Lewis a−b− (5% of the population). Consequently, the use of CA19-9 by itself is not recommended for screening15 or as evidence of recurrence,16 but only for disease monitoring after surgical resection.17 Therefore, the field of cancer diagnostics is focusing increasingly on multiparametric analysis18,19 of diagnostic20,21 and prediagnostic samples22,23 because this approach yields improved sensitivity and specificity, also in combination with CA19-9.24,25 In fact, it has been demonstrated that combinations of immunoregulatory and cancer-associated protein biomarkers can discriminate between patients with late-stage III and IV PDAC and healthy controls.26,27
In this study, we focused particularly on the analysis of patients with stage I and II PDAC, in a large retrospective Scandinavian case-control study, followed by validation of the identified biomarker signature in an independent case-control study in the United States.
PATIENTS AND METHODS
Study Designs
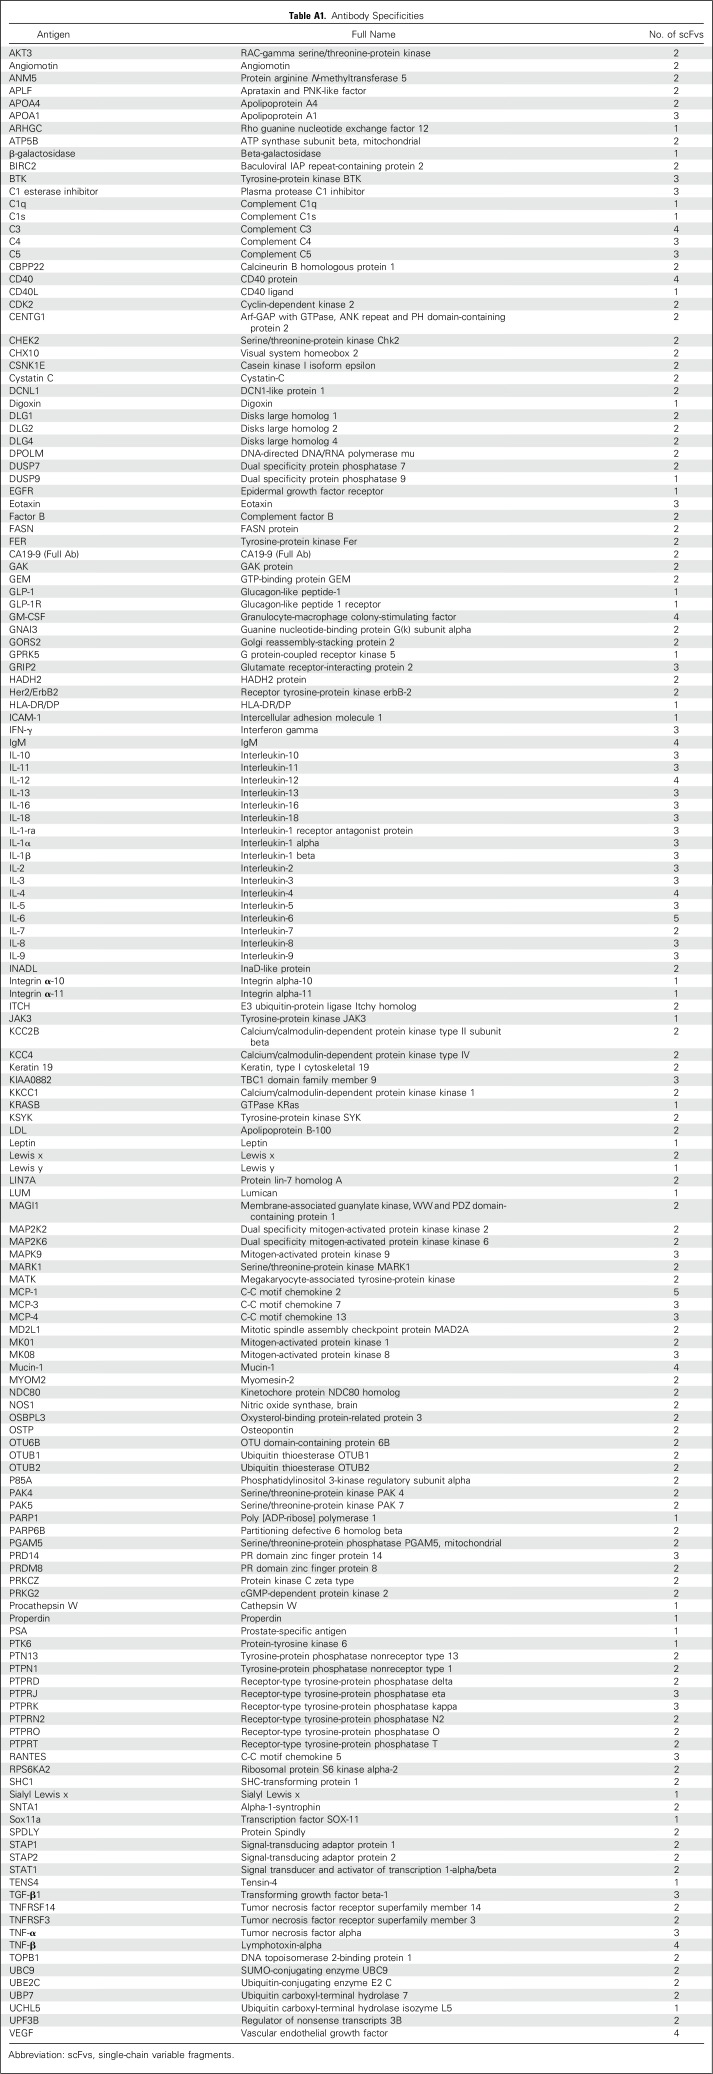
The two retrospective studies, performed on PDAC serum samples collected in Denmark and the United States, were conducted according to the Standards for Reporting Diagnostic Accuracy Studies.28 PDAC staging was performed according to the American Joint Committee on Cancer guidelines (7th Edition 2010). Blood samples from patients diagnosed with a lesion in the pancreas were collected and processed before resection or start of chemotherapy. Blood samples from normal controls (NC) were collected, using the same standard operating procedure. In both cases, 5 µL of the serum samples was used for the analysis, with a recombinant antibody microarray platform composed of 349 human recombinant single-chain variable fragments (scFvs) directed against 156 antigens (Appendix Table A1, online only). The rationale was to target the systemic response to disease, as well as the tumor secretome. Consequently, the selected biomarkers were involved mainly in immunoregulation.
Demographics of Study Cohorts
The Scandinavian cohort comprised 443 patients with PDAC, 888 NC, and eight patients with intraductal papillary mucinous neoplasms (IPMN; Table 1). The patients with PDAC and IPMN were recruited from the Danish Biomarkers in Patients With Pancreatic Cancer (BIOPAC) study. These patients were referred to hospitals in Copenhagen because of symptoms of cancer. The patients were diagnosed using computed tomography and were verified histologically. Sixteen PDAC samples were from patients with stage I, 132 were from patients with stage II, 65 were from patients with stage III, and 230 were from patients with stage IV PDAC (Table 1). The overall resection rate was 15%. Blood samples were collected the day before surgery from patients with stage I and II and IPMN, and the day before chemotherapy from patients with stage III and IV. Of the eight IPMN samples, five were benign and three were malignant.
Table 1.
Patient Demographics and Clinical Characteristics of the Scandinavian Cohort
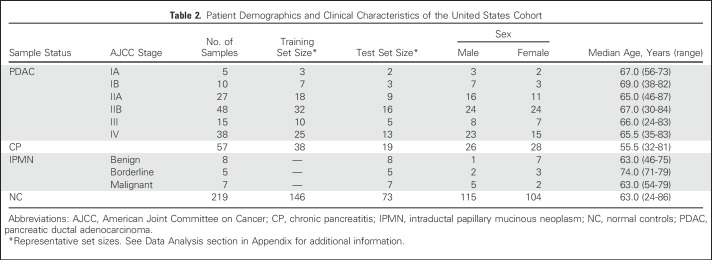
The cohort in the United States comprised 143 patients with PDAC, 57 patients with chronic pancreatitis (CP), and 20 patients with IPMN, as well as 219 patients with NC (Table 2). In general, these patients were referred to the Academic Medical Center of Oregon Health Sciences for symptomatic pancreatic disease determined by their local specialist. The diagnosis leading to surgery was based on imaging, followed by endoscopic ultrasound-guided biopsy to confirm cancer or IPMN before resection. The overall resection rate was 18% to 20%. Fifteen of the PDAC samples were from patients with stage I, 75 were from patients with stage II, 15 were from patients with stage III, and 38 were from patients with stage IV (Table 2). Of the 20 IPMN cases, eight were benign, five were borderline, and seven were malignant.
Table 2.
Patient Demographics and Clinical Characteristics of the United States Cohort
Data Analysis
To decipher a condensed biomarker signature, the data were divided into a training set including three quarters of the samples (approximately 1,000 samples) and a test set including one quarter of the samples (approximately 340 samples). The ratio of case versus control samples within the data sets was retained, but otherwise the sets were randomly generated. Four unique test and training sets were generated using this approach. An individual sample was included only once in a test set. To identify the biomarker signatures, a backward elimination (BE) algorithm was applied to each training set in R, excluding one antibody at a time. For each BE iteration, the antibody with the highest Kullback-Leibler divergence value obtained in the classification analysis was eliminated. On the basis of Kullback-Leibler divergence value analysis, the antibody combinations expressing the lowest values were used to design the predictive biomarker signature. Consequently, BE allows an unbiased selection of markers contributing orthogonal information, compared with other biomarkers.27
Of note, the BE process sometimes results in previously defined tumor markers, such as CA19-9 and Sialyl Lewis A in the case of PDAC, not being included in the signature, because they do not contribute enough orthogonal information. The identified biomarker signature was then used to build a prediction model by frozen support vector machine (SVM) in R, using only the training data set.29 Furthermore, to avoid overfitting, the model was tested on the corresponding test set, and its performance was assessed, using receiver operating characteristic (ROC) curves and area under the curve (AUC) values. To further minimize overinterpretation and to ensure robustness, this process was performed on all four training and test sets. In this manner, a prediction model classifying NC versus patients with PDAC stage I and II was built, and its performance was assessed, using ROC curves and AUC values. This was also repeated for samples derived from NC versus patients with PDAC stage III and IV.
Finally, to obtain a consensus signature with the highest predictive classification accuracy, data from all classifications of NC versus PDAC stages were combined. The predictive accuracy of this signature was then validated in an independent sample cohort in the United States (Appendix, online only).
RESULTS
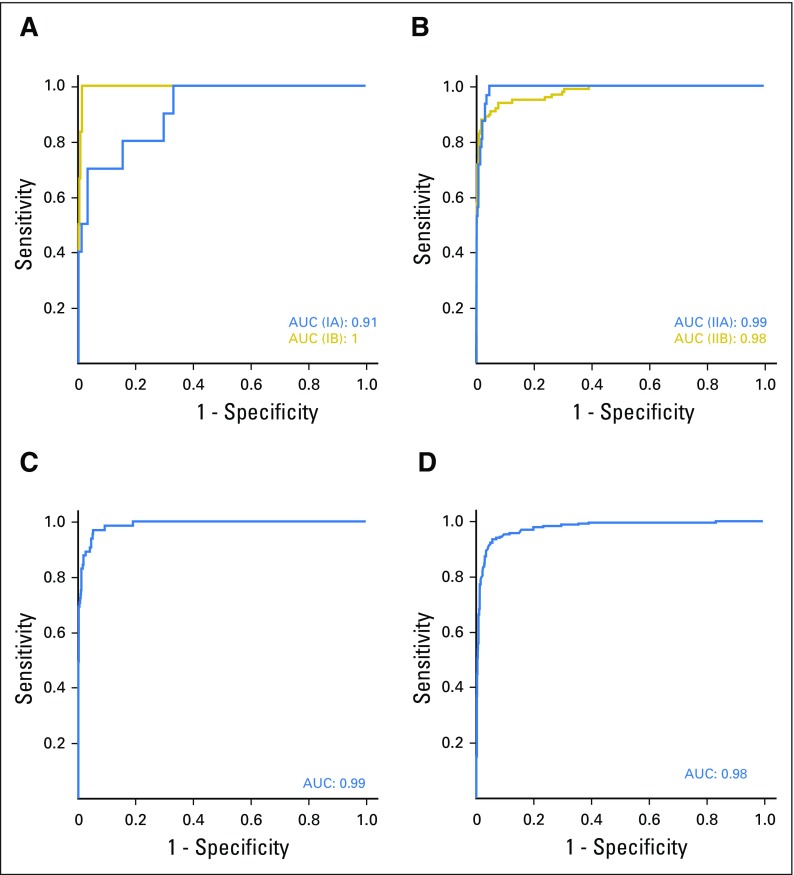
Two patient cohorts, one Scandinavian and one North American, including well-defined early-stage PDAC, were used to identify and validate a biomarker signature for detection of stage I and II cancer. The approach was based on a recombinant antibody microarray platform composed of 349 human recombinant scFvs directed against 156 antigens (Appendix Table A1). Because the focus was to interrogate the systemic response to PDAC, as well as its secretome, the selected antibodies targeted mainly immunoregulatory proteins. First, to interrogate the robustness of the data in the Scandinavian case-control discovery study, serum samples derived from patients with PDAC stage I to IV were compared with matched healthy controls, using a leave-one-out cross-validation strategy. The AUC values for NC versus stages IA, IB, IIA, IIB, III, and IV were 0.91, 1.0, 0.99, 0.98, 0.99, and 0.98, respectively (Fig 1).
Fig 1.
Classification of individual pancreatic ductal carcinoma stages in the Scandinavian cohort. All 349 antibodies were used to distinguish controls from patient samples of different pancreatic ductal adenocarcinoma (PDAC) stages, using support vector machine leave-one-out cross validation. The results are presented with receiver operating characteristic curves and their corresponding area under the curve (AUC) values for normal control (NC) v (A) stage I, (B) stage II, (C) stage III, and (D) stage IV PDAC.
Classifying PDAC Stage I and II With a Defined Biomarker Signature
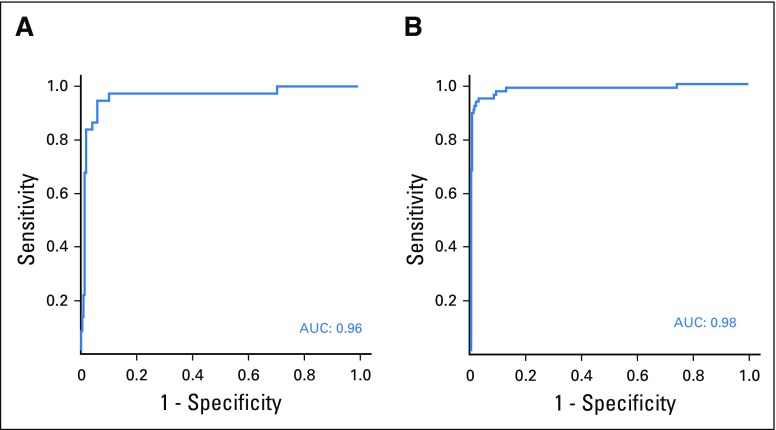
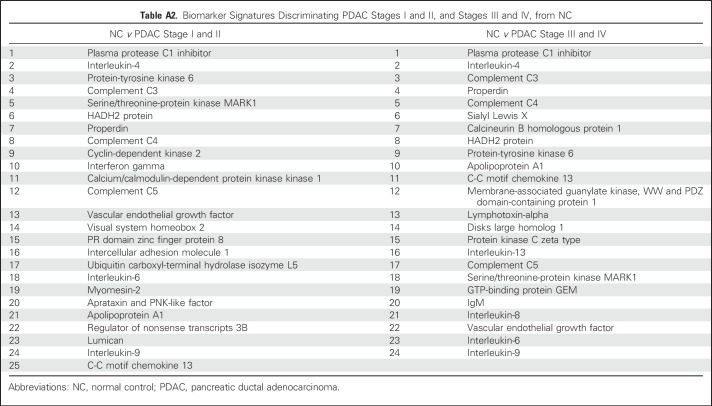
To identify the smallest biomarker signature discriminating PDAC stage I and II from NC with optimal predictive power, the SVM-based BE algorithm was applied to the Scandinavian sample cohort.26,29 Using this approach, biomarkers that do not improve the classification are eliminated, which results in a signature comprising only the highest-ranked biomarkers (Appendix Table A2, online only). The obtained AUC value for stage I and II versus NC was 0.96 (Fig 2A), correlating to a specificity/sensitivity combination of 94%/95% for NC versus stage I and II, which corresponds to 6% false-positives. For comparative reasons, the obtained AUC value for stage III and IV versus NC was 0.98 (Fig 2B). These values are based on an investigation of the statistical robustness and model stability, in which four randomly generated training and test sets were used, resulting in a mean AUC value of 0.963 (range, 0.94 to 0.98) for the classification of NC versus PDAC stage I and II. The corresponding value for NC versus stage III and IV was 0.985 (range, 0.98 to 0.99). Of note, the highest predictive signature did not include CA19-9, a Sialyl Lewis A antigen commonly involved in the analysis of PDAC, because it did not contribute orthogonal information.
Fig 2.
Classification of pancreatic ductal carcinoma stages in the Scandinavian cohort, using biomarker signatures. Using data from the Scandinavian study, predictive models that were based on frozen support vector machine were built. Two biomarker signatures were defined, using the backward elimination algorithm, for classification of (A) normal control (NC) samples from pancreatic ductal adenocarcinoma (PDAC) stage I and II, and (B) PDAC stage III and IV, respectively. The results are presented as receiver operating characteristic curves and their corresponding area under the curve (AUC) values.
Validating the Detection of Early-Stage I and II PDAC in an Independent Patient Cohort
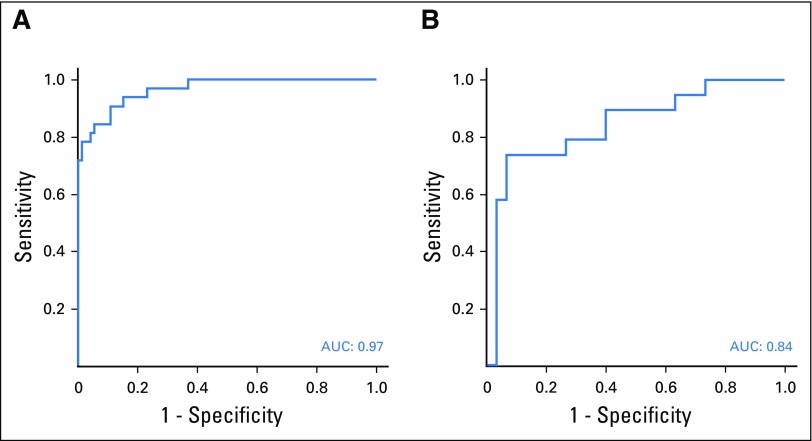
To obtain the highest predictive accuracy in the validation study, the highest ranked biomarkers (Appendix Table A2) were combined to obtain a consensus signature consisting of 29 biomarkers (Table 3). This signature was validated for the detection of patients with early-stage I and II PDAC versus NC, using samples derived from an independent cohort in the United States. The resulting ROC-AUC value was 0.963 (range, 0.94 to 0.98), on the basis of the three training sets (Fig 3A), correlating to a specificity/sensitivity combination of 95%/93% for stage I and II. The corresponding ROC-AUC value for stage III and IV was 0.97 (data not shown). The ROC-AUC value for discriminating CP, a potential confounding clinical factor, from PDAC stage I and II was 0.84 (Fig 3B).
Table 3.
Consensus Signature
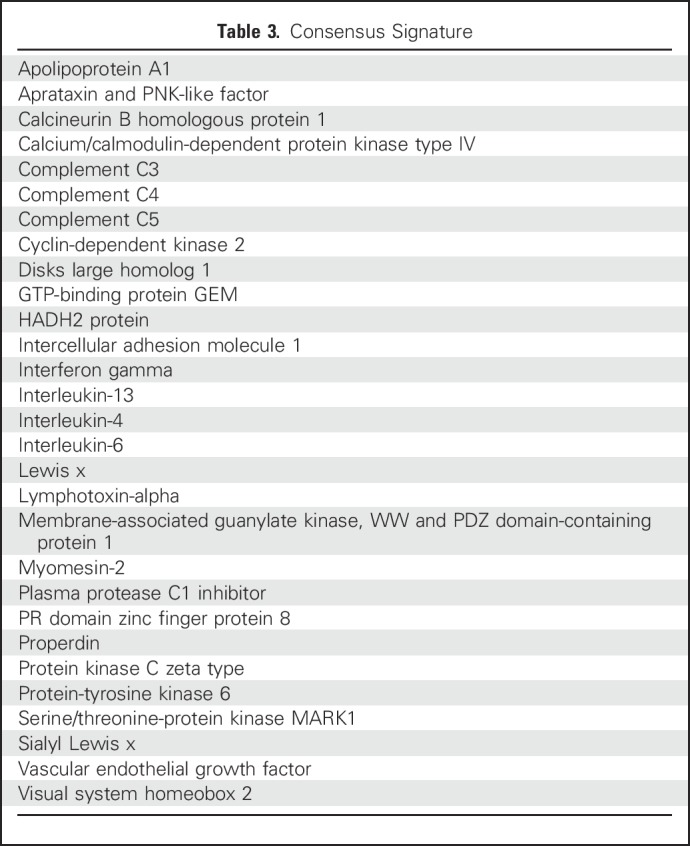
Fig 3.
Validation of the consensus signature in stage I and II pancreatic ductal carcinoma from the United States cohort. The consensus signature generated from the Scandinavian cohort was validated in the independent cohort in the United States by classifying (A) normal controls (NC) v patients with pancreatic ductal adenocarcinoma (PDAC) stage I and II, and (B) patients with PDAC stage I and II v patients with chronic pancreatitis (CP). The results are presented as representative receiver operating characteristic curves and their corresponding area under the curve (AUC) values.
Influence of Diabetes and Jaundice on Classification of Early-Stage PDAC
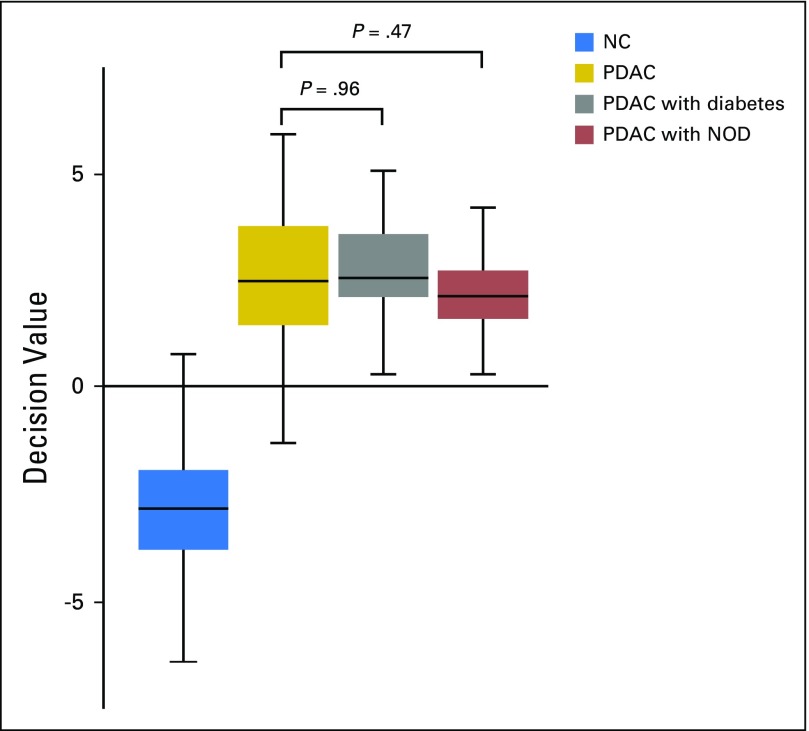
In the Scandinavian cohort, 103 (23.3%) of the patients with PDAC were diabetic (Appendix Table A3, online only), whereas 38 (26.6%) of the patients with PDAC in the United States cohort had diabetes, at the time of sample collection (Appendix Table A3). New-onset diabetes (NOD) comprised 26.2% of the patients with diabetes (n = 37) in both cohorts. Decision values from the SVM model were used to analyze any significant differences between diabetic and nondiabetic PDAC samples in the discovery cohort. This analysis indicated that diabetes, including NOD, is not a confounding factor in the classification of NC versus PDAC (P = .47 and .96, respectively; Appendix Fig A1, online only). The same approach applied on the validation cohort indicated that jaundice is not a confounding factor (P = .21).
Individual Serum Markers Associated With Different PDAC Stages
Individual biomarkers displaying a temporal expression pattern associated with progression from stage I to stage IV were also analyzed. By interrogating the data with multigroup analysis of variance, several biomarkers were identified that were differentially expressed in patients with early- versus late-stage PDAC. These included disks large homolog 1 (DLG1), PR domain zinc finger protein 8, and membrane-associated guanylate kinase, WW and PDZ domain-containing protein 1 (MAGI-1), which displayed increased expression in later stages, whereas properdin, lymphotoxin-alpha, and interleukin-2 (IL-2) were more highly expressed in the early stages of PDAC (Fig 4).
Fig 4.
Serum markers that are differentially expressed between different pancreatic ductal adenocarcinoma (PDAC) stages. Serum markers that were differentially expressed over progression from stage I to IV were identified by multigroup analysis of variance. Presented are the most significant markers. Roman numerals indicate PDAC stage. IL-2, interleukin-2; MAGI-1, membrane-associated guanylate kinase; PRDM8, PR domain zinc finger protein 8. *P < .05, q > 0.05; **P < .05, q < 0.05.
Classifying Intraductal Papillary Mucinous Neoplasm With the Validated Biomarker Signature
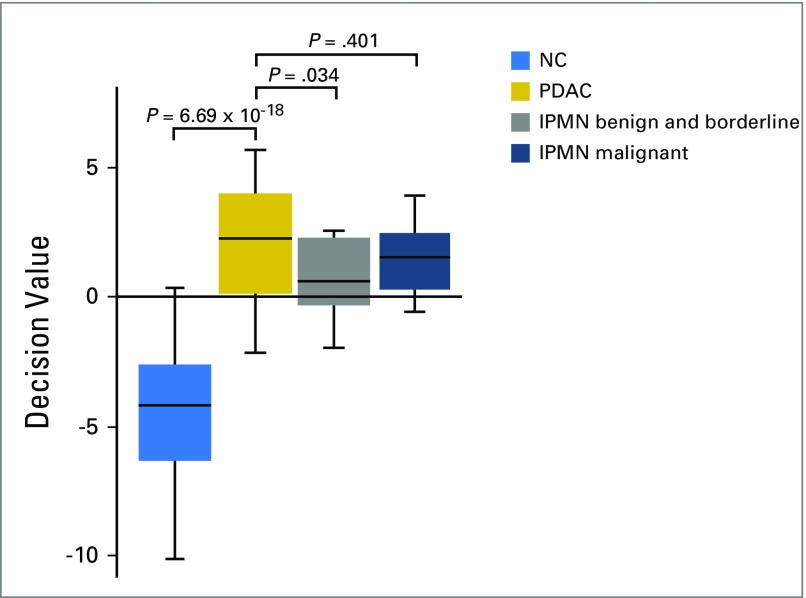
IPMN frequently progresses to invasive cancer if left untreated. Consequently, it is of clinical interest to detect such lesions so that they can be monitored by imaging, because this may present an opportunity for early resection of premalignant lesions. Therefore, the consensus signature was tested for its applicability in discriminating different stages of IPMN versus NC. Twenty IPMN samples derived from the patient cohort in the United States (Table 2) were classified using the validated biomarker signature. The signature classified the malignant IPMNs as having a cancer profile, whereas borderline and benign IPMNs were classified as non-PDAC (P = .034), after adjustment for multiple testing using the Benjamini-Hochberg approach, with a false-discovery rate of 0.05 (Appendix Fig A2, online only).
DISCUSSION
The key finding in this study is that a proteomic multiparametric analysis could discriminate patients with early-stage I and II PDAC from controls. If these results are supported by prospective validation studies, such a test might be clinically beneficial in the surveillance of (1) high-risk patients, such as patients with hereditary PDAC, CP, and Peutz-Jeghers syndrome; (2) patients with late-onset diabetes, who have an up to eight times increased risk of acquiring PDAC within the first 3 years of diabetes30,31; and (3) patients with vague abdominal symptoms.
The WHO has proposed that millions of patients with cancer could be saved from premature death if diagnosed and treated earlier. To achieve this, more advanced diagnostic approaches have to be developed and applied to earlier detection of lethal cancers such as PDAC. Despite the fact that the evolutionary trajectory of PDAC disease progression is discussed,32-34 the available clinical data today support the conclusion that earlier diagnosis leads to an overall survival of asymptomatic patients, because of an increased frequency of resectable tumors.4,8-11,35 With this in mind, we performed a large proteomic study on PDAC, including > 1,700 case-control samples. For determining the clinical usefulness of a biomarker signature in a population, the prevalence of PDAC affects both the positive predictive value (the probability that a positive test indicates disease) and the negative predictive value (the probability that a negative test indicates absence of disease). In our validation cohort in the United States, the results suggest that with a specificity as high as 99%, in patients with a higher risk of PDAC than that of the general public (eg, first-degree relatives [prevalence, 3.75%] and patients with NOD older than 55 years of age [prevalence, 1.0%]),36 the positive predictive value/negative predictive value would be 0.75/0.99 and 0.46/1.0, respectively. This signature, yielding the highest specificity/sensitivity for discriminating stage I and II from controls, did not include CA19-9, an antigen commonly involved in the analysis of PDAC, either alone or in combination with other markers.18 In fact, CA19-9 was analyzed on the antibody microarray but was not selected because it did not contribute enough orthogonal information during the BE process.
Because NOD in patients older than 55 years of age means a significant increased risk of acquiring PDAC,37 this can be considered an early indication of cancer, which could lead to early detection of asymptomatic, early-stage PDAC.38 Diagnosis of patients with diabetes with PDAC would therefore be of importance, because it would contribute to increased resectability and an increased survival in these patients. Consequently, we tested the consensus biomarker signature for its ability to discriminate between patients with diabetes with PDAC and those with PDAC without diagnosed diabetes. An SVM analysis, on the basis of a total of 141 patients with diabetes with PDAC from both cohorts, of whom 26.2% displayed NOD, demonstrated no significant difference between samples derived from patients with diabetes versus patients without diabetes with PDAC (Fig A1). This implies that the validated biomarker signature could potentially contribute to clinically rule out PDAC in patients with diabetes, although this has to be demonstrated in a clinical study focusing on patients with diabetes.
Differential diagnosis of PDAC versus pancreatitis is sometimes difficult, but in a previous study we demonstrated that late-stage PDAC could be distinguished from different pancreatic inflammatory indications.27 A follow-up study was performed previously on different pancreatitis subtypes, such as acute, chronic, and autoimmune pancreatitis, in which biomarkers associated with these subtypes could be identified and distinguished from PDAC.39 Even though the number of CP samples is limited in this study, we could demonstrate that CP could be discriminated from early-stage I and II PDAC, now with a ROC-AUC of 0.84 (Fig 3B). Furthermore, correct classification of premalignant lesions of the pancreas (IPMN) represents a considerable clinical value. The current consensus biomarker signature could discriminate samples derived from patients with pathologically staged benign and borderline IPMNs from patients with stage I and II PDAC (Fig A2), whereas malignant staged IPMNs were classified as cancer associated and could thus not be discriminated from PDAC. The limitation is that these results are based on a fairly low number of clinical samples; however, they could potentially contribute to the detection of these difficult-to-diagnose lesions, when validated in a larger IPMN case-control study.
Currently, we cannot offer a relevant biologic explanation for the inclusion of the proteins in the consensus signature, but relevant to cancer progression are gradual changes in the tumor microenvironment that can reflect back on the biomarker content in blood. Consequently, the clinical data were used to identify markers whose expression pattern varied with stage progression (ie, showed different levels in samples derived from patients with early- or late-stage PDAC). Five of the proteins in the consensus signature were associated with disease stage; most pronounced for DLG1, a multifunctional scaffolding protein that interacts with, for example, APC, β-catenin, and PTEN to regulate cell proliferation, cytokinesis, migration, and adhesion. Although a candidate tumor suppressor DLG1 exhibits oncogenic functions,40 MAGI-1 also exhibited an increased expression in samples derived from patients with late-stage PDAC. Cancer-related information is scarce, but MAGI-1 has been reported to both inhibit apoptosis and stimulate cell proliferation in human papillomavirus–induced malignancy.41 PR domain zinc finger protein 8, also known as BLIMP-1, was increased in samples from patients with late-stage disease. This DNA-binding protein regulates neural and steroid-related transcription and is a regulator of tumorigenesis in pituitary adenomas, where it most likely contributes to increased tumor invasiveness.42 This is consistent with our observation of its increased expression in patient samples of late-stage disease. Furthermore, lymphotoxin-alpha showed a lower expression in late-stage samples and is produced by type 1 T helper cells to induce phagocyte binding to endothelial cells. Some polymorphisms of this protein contribute to an increased risk of developing adenocarcinoma,43 although previously, mapping has shown low protein expression in pancreatic cancer.44 The positive complement regulator properdin also showed decreased expression in samples from patients with late-stage PDAC. Not only does inhibition of complement activation typically promote cancer cell immune evasion, it has also been shown to hamper the efficacy of cancer immunotherapy.45,46 Decreased expression of properdin is consistent with the immune evasion observed in PDAC. IL-2 exhibited decreased expression in samples from patients with late-stage disease. Several studies show that IL-2 treatment in combination with conventional therapy can attenuate pancreatic cancer progression.47,48 Additional studies of serum proteins that are associated with PDAC progression are needed to reveal information about the biology of disease progression.
The results of our study should be interpreted with caution because the design includes several limitations. First, because the consensus signature was developed using case-control studies, we cannot know how it will function in a surveillance or therapeutic setting until well-designed, prospective validation studies are performed. Although the results seem promising, our consensus signature is not ready as a clinical test. Furthermore, all patient samples were collected at diagnosis, and we cannot predict how the signature would perform in patients after surgical removal of the tumor. We speculate that the signature of these patients might resemble that of controls, while approaching PDAC status as the tumor returns. Second, our study included patients and controls with known disease status, and despite the high AUC values, this does not necessarily imply that the signature performs as well in prediagnostic samples. It is encouraging, however, that the signature performed well in individuals with an elevated risk (eg, in individuals with diabetes or with pancreatitis).
Other methodologies, such as circulating tumor DNA, have not yet shown evidence of clinical usefulness for the detection of early-stage cancer, despite the fact that measurement of circulating tumor DNA has been in clinical use much longer.49 This could be explained partly by a low assay sensitivity and the requirement of large volumes of plasma.50,51 Protein-based approaches, like the one presented here, might offer an alternative method for early detection because of high sensitivity and microliter sample volumes, although well-designed, validation studies are required before they can provide clinical usefulness. Population-based studies, including preclinical samples, would constitute a logical next step to confirm or rebut the predictive value of the present consensus signature.
In summary, a biomarker signature was identified and validated on the basis of two large case-control studies of patients with PDAC. Our findings show that this biomarker signature can detect samples derived from patients with stage I and II PDAC with high accuracy.
ACKNOWLEDGMENT
We thank the Departments of Oncology and Biochemistry, Herlev and Gentofte Hospital, and the Departments of Surgery & Transplantation and Pathology, Rigshospitalet, Copenhagen University Hospital, for blood samples (Danish BIOPAC Biobank and the Copenhagen General Population Study).
Appendix
Demographics of Study Cohorts
The controls for the Scandinavian cohort were obtained from the Copenhagen General Population Study and were matched for sex, age, smoking habits, alcohol intake, and date of blood sampling. Two controls were matched per patient. None of the controls developed pancreatic cancer during a 5-year follow-up. Sex balance was 57:43 (%) men versus women in patients with pancreatic ductal adenocarcinoma (PDAC) and 58:42 (%) men versus women in the NC group. The median age of the patients with PDAC and the normal controls (NC) was 68 years for both. Tobacco use was defined as current or past regular use, and alcohol abuse was defined as current or past abuse. On the basis of guidelines from the Danish Health Authority, the cutoffs for alcohol abuse were set at 168 g and 252 g alcohol per week for women and men, respectively. The ratio of tobacco users in the PDAC group, control group, and all participants combined were 66%, 60%, and 62%, respectively. The corresponding values for alcohol abuse were 22%, 24%, and 23%, respectively (Table 1). Of all patients with PDAC in the Scandinavian cohort, 23.3% suffered from diabetes at the time of sample collection, whereas 25.0%, 28.7%, 26.2%, and 19.1% of patients with stage I, II, III, and IV PDAC, respectively, had known diabetes at the time of blood sampling (Table A3). Regardless of diabetic status, 70% of the tumors were located in the head, 20% in the body, and 10% in the pancreatic tail (Table A4). These proportions correspond to the commonly reported data on tumor localization (Stark A, et al: https://www.pancreapedia.org/reviews/pancreatic-ductal-adenocarcinoma). All other parameters, including liver values and blood cell type counts, were comparable among disease stages (Table A5). Staging for the Scandinavian cohort was based on the pathologic state of the resected tumor and lymph nodes and computed tomography (CT) scans (abdominal and thorax) in the resected patients and on biopsy and CT scans in the nonresected patients.
The controls for the cohort in the United States were collected either during a blood drive targeting healthy, noncancer controls or during an office visit of noncancer individuals and were matched to patients with PDAC regarding sex and age at time of sample collection. None of the controls developed pancreatic cancer during a 5-year follow-up. Sex balance was 56:44 (%) men versus women in patients with PDAC, 53:47 (%) men versus women in NC, 48:52 (%) men versus women in patients with chronic pancreatitis (CP), and 40:60 (%) men versus women in patients with intraductal papillary mucinous neoplasms (IPMN). The median age for patients with PDAC, NC, patients with CP, and patients with IPMN was 67, 63, 56, and 69 years, respectively. Staging for the cohort in the United States was based on pathologic state, with the exception of cases in which there was no resection (ie, typically late-stage disease). For those patients, staging was based on biopsy or imaging, depending on the clinical course. Of all patients with PDAC in the cohort in the United States, 26.6% suffered from diabetes at the time of sample collection, whereas 26.7%, 26.7%, 20.0%, and 28.9% of patients with stages I, II, III, and IV PDAC, respectively, had known diabetes at the time of blood sampling (Table A3). IPMN diagnoses in both cohorts were based on surgically obtained pathology. Furthermore, the diagnosis of CP was made by (1) symptoms (ie, pain and/or pancreatic insufficiency as determined by pancreatic elastase after episodes of acute pancreatitis that were biochemically confirmed with amylase and lipase determinations and had abdominal imaging with CT scan that showed pancreatic and aperi-peripancreatic inflammation), and (2) imaging (all patients had endoscopic retrograde cholangiopancreatography that showed pancreatic ductal changes consistent with CP and all had CT and/or magnetic resonance imaging). All patients went to surgery for drainage procedures.
The sizes of the two studies were determined by the maximum number of well-annotated patients available for research.
Sample Collection
The Scandinavian study, denoted the BIOPAC Study (Biomarkers in Patients With Pancreatic Cancer – can they provide new information of the disease and improve diagnosis and prognosis of the patients), was approved by the regional ethics committees of Copenhagen (VEK ref. KA-2006-0113) and the Danish Data Protection Agency (jr. no. 2006-41-6848, jr. no. 2012-58-004 and HGH-2015-027, I-suite 03960). The serum samples were collected between 2008 and 2014 at Herlev Hospital and Rigshospitalet, Copenhagen, Denmark. At the time of diagnosis, the blood was collected and allowed to clot for at least 30 minutes and was then centrifuged at 2,330 × g for 10 minutes at 4°C. The serum was aliquoted and stored at −80°C until additional analysis. All samples were collected and processed using the same standard operating procedure and were analyzed for serum CA19-9, liver enzymes, and blood cell counts. Clinical data were gathered at the time of sample collection.
The study in the United States was approved by the institutional review board of Oregon Health and Science University. Blood was collected before any treatment, allowed to clot for at least 30 minutes, and centrifuged at 1,500 × g for 10 minutes at 4°C. All samples were collected and processed using the same standard operating procedure. The serum was aliquoted and stored at −80°C until additional analysis. Tissue specimens from the patients with PDAC were not interrogated.
Data Acquisition, Quality Control, and Preprocessing
Signal intensities from the antibody microarray were quantified using Array-Pro Analyzer software (Media Cybernetics, Rockville, MD). Local background values were subtracted, and the adjusted intensity values were then used for subsequent data analysis. Data acquisition was performed by trained members of the research team who were blinded to sample classification and clinical data. Each data point represented a background-subtracted signal average of three replicate spots per antibody clone unless the replicate coefficient of variance (CV) exceeded 15%. In such cases, the replicate spot furthest from the mean value was omitted, and the average signal of the two remaining replicates was used. The average CVs of replicates were 8.4% and 6.7% in the Scandinavian and the United States study, respectively.
The raw data from the quality control (QC) samples were evaluated on an individual antibody level for interslide and interday variance by CV value analysis, box plotting, and three-dimensional principal component analysis with analysis of variance (ANOVA) filtering (Qlucore Omics Explorer; Qlucore AB, Lund, Sweden). Once data set homogeneity had been ensured, the QC samples were removed from additional analysis. Data from PDAC and control samples were transformed by log2, followed by adjustment and normalization in two steps to reduce technical variation between days and slides. In the first step, day-to-day variation was addressed by applying ComBat (SVA package in the statistical software environment R), a method to adjust batch effects, using empirical Bayes frameworks where the batch covariate is known (Johnson WE, et al: Biostatistics 8:118-127, 2007; Leek JT, et al: sva: Surrogate Variable Analysis. R package version 3.22.0. 2016). The covariate used was the day of microarray assay. In a second step, array-to-array variation was minimized by calculating a scaling factor for each array. This factor was based on the 20% of antibodies with the lowest standard deviation of all samples, and was calculated by dividing the intensity sum of these antibodies on each array with the average sum across all arrays (Delfani P, et al: PLoS One 11:e0159138, 2016). The data are available from the corresponding author on request.
Data Analysis
Two-group classifications were performed using support vector machine (SVM) analysis in R. Principal component analysis, q value calculation by ANOVA, and fold-change calculation were performed, using Qlucore Omics Explorer. Multigroup ANOVA was used to analyze the differential expression of individual protein markers in samples from the various PDAC stages included in the Scandinavian cohort. The performance of individual markers was evaluated with the t test, the Benjamini-Hochberg procedure for false discovery rate control (q values), and fold changes. Sensitivities and specificities were calculated from SVM decision values. Positive and negative predictive values were calculated in relation to prevalence and lifetime risk for risk groups, such as patients with new-onset diabetes who were older than 55 years of age and first-degree relatives of patients with PDAC.
Before defining a biomarker signature that discriminated NC from PDAC stage I and II, the power to classify individual PDAC stages was evaluated using a leave-one-out (LOO) cross-validation approach in R on the basis of all antibodies (Carlsson A, et al: Proc Natl Acad Sci U S A 108:14252-14257, 2011). In short, an SVM was designed in which one data point was partitioned into a separate subset (test set) and the remaining data points were used as the training set. The process was repeated one sample at a time, the results were used to create a receiver operating characteristic (ROC) curve, and the corresponding area under the curve (AUC) value was calculated. The predictive accuracy of the consensus signature was validated in an independent cohort in the United States. In this validation study, the data were divided into three training and test sets of approximately 280 samples (training) and approximately 140 samples (test). The ratio of case versus control samples within the data sets was retained, but otherwise the sets were randomly generated. The consensus signature from the Scandinavian study was used to build prediction models, using only the training sets in the United States. The model was then tested on the corresponding test set in the United States and the performance was assessed using ROC curves and AUC values. To further minimize overinterpretation and to ensure robustness, this process was performed on all three training and test sets. The same approach was used for the classification of CP versus PDAC samples using a frozen SVM, and the ROC-AUC value was calculated. Finally, the consensus signature was used to classify NC versus patients with IPMN. All IPMN samples in the validation cohort were fed into an SVM model that had been trained on NC versus PDAC. To investigate whether bilirubin levels or diabetes were confounding factors in the antibody microarray analysis, patients with jaundice (49.7%) and diabetes (26.6%) were compared with patients without jaundice or without diabetes, respectively.
Sample Labeling
In both studies, the serum samples were labeled with biotin, using a protocol optimized for serum proteomes (Carlsson A, et al: Proteomics Clin Appl 4:591-602, 2010; Gerdtsson AS, et al: Int J Proteomics 2015:587250, 2015; Wingren C, et al: Proteomics 7:3055-3065, 2007). Briefly, 5 µL of serum samples were diluted 1:45 in phosphate-buffered saline (PBS) to approximately 2 mg of protein/mL and labeled with 0.6 mM EZ-Link Sulfo-NHS-LC-Biotin (Thermo Fisher Scientific, Waltham, MA). Unbound biotin was removed by dialysis against PBS for 72 hours using a 3.5 kDa MWCO dialysis membrane (Thermo Fisher Scientific), changing buffer every 24 hours. The labeled serum samples were aliquoted and stored at −20°C. To control for labeling quality, reference serum samples (LGC Standards, Teddington, United Kingdom) were labeled alongside patient samples during each biotinylation round. The signals from these QC samples were compared with the signals from a batch of identical previously labeled reference serum (see Microarray Assay) to verify that the process had worked as intended.
Antibody Microarray Production
Identical antibody microarrays were used in both studies. The arrays comprised 339 human recombinant single-chain variable fragments (scFvs) directed against 156 known antigens (Table A1). The scFvs, selected and generated from phage display libraries, have been shown previously to display robust on-chip functionality (Delfani P, et al: PLoS One 11:e0159138, 2016; Gerdtsson AS, et al: Int J Proteomics 2015:587250, 2015; Steinhauer C, et al: Biotechniques Suppl:38-45, 2002; Wingren C, et al: Curr Opin Biotechnol 19:55-61, 2008; Wingren C, et al: Proteomics 5:1281-1291, 2005). Alongside the scFvs, two full-length monoclonal antibodies against CA19-9 (Meridian Life Science, Memphis, TN) were printed on the slides. Most of the antibodies have been tested previously in array applications (Steinhauer C, et al: Biotechniques Suppl:38-45, 2002; Wingren C, et al: Curr Opin Biotechnol 19:55-61, 2008; Wingren C, et al: Proteomics 5:1281-1291, 2005), and their specificity validated, using well-characterized control sera. Furthermore, orthogonal methods such as mass spectrometry, enzyme-linked immunosorbent assay, MesoScaleDiscovery cytokine assay, cytometric bead assay, and spiking and blocking enzyme-linked immunosorbent assay have been used for assessing antibody specificities (Borrebaeck CA, et al: Methods Mol Biol 785:247-262, 2011; Olsson N, et al: Protein Sci 21:1897-1910, 2012; Söderlind E, et al: Nat Biotechnol 18:852-856, 2000). The selected scFvs were directed against serum proteins involved mostly in immune regulation and/or cancer biology.
His-tagged scFvs were produced in Escherichia coli and purified from the periplasm, using a magnetic Ni-particle protein purification system (MagneHis; Promega, Madison, WI). The elution buffer was exchanged for PBS, using Zeba 96-well spin plates (Pierce, Rockford, IL). Protein yield was measured using the NanoDrop spectrophotometer (Thermo Fisher Scientific). Protein purity was checked by 10% Bis-Tris SDS-PAGE (Invitrogen, Carlsbad, CA). Antibody microarrays were produced on black MaxiSorp slides (NUNC, Roskilde, Denmark), using a noncontact printer (SciFlexarrayer S11; Scienion, Berlin, Germany). Before printing, the optimal printing concentration was defined for each scFv clone (Delfani P, et al: PLoS One 11:e0159138, 2016). To allow for subsequent QC functions, 0.1 mg/mL Cadaverine Alexa Fluor-555 (Life Technologies, Carlsbad, CA) was added to the printing buffer. Fourteen identical arrays were printed on each slide in two columns of seven arrays. Each array consisted of 34×36 spots with a 200-μm spot-to-spot center distance and a spot diameter of 140 μm. Each array consisted of three identical segments separated by rows of bovine serum albumin (BSA)-biotin spots. Each antibody was printed in three replicates with one replicate in each segment. Two additional rows of BSA-biotin spots flanked each subarray, one above the subarray and one below it. Nine negative control spots (PBS) were printed in each replicate segment. Ten slides (140 microarrays) were printed, for each round of analysis. In the Scandinavian discovery study, a total of 152 slides were printed over 16 printing days. In the validation study, a total of 48 slides were printed over five printing days. The slides were stored for 8 days at room temperature (RT) before microarray assay.
Microarray Assay
Ten samples on each slide were analyzed. The positioning of the samples was randomly assigned, but the ratio of healthy and PDAC samples on each slide was approximately the same for the cohort as a whole. Four positions on each slide were used for QC samples; three for reference sera (two from LGC Standards, Teddington, United Kingdom, and one from SeraCare Life Sciences, Milford, MA), and one for a sample containing a mix of aliquots from healthy and cancer samples included in the study. Each microarray slide was mounted in a hybridization gasket (Schott, Mainz, Germany) and blocked with 1% w/v milk, 1% v/v Tween-20 in sterile Dulbecco's-PBS (MT-PBS) at RT for 1 hour with constant agitation. Meanwhile, aliquots of labeled serum samples were thawed on ice and diluted subsequently at 1:10 in MT-PBS. The slides were washed four times with 0.05% Tween-20 in sterile Dulbecco's-PBS (PBST), followed by the addition of diluted serum samples to the wells of the gasket. Samples were incubated on the slides at RT for 2 hours with constant agitation. Next, the slides were washed four times with PBST, incubated with 1 μg/mL Streptavidin Alexa-647 (Life Technologies) in MT-PBS at RT for 1 hour with constant agitation, and again washed four times with PBST. Finally, the slides were dismounted from the hybridization gaskets, immersed in dH2O, and dried under a stream of N2. The slides were scanned immediately with a confocal microarray scanner (LS Reloaded; Tecan, Männedorf, Switzerland) at a 10-μm resolution, first at 635 nm, then at 532 nm. The first scan image detected the Alexa-647 (streptavidin) signal and was used for quantification of spot signal intensities. The second scan image measured the Alexa-555 (cadaverine) signal and was used for quality control purposes.
Fig A1.
Influence of diabetes on normal controls (NC) v pancreatic ductal adenocarcinoma (PDAC) classification accuracy. Decision values from a support vector machine model that had been trained on NC v PDAC were used to analyze differences between diabetic and nondiabetic PDAC samples in the discovery cohort. Significance values were calculated using the Wilcoxon signed-rank test. NOD, new-onset diabetes.
Fig A2.
Classification of intraductal papillary mucinous neoplasm (IPMN) stages from normal control (NC) samples. The consensus signature was used to classify NC v the different IPMN stages. All IPMN samples from the United States cohort were fed into a support vector machine model that had been trained on NC v pancreatic ductal adenocarcinoma (PDAC). Significance values were calculated using the Wilcoxon signed-rank test and were adjusted for multiple testing by the Benjamini-Hochberg procedure (false discovery rate, 0.05). The generated P values were as follows: NC v PDAC: 6.69 × 10⁻¹⁸; PDAC v benign and borderline IPMN: 0.034; PDAC v malignant IPMN: 0.401.
Table A1.
Antibody Specificities
Table A2.
Biomarker Signatures Discriminating PDAC Stages I and II, and Stages III and IV, from NC
Table A3.
Diabetes and Jaundice in the Scandinavian and United States Cohorts
Table A4.
Tumor Localization in the Scandinavian Cohort
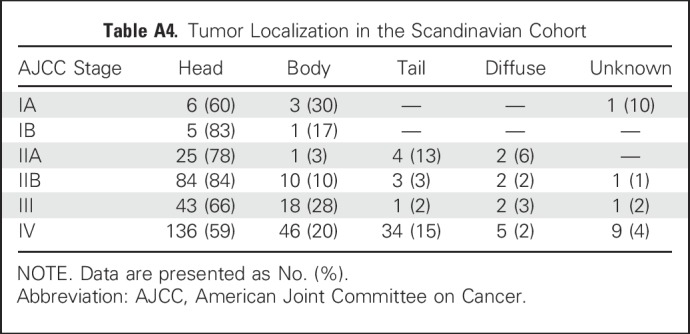
Table A5.
Clinical Parameters in the Scandinavian Cohort
Footnotes
Supported by grants from VINNOVA, CREATE Health Translational Cancer Center, SWElife, EU FP7 Grant Agreement 241481 AFFINOMICS and BioCARE, Lund University (C.A.K.B.); EU Horizon 2020 SMI Instrument 672454 (L.D.M.); Grant No. R01 CA196228 and the Brenden-Colson Center for Pancreatic Care (R.C.S); the Brenden-Colson Center for Pancreatic Care (B.L.M., B.C.S.); the Capital Region of Denmark, Department of Clinical Biochemistry, Herlev and Gentofte Hospital, and Copenhagen University Hospital (S.E.B., B.G.N.).
Clinical trial information: NCT03311776.
AUTHOR CONTRIBUTIONS
Conception and design: Linda D. Mellby, Julia S. Johansen, Carl A.K. Borrebaeck
Financial support: Julia S. Johansen
Provision of study materials or patients: Børge G. Nordestgaard, Julia S. Johansen, Stig E. Bojesen, Brett C. Sheppard, Rosalie C. Sears
Collection and assembly of data: Andreas P. Nyberg, Julia S. Johansen, Christer Wingren, Børge G. Nordestgaard, Stig E. Bojesen, Breeana L. Mitchell, Brett C. Sheppard, Rosalie C. Sears
Data analysis and interpretation: Linda D. Mellby, Andreas P. Nyberg, Julia S. Johansen, Brett C. Sheppard, Stig E. Bojesen, Carl A.K. Borrebaeck
Manuscript writing: All authors
Final approval of manuscript: All authors
Accountable for all aspects of the work: All authors
AUTHORS' DISCLOSURES OF POTENTIAL CONFLICTS OF INTEREST
Serum Biomarker Signature-Based Liquid Biopsy for Diagnosis of Early-Stage Pancreatic Cancer
The following represents disclosure information provided by authors of this manuscript. All relationships are considered compensated. Relationships are self-held unless noted. I = Immediate Family Member, Inst = My Institution. Relationships may not relate to the subject matter of this manuscript. For more information about ASCO's conflict of interest policy, please refer to www.asco.org/rwc or ascopubs.org/jco/site/ifc.
Linda D. Mellby
Employment: Immunovia AB
Stock or Other Ownership: Immunovia AB
Research Funding: Immunovia AB
Patents, Royalties, Other Intellectual Property: Co-inventor in patent application submitted by Immunovia AB
Travel, Accommodations, Expenses: Immunovia AB
Andreas P. Nyberg
Employment: Immunovia AB
Research Funding: Immunovia AB
Patents, Royalties, Other Intellectual Property: Co-inventor in patent application submitted by Immunovia AB
Julia S. Johansen
No relationship to disclose
Christer Wingren
Employment: Immunovia AB
Leadership: Immunovia AB
Stock or Other Ownership: Immunovia AB
Consulting or Advisory Role: Immunovia AB
Patents, Royalties, Other Intellectual Property: Immunovia AB
Travel, Accommodations, Expenses: Immunovia AB
Børge G. Nordestgaard
No relationship to disclose
Stig E. Bojesen
No relationship to disclose
Breeana L. Mitchell
No relationship to disclose
Brett C. Sheppard
No relationship to disclose
Rosalie C. Sears
Honoraria: Genentech
Patents, Royalties, Other Intellectual Property: Patent for 3D tissue bioprinting - breast cancer
Carl A.K. Borrebaeck
Leadership: Immunovia AB
Stock or Other Ownership: Immunovia AB
Patents, Royalties, Other Intellectual Property: Immunovia AB
REFERENCES
- 1.Torre LA, Bray F, Siegel RL, et al. : Global cancer statistics, 2012. CA Cancer J Clin 65:87-108, 2015 [DOI] [PubMed] [Google Scholar]
- 2.Kamisawa T, Wood LD, Itoi T, et al. : Pancreatic cancer. Lancet 388:73-85, 2016 [DOI] [PubMed] [Google Scholar]
- 3.Rahib L, Fleshman JM, Matrisian LM, et al. : Evaluation of pancreatic cancer clinical trials and benchmarks for clinically meaningful future trials: A systematic review. JAMA Oncol 2:1209-1216, 2016 [DOI] [PubMed] [Google Scholar]
- 4.Ryan DP, Hong TS, Bardeesy N: Pancreatic adenocarcinoma. N Engl J Med 371:2140-2141, 2014 [DOI] [PubMed] [Google Scholar]
- 5.Rahib L, Smith BD, Aizenberg R, et al. : Projecting cancer incidence and deaths to 2030: The unexpected burden of thyroid, liver, and pancreas cancers in the United States. Cancer Res 74:2913-2921, 2014 [DOI] [PubMed] [Google Scholar]
- 6.Sohn TA, Yeo CJ, Cameron JL, et al. : Resected adenocarcinoma of the pancreas-616 patients: Results, outcomes, and prognostic indicators. J Gastrointest Surg 4:567-579, 2000 [DOI] [PubMed] [Google Scholar]
- 7.Zhang H, Wu X, Zhu F, et al. : Systematic review and meta-analysis of minimally invasive versus open approach for pancreaticoduodenectomy. Surg Endosc 30:5173-5184, 2016 [DOI] [PubMed] [Google Scholar]
- 8.Matsuno S, Egawa S, Fukuyama S, et al. : Pancreatic Cancer Registry in Japan: 20 years of experience. Pancreas 28:219-230, 2004 [DOI] [PubMed] [Google Scholar]
- 9.Gangi S, Fletcher JG, Nathan MA, et al. : Time interval between abnormalities seen on CT and the clinical diagnosis of pancreatic cancer: Retrospective review of CT scans obtained before diagnosis. AJR Am J Roentgenol 182:897-903, 2004 [DOI] [PubMed] [Google Scholar]
- 10.Pelaez-Luna M, Takahashi N, Fletcher JG, et al. : Resectability of presymptomatic pancreatic cancer and its relationship to onset of diabetes: A retrospective review of CT scans and fasting glucose values prior to diagnosis. Am J Gastroenterol 102:2157-2163, 2007 [DOI] [PubMed] [Google Scholar]
- 11.Vasen H, Ibrahim I, Ponce CG, et al. : Benefit of surveillance for pancreatic cancer in high-risk individuals: Outcome of long-term prospective follow-up studies from three European expert centers. J Clin Oncol 34:2010-2019, 2016 [DOI] [PubMed] [Google Scholar]
- 12.Hanada K, Okazaki A, Hirano N, et al. : Effective screening for early diagnosis of pancreatic cancer. Best Pract Res Clin Gastroenterol 29:929-939, 2015 [DOI] [PubMed] [Google Scholar]
- 13.Chari ST, Kelly K, Hollingsworth MA, et al. : Early detection of sporadic pancreatic cancer: Summative review. Pancreas 44:693-712, 2015 [DOI] [PMC free article] [PubMed] [Google Scholar]
- 14.Brentnall TA: Progress in the earlier detection of pancreatic cancer. J Clin Oncol 34:1973-1974, 2016 [DOI] [PubMed] [Google Scholar]
- 15.Okano K, Suzuki Y: Strategies for early detection of resectable pancreatic cancer. World J Gastroenterol 20:11230-11240, 2014 [DOI] [PMC free article] [PubMed] [Google Scholar]
- 16.Locker GY, Hamilton S, Harris J, et al. : ASCO 2006 update of recommendations for the use of tumor markers in gastrointestinal cancer. J Clin Oncol 24:5313-5327, 2006 [DOI] [PubMed] [Google Scholar]
- 17.Galli C, Basso D, Plebani M: CA 19-9: Handle with care. Clin Chem Lab Med 51:1369-1383, 2013 [DOI] [PubMed] [Google Scholar]
- 18.Borrebaeck CA: Precision diagnostics: Moving towards protein biomarker signatures of clinical utility in cancer. Nat Rev Cancer 17:199-204, 2017 [DOI] [PubMed] [Google Scholar]
- 19.Hanash SM, Pitteri SJ, Faca VM: Mining the plasma proteome for cancer biomarkers. Nature 452:571-579, 2008 [DOI] [PubMed] [Google Scholar]
- 20.Radon TP, Massat NJ, Jones R, et al. : Identification of a three-biomarker panel in urine for early detection of pancreatic adenocarcinoma. Clin Cancer Res 21:3512-3521, 2015 [DOI] [PMC free article] [PubMed] [Google Scholar]
- 21.Shaw VE, Lane B, Jenkinson C, et al. : Serum cytokine biomarker panels for discriminating pancreatic cancer from benign pancreatic disease. Mol Cancer 13:114, 2014 [DOI] [PMC free article] [PubMed] [Google Scholar]
- 22.Mayers JR, Wu C, Clish CB, et al. : Elevation of circulating branched-chain amino acids is an early event in human pancreatic adenocarcinoma development. Nat Med 20:1193-1198, 2014 [DOI] [PMC free article] [PubMed] [Google Scholar]
- 23.Jenkinson C, Elliott VL, Evans A, et al. : Decreased serum thrombospondin-1 levels in pancreatic cancer patients up to 24 months prior to clinical diagnosis: Association with diabetes mellitus. Clin Cancer Res 22:1734-1743, 2016 [DOI] [PMC free article] [PubMed] [Google Scholar]
- 24.Brand RE, Nolen BM, Zeh HJ, et al. : Serum biomarker panels for the detection of pancreatic cancer. Clin Cancer Res 17:805-816, 2011 [DOI] [PMC free article] [PubMed] [Google Scholar]
- 25.Kim J, Bamlet WR, Oberg AL, et al: Detection of eraly pancreatic ductal adenocarcinoma with thrombospondin-2 and CA19-9 blood markers. Sci Transl Med 12:9, 2017. [DOI] [PMC free article] [PubMed]
- 26. Gerdtsson AS, Malats N, Sall A, Real FX, Porta M, Skoog P, et al: A multicenter trial defining a serum protein signature associated with pancreatic ductal adenocarcinoma. Int J Proteomics 2015:587250, 2015. [DOI] [PMC free article] [PubMed]
- 27.Wingren C, Sandström A, Segersvärd R, et al. : Identification of serum biomarker signatures associated with pancreatic cancer. Cancer Res 72:2481-2490, 2012 [DOI] [PubMed] [Google Scholar]
- 28.Bossuyt PM, Reitsma JB, Bruns DE, et al. : STARD 2015: An updated list of essential items for reporting diagnostic accuracy studies. BMJ 351:h5527, 2015 [DOI] [PMC free article] [PubMed] [Google Scholar]
- 29.Carlsson A, Wingren C, Kristensson M, et al. : Molecular serum portraits in patients with primary breast cancer predict the development of distant metastases. Proc Natl Acad Sci USA 108:14252-14257, 2011 [DOI] [PMC free article] [PubMed] [Google Scholar]
- 30.Batabyal P, Vander Hoorn S, Christophi C, et al. : Association of diabetes mellitus and pancreatic adenocarcinoma: A meta-analysis of 88 studies. Ann Surg Oncol 21:2453-2462, 2014 [DOI] [PubMed] [Google Scholar]
- 31.Wang F, Herrington M, Larsson J, et al. : The relationship between diabetes and pancreatic cancer. Mol Cancer 2:4, 2003 [DOI] [PMC free article] [PubMed] [Google Scholar]
- 32.Lopez-Lazaro M. Pancreatic cancer formation is gradual. ResearchGate; 2017. doi: 10.13140/RG.2.2.16865.92009 [Google Scholar]
- 33.Notta F, Chan-Seng-Yue M, Lemire M, et al. : A renewed model of pancreatic cancer evolution based on genomic rearrangement patterns. Nature 538:378-382, 2016. [Erratum: Nature 542:124, 2017] [DOI] [PMC free article] [PubMed] [Google Scholar]
- 34.Yachida S, Jones S, Bozic I, et al. : Distant metastasis occurs late during the genetic evolution of pancreatic cancer. Nature 467:1114-1117, 2010 [DOI] [PMC free article] [PubMed] [Google Scholar]
- 35.Shimizu Y, Yasui K, Matsueda K, et al. : Small carcinoma of the pancreas is curable: New computed tomography finding, pathological study and postoperative results from a single institute. J Gastroenterol Hepatol 20:1591-1594, 2005 [DOI] [PubMed] [Google Scholar]
- 36.Chari ST, Leibson CL, Rabe KG, et al. : Probability of pancreatic cancer following diabetes: A population-based study. Gastroenterology 129:504-511, 2005 [DOI] [PMC free article] [PubMed] [Google Scholar]
- 37.Aggarwal G, Rabe KG, Petersen GM, et al. : New-onset diabetes in pancreatic cancer: A study in the primary care setting. Pancreatology 12:156-161, 2012 [DOI] [PMC free article] [PubMed] [Google Scholar]
- 38.Pannala R, Basu A, Petersen GM, et al. : New-onset diabetes: A potential clue to the early diagnosis of pancreatic cancer. Lancet Oncol 10:88-95, 2009 [DOI] [PMC free article] [PubMed] [Google Scholar]
- 39.Sandström A, Andersson R, Segersvärd R, et al. : Serum proteome profiling of pancreatitis using recombinant antibody microarrays reveals disease-associated biomarker signatures. Proteomics Clin Appl 6:486-496, 2012 [DOI] [PubMed] [Google Scholar]
- 40.Roberts S, Delury C, Marsh E: The PDZ protein discs-large (DLG): The ‘Jekyll and Hyde’ of the epithelial polarity proteins. FEBS J 279:3549-3558, 2012 [DOI] [PubMed] [Google Scholar]
- 41.Kranjec C, Massimi P, Banks L: Restoration of MAGI-1 expression in human papillomavirus-positive tumor cells induces cell growth arrest and apoptosis. J Virol 88:7155-7169, 2014 [DOI] [PMC free article] [PubMed] [Google Scholar]
- 42.Lan X, Gao H, Wang F, et al. : Whole-exome sequencing identifies variants in invasive pituitary adenomas. Oncol Lett 12:2319-2328, 2016 [DOI] [PMC free article] [PubMed] [Google Scholar]
- 43.Huang Y, Yu X, Wang L, et al. : Four genetic polymorphisms of lymphotoxin-alpha gene and cancer risk: A systematic review and meta-analysis. PLoS One 8:e82519, 2013 [DOI] [PMC free article] [PubMed] [Google Scholar]
- 44.The Human Protein Atlas. http://www.proteinatlas.org/ENSG00000226979-LTA/cancer
- 45.Mamidi S, Höne S, Kirschfink M: The complement system in cancer: Ambivalence between tumour destruction and promotion. Immunobiology 222:45-54, 2017 [DOI] [PubMed] [Google Scholar]
- 46.Pio R, Corrales L, Lambris JD: The role of complement in tumor growth. Adv Exp Med Biol 772:229-262, 2014 [DOI] [PMC free article] [PubMed] [Google Scholar]
- 47.Grande C, Firvida JL, Navas V, et al. : Interleukin-2 for the treatment of solid tumors other than melanoma and renal cell carcinoma. Anticancer Drugs 17:1-12, 2006 [DOI] [PubMed] [Google Scholar]
- 48.Nobili C, Degrate L, Caprotti R, et al. : Prolonged survival of a patient affected by pancreatic adenocarcinoma with massive lymphocyte and dendritic cell infiltration after interleukin-2 immunotherapy. Report of a case. Tumori 94:426-430, 2008 [DOI] [PubMed] [Google Scholar]
- 49.Merker JD, Oxnard GR, Compton C, et al. : Circulating tumor DNA analysis in patients with cancer: American Society of Clinical Oncology and College of American Pathologists joint review. J Clin Oncol 36:1631-1641, 2018 [DOI] [PubMed] [Google Scholar]
- 50.Bettegowda C, Sausen M, Leary RJ, et al. : Detection of circulating tumor DNA in early- and late-stage human malignancies. Sci Transl Med 6:224ra24, 2014 [DOI] [PMC free article] [PubMed] [Google Scholar]
- 51. Haque IS, Elemento O: Challenges in using ctDNA to achieve early detection of cancer. [DOI]


