

Abstract
Purpose.
Effects of geographic program expansion to rural areas on screening program outcomes are understudied. We sought to determine whether time-to-resolution (TTR) varied significantly by service delivery time period, location, and participant characteristics across 19 North Texas counties.
Methods.
We calculated proportions undergoing diagnostic follow-up and resolved ≤ 60 days. We calculated median TTR for each time period and abnormal result BI-RADS 0, 4, 5. Cox proportional hazards regressions estimated time period and patient characteristic effects on TTR. Wilcoxon rank sum tests evaluated whether TTR differed between women who did or did not transfer between counties for services.
Results.
TTR ranged from 14–17 days for BI-RADs 0, 4, and 5; 12.4% transferred to a different county, resulting in longer median TTR (26 vs. 16 days; p <001). Of those completing follow up, 92% were resolved ≤60 days (median 15 days). For BI-RAD 3, TTR was 208 days (including required 180 day waiting period). Follow-up was significantly lower for women with BI-RAD 3 (59% vs. 96%;p <.0001).
Conclusion.
Expansion maintained timely service delivery, increasing access to screening among rural, uninsured women. Policies adding a separate quality metric for BI-RAD 3 could encourage follow-up monitoring to address lower completion and longer TTR among women with this result.
Keywords: scale-up, rural, quality, breast cancer screening
Introduction
Breast cancer screening has been shown to reduce mortality among women at average risk of breast cancer between the ages of 40–69.(1) A single screening episode,(2) however, may require both primary and specialty care providers, multiple procedures (e.g. screening mammogram, diagnostic mammogram, ultrasound, and biopsy), and multiple communications involving transfer of information and responsibility before a diagnostic result is reached.(3) Timely diagnostic resolution following an abnormal mammography is critical to reducing morbidity. (4) Disparities exist in the timeliness of follow-up among vulnerable populations including racial/ethnic minorities and those with limited education or income.(5) Studies show that rural-residing women are less likely to complete cancer screening and more likely to be diagnosed at a later stage.(6) Rural-related disparities are especially concerning in states like Texas where 46% of the 254 counties are classified as rural.(7)
Various system/clinic-, provider-, and patient-level barriers hinder timely completion of diagnostic follow-up after an abnormal screening mammogram including delayed result reporting, limited access to diagnostic services, timeliness of follow-up communications by providers and clinical staff, and lack of attention to patient barriers such as transportation, childcare, and other competing demands.(8, 9) Patient navigation has been shown to address many of these factors and, thereby, increase completion of diagnostic follow-up and reduce time to resolution (TTR) following an abnormal mammography screening, particularly among vulnerable populations (10–12) and for women requiring additional services such as biopsy.(13, 14) Navigation effectiveness varies by key patient demographic factors, including race/ethnicity, language, insurance status, and marital status.(15) At the system-level, the prevalence and types of barriers to timely follow-up may vary across clinics, even within integrated healthcare systems.(16, 17) Screening delivery programs able to address these multi-level factors (18) may be well-positioned to expand program reach (i.e. scale up) into similarly situated communities.
Scale-up of screening delivery programs to expand geographic reach may impact quality of care.(19) Key factors for successful program scale-up include: establishing process and outcome evaluation metrics, systematically using data to guide quality improvement efforts(20, 21) and engage program implementers, and adapting the program approach to local contexts. (19, 22) However, little is known about how to expand mammography programs across large rural regions and how expansion impacts service quality (as a measure of program maintenance). In the CDC’s National Breast and Cervical Cancer Early Detection Program (NBCCEDP), reimbursement for mammography services is contingent upon a program quality metric-- timely diagnostic resolution (e.g. ≤60 days for ≥75% of women with abnormal results).(23, 24) Thus, monitoring time to resolution changes after program expansion is a practical and reasonable way to understand the impact of such regional expansion on delivery outcomes.
Previously, we tested a tool to assess county capacity (25) and demonstrated effectiveness of a decentralized rural breast cancer screening delivery model to maintain equivalent numbers of women served during program expansion from the original seven counties to 19 counties.(26) In this paper, we evaluate a key quality metric: time to resolution (TTR), to demonstrate effectiveness of that geographic scale-up. We hypothesized that scale-up would be successful if the program achieved comparable outcomes with respect to TTR as new counties were added, irrespective of (a) when service was delivered (i.e., before versus after expansion), (b) service location (original vs. expansion county), and (b) patient sociodemographic (e.g. race/ethnicity) and patient-reported health status (e.g. “symptomatic” vs. asymptomatic, prior to clinical adjudication) characteristics.
METHODS
Setting and Study Population
In 2009, Moncrief Cancer Institute (Moncrief) created the “Breast Screening and Patient Navigation” (BSPAN) program to increase access to breast cancer screening for under- and uninsured rural-residing women in North Texas.(27) BSPAN is a virtually-integrated network of clinical providers and local community organizations across rural North Texas. (28) In 2012, the BSPAN program evolved into a de-centralized regional hub-and-spoke delivery model to better serve an expanded regional area of 19 counties. (27) As the hub, Moncrief anchors a contracted network of participating primary care and radiology facilities across these counties, delivers bilingual telephone-based, oncology nurse-driven navigation for patient intake and scheduling, and reimburses participating providers using a combination of funding mechanisms, per individual eligibility.(25) The NBCCEDP’s Texas state affiliate was the primary source followed by Medicaid, Komen for the Cure regional charities, Cancer Prevention Research Institute of Texas (CPRIT), and local philanthropies. A small number of patients used self-pay, Medicare, and occasionally some form of commercial insurance.. Local primary care and radiology providers serve as network spokes to deliver the full continuum of breast cancer screening services and document service delivery for reimbursement by Moncrief. The current BSPAN service area is over 90% rural, with some communities located over 120 miles from Moncrief. (7, 26) Description of the funding strategy, service population and county catchment area have been described previously.(29)
Data Collection
Moncrief created an electronic database to track program participants’ contact information, sociodemographics, receipt of screening services, radiology and pathology results, and navigation process data across the screening continuum. Navigation staff recorded each contact with participants in the database in real time. Database-derived reports assessed program metrics such as: completion of follow-up, time to resolution, proportion uninsured, proportion receiving baseline mammography, and number of cancers detected.
Sample Selection
Of >18,000 patients served during the BSPAN expansion (Oct 1, 2012 - May 31, 2015), 2,860 patients received at least one abnormal result during the screening process (Figure 1). Among patients who received multiple abnormal screening results over the three-year program, we analyzed the first abnormal result.
Figure 1.
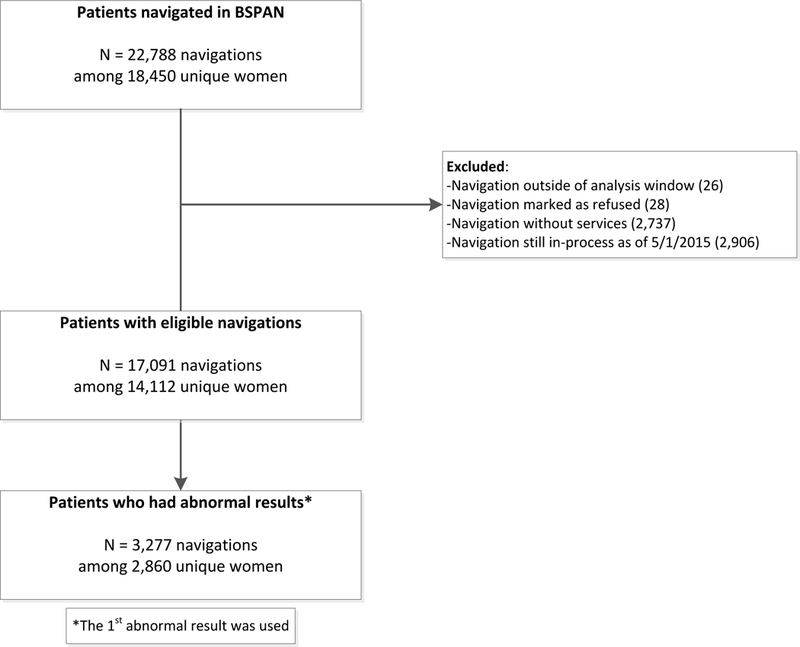
Consort diagram of BSPAN participants selected for analysis
Outcomes
We defined as abnormal any outcome that required additional imaging or biopsy to reach diagnostic resolution; thus: BI-RAD scores of 0, 3, 4, and 5 or an abnormal screening mammogram. End points for calculating diagnostic resolution included: screening-normal, BIRAD 1 or 2, biopsy positive, and biopsy negative (Appendix A). We calculated the proportion that completed diagnostic evaluation of an abnormal result during the study period.
We defined time to resolution (TTR) as the number of days between the date the first abnormal screening result was documented in the database and the date when diagnostic resolution was achieved (diagnostic mammogram or biopsy). For those few patients where documentation date was unavailable, we used the date results were received (n=40) or the service date (n=20). We calculated the service date as the end point of the TTR calculation because the date when the woman was notified about the result was less consistently populated in the database. Patients without diagnostic resolution were censored at the end of the study period (May 1, 2015).
We also calculated the proportion that received diagnostic follow-up within 60 days to mirror the NBCCEDP quality metric. The American Cancer Society recommends that patients who receive a BI-RAD 3 screening result undergo repeat short-interval (within 6–9 months) follow-up imaging. (30) This planned delay of recommended follow-up, however, renders the 60-day quality metric for TTR inapplicable among those receiving BI-RAD 3 results. Thus, we stratified our TTR analysis by BI-RAD result (3 vs. 0, 4, 5, Screening Abnormal) and excluded BI-RAD 3 outcomes in our calculation of adherence to the 60-day quality metric. For women with BI-RAD 3 results, we calculated the average TTR and examined how soon after the 180 day waiting period the repeat mammogram was received. This is similar to other analyses of NBCCEDP screening results that have separated (31, 32) or excluded (23) BI-RAD 3 outcomes from analysis.
Independent variables
To examine aspects of program expansion, we created two independent variables based on patient’s first abnormal service date: time period and service location. The overall number of counties as well as the number of women reached changed over time as the program expanded; therefore we created a time-based independent variable to account for the temporal changes. We grouped patients into five six-month time periods; the first two time periods were prior to program expansion (Oct 2012 - Mar 2013; Apr 2013 - Sep 2013) and the remaining three time periods were after expansion (Oct 2013 - Mar 2014; Apr 2014 - Sep 2014; Oct 2014 - Apr 2015). Service location had three categories: original/pre-expansion (seven counties and service was delivered prior to Jul 1, 2013), original/post-expansion (same seven counties with service on or after Jul 1, 2013), or additional counties, post-expansion (12 counties).
Other literature has found that TTR is associated with patient characteristics such as age, race-ethnicity, poverty level, insurance status, and BI-RAD category of abnormal screening result;(5, 12, 18) therefore, we also evaluated these variables as potential covariates, in addition to language preference and patient-reported health status (symptomatic/asymptomatic) at intake.
Data Analysis
We used counts and percentages to summarize demographic and clinical characteristics of the women, as well as the proportion undergoing diagnostic follow-up during the study period. We used Kaplan-Meier plots to calculate median TTR for each abnormal result type and program expansion time period, as well as to calculate the proportion of women who were resolved by 60 days. Unadjusted and adjusted Cox proportional hazards models were used to estimate hazard ratios for time to resolution according to program expansion time period, service location, and patient characteristics. Variables were included in the multivariable (adjusted) model if a p-value of 0.05 was attained in the univariate (unadjusted) analysis. Analyses were performed using SAS 9.4 System for Windows (SAS Institute Inc., Cary, NC, USA, 2008).
Some counties did not have a provider to perform certain diagnostic procedures; thus, some women were navigated to receive diagnostic services from another county. We used the non-parametric Wilcoxon rank sum test to evaluate a priori whether TTR differs between women who received services in one vs. more than one county among women who reached diagnostic resolution (n=2,362).
RESULTS
We identified 2,860 women (62.6%) who had an abnormal screening mammogram as their first abnormal result (Table 1). The majority of women were between the ages of 40 and 64 (78.7%) and uninsured (92.6%). Over half (52.1%) of the women were Hispanic, 73.3% were asymptomatic at intake, and 63.7% received a service in an expansion county.
Table 1.
Patient characteristics for BSPAN women with an abnormal result
| Overall N=2,860 n (%) |
|
|---|---|
| Age, yearsa | |
| <40 | 546 (19.1) |
| 40–49 | 1,242 (43.4) |
| 50–64 | 1,011 (35.3) |
| ≥65 | 61 (2.1) |
| Race/Ethnicity | |
| Hispanic | 1,491 (52.1) |
| White | 907 (31.7) |
| Black | 329 (11.5) |
| Other-Unknown | 133 (4.7) |
| Preferred Languageb | |
| English | 1,648 (57.6) |
| Other | 1,212 (42.4) |
| Uninsuredc | 2,647 (92.6) |
| Federal Poverty Levelc | |
| 0–100 | 1,550 (54.2) |
| 101–200 | 1,060 (37.1) |
| ≥201 | 250 (8.7) |
| Symptom Statusc | |
| Asymptomatic | 2,095 (73.3) |
| Symptomatic | 765 (26.7) |
| Time Period | |
| Oct 2012-Mar 2013 | 323 (11.3) |
| Apr 2013-Sep 2013 | 610 (21.3) |
| Oct 2013-Mar 2014 | 680 (23.8) |
| Apr 2014-Sep 2014 | 666 (23.3) |
| Oct 2014-Apr 2015 | 581 (20.3) |
| County of Serviced | |
| Original, pre-expansion | 475 (16.6) |
| Original, post-expansion | 563 (19.7) |
| Expansion | 1,822 (63.7) |
| 1st Abnormal Result | |
| Abnormal Screening Mammogram | 1,791 (62.6) |
| BI-RAD 3 | 400 (14.0) |
| BI-RAD 4 | 520 (18.2) |
| BI-RAD 5 | 118 (4.1) |
| BI-RAD 0 | 31(1.1) |
Women < 40 years were screened due to symptomatic presentation or high risk
Other category includes 98.9% Spanish language preference
Status at intake
Original, pre-expansion (7 counties with service prior to 7/1/13), Original, post-expansion (same 7 counties with service on or after 7/1/13), or Expansion (12 counties)
Completion of Diagnostic Follow-up
Nearly 91% of women (n=2,599) completed diagnostic follow-up of an abnormal result during the study period. Median time to resolution for all women with an abnormal result was 15 days (range: 0 – 877 days).
Factors Associated with Time to Resolution
For women with a BI-RADs 0, 4, and 5 result, hazard ratios for TTR were significant in univariate analysis for program expansion time period, patient age, patient race/ethnicity, patient symptomatic status at intake, and patient insurance status at intake; all variables remained significant in the multivariable model (Table 2). Service location, language preference, and federal poverty level at intake were not significantly associated with TTR. Below we report the difference in TTR in days; both days and Hazard ratios are found in Table 2.
Table 2.
Univariate and multivariable results for Time to Resolution (TTR) of abnormal results
| Characteristic | Time to Resolution, Days Median (IQR) |
% Resolved within 60 Daysa |
Unadjusted Model HR (95% Cl) |
Adjusted Modelb HR (95% Cl) |
|---|---|---|---|---|
| Time Period | ||||
| Oct 2012-Mar 2013 | 17 (10,32) | 87% | Ref. | Ref. |
| Apr 2013-Sep 2013 | 14 (9,24) | 93% | 1.36(1.17,1.59) | 1.30 (1.12,1.52) |
| Oct 2013-Mar 2014 | 17 (11,31) | 91% | 1.14(0.98,1.32) | 1.10 (0.95,1.28) |
| Apr 2014-Sep 2014 | 15 (10,28) | 93% | 1.24(1.06,1.44) | 1.19 (1.02,1.39) |
| Oct 2014-Apr 2015 | 14 (10,23) | 93% | 1.40(1.19,1.63) | 1.38 (1.18,1.62) |
| County of Service | ||||
| Original, pre-Expansion (n=7) | 16 (10,30) | 89% | Ref. | |
| Original, post-Expansion (n=7) | 15 (10,27) | 93% | 1.12(1.01,1.25) | |
| Additional, post-Expansion (n=12) | 16 (10,29) | 91% | 1.05 (0.91,1.20) | |
| Age, years | ||||
| <40 | 12 (7,19) | 96% | 1.32(1.18,1.48) | 1.15 (1.01,1.30) |
| 40–49 | 15 (10,26) | 94% | Ref. | Ref. |
| 50–64 | 19 (11,35) | 89% | 0.78 (0.71,0.86) | 0.77 (0.70,0.85) |
| ≥65 | 22 (11,38) | 81% | 0.62 (0.46,0.83) | 0.66 (0.49,0.90) |
| Race-Ethnicity | ||||
| White | 14 (9,26) | 94% | Ref. | Ref. |
| Black | 18 (11,36) | 88% | 0.75 (0.66,0.87) | 0.72 (0.62,0.82) |
| Hispanic | 15 (10,27) | 92% | 0.91 (0.83,1.00) | 0.79 (0.72,0.88) |
| Other-Unknown | 19 (10,37) | 87% | 0.67 (0.55,0.83) | 0.70 (0.57,0.86) |
| Language Preference | ||||
| English | 15 (9,27) | 92% | Ref. | |
| Other | 16 (11,29) | 92% | 0.96 (0.89,1.04) | |
| Symptom Status | ||||
| Asymptomatic | 17 (11,31) | 91% | Ref. | Ref. |
| Symptomatic | 11 (7,19) | 94% | 1.57(1.43,1.73) | 1.35 (1.21,1.51) |
| Insurance Status | ||||
| No | 15 (10,27) | 92% | Ref. | Ref. |
| Yes | 20 (12,34) | 90% | 0.78 (0.67,0.91) | 0.81 (0.69,0.96) |
| Federal Poverty Level | ||||
| 0–100 | 15 (10,29) | 90% | Ref. | |
| 101–200 | 16 (10,27) | 95% | 1.11 (1.01,1.20) | |
| ≥201 | 16 (11,26) | 93% | 1.00 (0.86,1.16) | |
IQR: Interquartile Range; HR: Hazard Ratio; CI: Confidence Interval “National Breast and Cervical
Cancer Early Detection Program Quality Metric
Multivariable model adjusted for Time Period, Age, Symptom status, Race-Ethnicity, and Insurance status
Time to resolution for each program expansion time period was similar (range: 14–18 days; Figure 2). Although significantly shorter for the 2nd, 4th and 5th time periods when compared to the 1st (14–16 days vs. 17 days, respectively), the time difference is not clinically meaningful. Compared to women aged 40–49 years (15 days), older women had longer TTR (19 days for age 50–64 and 23 days for 65 and older); by contrast, women less than age 40 had shorter TTR (13 days). Compared to Whites (15 days), TTR was longer for Hispanics (16 days), Blacks (19 days), and Other/Unknown race-ethnicity (20 days). TTR was longer for women with insurance compared to no insurance (21 days vs 15 days) and asymptomatic women compared to those reporting symptoms at intake (18 days vs 12 days).
Figure 2.
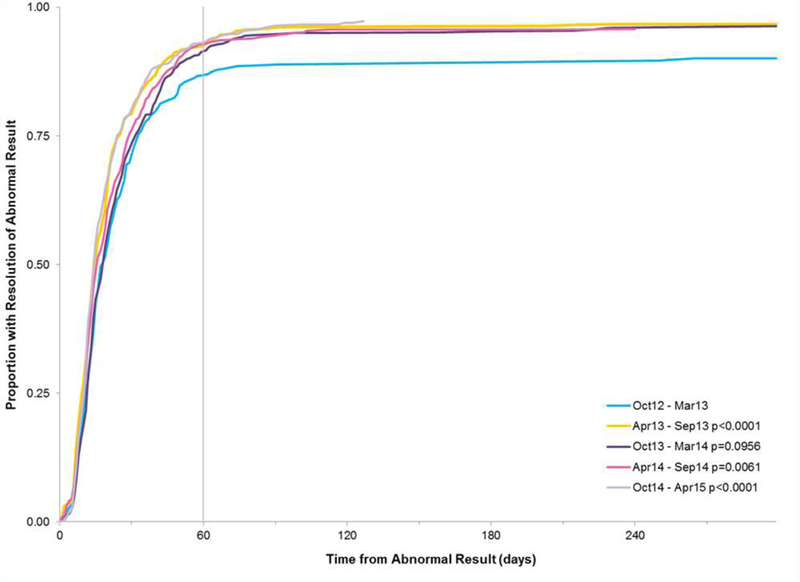
Time to Resolution by Time Period
For women who reached diagnostic resolution and who did not have a first abnormal result of BI-RAD 3 (n=2,362; 82.3%), we evaluated whether TTR differs between women who received services in one versus more than one county. Only a small proportion of women needed to transfer to a different county for resolution (n=293; 12.4%). Time to resolution differed significantly between the two groups (Wilcoxon 2 sample test, p < .001); median time to resolution was 15 days for women who received services in one county compared to 26 days for women who received services in more than one county. Despite needing to transfer to a different county, 91.5% of women were resolved within 60 days; comparatively, 96.2% of women who did not transfer were resolved within that same timeframe.
Proportion achieving NBCCEDP Quality Metric
Overall, 92% of the women were resolved within 60 days - well above the NBCCEDP quality metric of 75%. The percentage of those resolved within 60 days ranged from 81% to 96% for each program expansion time period and patient characteristic (Table 2).
BI-RAD 3 Results
Four hundred women (14%) received an abnormal result of BI-RAD 3 during the study period. Only 59.3% (n=237) of the BI-RAD 3 results were resolved during the study window; most of the women were resolved with one service (94.9% or n=225). The most common resolution result after a BI-RAD 3 was another BI-RAD 3 (57.8% or n=137). Not surprisingly, median TTR differed significantly between women with BI-RAD 3 results and women with the remaining abnormal results (208 days vs. 16 days, respectively; Figure 3); however given the required 180 day (6 month) waiting period between first and second services, the remaining 28 day median result falls well within the NBCCEDP quality standards.
Figure 3. Time to Resolution by Type of Abnormal Result.
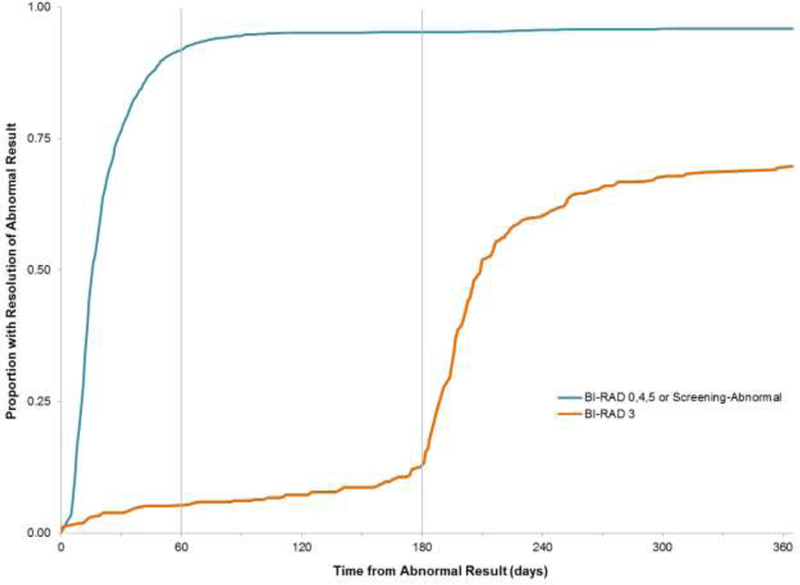
The American Cancer Society recommends that patients who receive a BI-RAD 3 screening result undergo repeat short-interval (within 6–9 months) follow-up imaging.(30) Therefore we would expect that by 180 days following an abnormal result the women with a BI-RAD 3 result would start to reach the same proportion resolved as the women with BI-RAD 0, 4, 5 and Screening-Abnormal results.
DISCUSSION
Our findings demonstrate that our screening and navigation delivery model maintained a high quality of service during expansion of the program to rural underserved populations, as measured by time to resolution. Further, TTR following an abnormal screening result followed patterns similar to national-level NBCCEDP data.(5, 12, 18, 23)
We provide important data on an under-studied population: a large, mostly uninsured, community-based rural sample in which many participants lacked a primary provider for preventive care.(14, 31, 33) BSPAN served women from across a large rural region and, because some counties did not have access to certain diagnostic procedures, many participants were navigated across county lines through the BSPAN provider network.(26, 34) Moreover, a significant proportion of women in our analysis were minority (64% Black or Hispanic) and preferred to receive services in Spanish (42%). Sustaining quality metrics in this underserved population is critical, given disparities in TTR and screening completion rates among rural-residing, racial/ethnic minority, poor, and uninsured populations nationally. (5, 35)
Our findings are important to rural areas, like North Texas, where there are few integrated healthcare systems and delivery of cancer screening services must be coordinated among providers with different clinical information systems. Most studies of cancer care delivery among rural populations have largely focused on treatment, addressing challenges facing interdisciplinary community oncology teams,(36) remote communications like tele- and video- conferencing,(37) and remote supervision of local clinicians treating patients in rural settings.(38) Less is known about how to optimize community-based programs that navigate women through the breast cancer screening process across different clinical provider networks.(27) Our program demonstrates that a virtually-integrated network of providers can be effective in extending access to high quality breast cancer screening services among rural-residing, uninsured, underserved women.(26) Longer time to resolution (~1-5 days) for older, minority and Spanish-speaking women suggest that all programs should monitor for potential disparities to determine if provider-level solutions should be implemented (e.g. recruit more Spanish-speaking staff among contracted providers or utilize telephone-based interpreter assistance).
Currently, NBCCEDP state affiliates require contractors to provide screening mammograms within 60 days of clinical breast exams, and time from initial abnormal result to diagnosis within 60 days for contracted providers to be eligible for reimbursement.(39) However, these metrics enable service providers to exclude patients with BI-RAD 3 results from their quality reporting, given the ACR-recommended ≤9 month follow-up. To facilitate comparison with other studies, we chose to exclude BI-RAD 3 patients from the TTR analysis;(23) and report BI-RAD 3 rate of completing subsequent imaging.(10) Our data indicate that women with BI-RAD 3 results (14% of our sample) have lower completion rates. NBCCEDP should consider a separate quality metric for BI-RAD 3 outcomes that recognizes that this subset of women still require timely follow-up to diagnostic resolution.
Literature on timeliness emphasizes abnormal follow-up, with start time defined as the date of abnormal result and the end time as the date of diagnostic resolution. We are unaware of studies evaluating the time from patient-initiated request for screening services to patients’ receipt of “normal” results. This presents an important gap in knowledge, particularly among rural-residing women who may face delays between clinical breast exams and screening mammography due to the relative scarcity of mammography resources.(40) To evaluate time to receipt of results among women with normal results, programs would need to systematically document when a woman initiates contact seeking to schedule a screening appointment; perhaps with stronger linkages between EHRs and navigation tracking. Some evidence suggests lack of provider responsiveness to initial patient inquiry (e.g. to review eligibility or schedule an appointment) can negatively impact patient screening services completion, especially among indigent or uninsured women.(8, 41–43) In this sense, although statistically significant, the one to three day differences between time periods that we identify were not clinically meaningful but might well impact to patient satisfaction and thereby rates of loss-to-follow-up.
If NBCCEDP contractors were required to report quality metrics for TTR regardless of screening results, then contractors would have to document outcomes for all patients who initiate screening requests. Dissatisfaction with information and communication during the screening process,(44) long wait times or inconvenient times for appointments,(45) and delays in the receipt of test results(41) may be associated with dissatisfaction with screening experiences and go on to impact compliance to subsequent biennial screening.(46, 47) Future mixed-method studies could enhance understanding of mechanisms by which negative screening experiences may affect subsequent primary and preventive care services at recommended intervals.
Given characteristics of the BSPAN target population, our findings may not be easily generalizable to higher income populations or those with insurance. Due to Texas NBCCEDP eligibility guidelines, our cohort of women includes many reporting breast health issues at initial presentation and many less than 40 years old (the latter are considered eligible if they report symptoms or a family history of breast cancer).(39) The NBCCEDP program and other payers (e.g., Komen Foundation) emphasized increasing access among uninsured, underserved, rural populations; this program focus may have inadvertently led patient navigators to prioritize getting uninsured women to complete follow-up and resulted in the slightly elevated TTR among insured women. Thus, the shorter TTR rate among uninsured vs. insured women (15 vs. 21 days, respectively) may not be reflected in other rural settings with higher rates of insurance coverage or with different protocols for managing follow-up.(48)
CONCLUSION
Maintaining high quality of services during geographic scale-up is possible for screening delivery programs caring for rural, uninsured and minority women through a virtually-integrated provider network. Others programs implementing regional service delivery models should evaluate if loss to follow-up across the screening continuum is minimized for other populations experiencing breast cancer health disparities. Importantly, we stratified our analysis of TTR (BIRADS 0, 4, 5 vs. BI-RADs 3), and recognized that guidelines recommend a 180-day waiting period before performing a repeat mammogram for BI-RADS 3 (indeterminate) results. This analytic approach revealed sub-optimal completion of follow-up among women with a BI-RADS 3 not visible in previous reports. To ensure appropriate and timely follow-up of all abnormal mammograms, a separate performance metric for BI-RADs 3 should be considered by policymakers and administrators of screening programs.
Acknowledgments:
This study was funded by the Cancer Prevention Research Institute of Texas (PP120097; PP150053; Lee), which has underwritten the BSPAN clinical screening and navigation program since 2009. Additional support was provided by the National Cancer Institute (5P30CA142543) to the Harold C. Simmons Comprehensive Cancer Center and National Institutes of Health (NCATS UL1TR001105) to the UT Southwestern Center for Translational Medicine. Drs. Lee and Tiro are also supported by funding from the Agency for Healthcare Research and Quality (R24 HS022418) to the UT Southwestern Center for Patient-Centered Outcomes Research. The authors thank Melanie Carithers and Early Detection Program colleagues at Moncrief Cancer Institute for their ongoing collaboration and dedication to patients, and the many county partner organizations.
All procedures performed in studies involving human participants were in accordance with the ethical standards of the institutional and/or national research committee and with the 1964 Helsinki declaration and its later amendments or comparable ethical standards. The study was approved by UT Southwestern Institutional Review Board (STU 022012–009; PI: Lee).
Acronyms:
- BCCS
Breast and Cervical Cancer Services (Texas’ NBCCEDP-funded program)
- BSPAN
Breast Screening and Patient Navigation program
- BI-RAD
Breast Imaging-Reporting and Data System
- NBCCEDP
National Breast and Cervical Cancer Early Detection Program
- TTR
time to resolution
Appendix
Appendix A.
Breast Cancer Screening Continuum: Analysis by Screening Test, Result, and Follow-up Recommendations
| Screening test |
Screening result | Clinically recommended follow-up(49) |
Analysis |
|---|---|---|---|
| SCR-m | Normal | None | Diagnostic resolution |
| Abnormal | Additional imaging ≤3 months | Abnormal, additional testing needed | |
| DX-m | BI-RAD 0 Incomplete |
Repeat imaging ≤3 months | Additional testing needed |
| BI-RAD 1 Negative |
None | Diagnostic resolution | |
| BI-RAD 2 Benign |
None | Diagnostic resolution | |
| BI-RAD 3 Probably benign |
Additional imaging ≤9 months | Analyzed separately | |
| BI-RAD 4 Suspicious abnormality |
Additional imaging or biopsy ≤3 months | Abnormal, additional testing needed | |
| BI-RAD 5 Highly suggestive of malignancy |
Additional imaging or biopsy ≤3 months | Abnormal, additional testing needed | |
| Biopsy | Positive | None | Diagnostic resolution |
| Negative | None | Diagnostic resolution |
SCR-m = screening mammogram
DX-m = diagnostic mammogram
BI-RAD = Breast Imaging-Reporting and Data System
Additional imaging may include mammography, digital tomosynthesis, ultrasound, or MRI
Footnotes
All authors declare no conflicts of interest
References
- 1.Elmore JG. (2016) Review: Mammography screening reduces breast cancer mortality in women at average risk. Ann Intern Med. 164: Jc26. [DOI] [PubMed] [Google Scholar]
- 2.Beaber EF, Kim JJ, Schapira MM, et al. (2015) Unifying screening processes within the PROSPR consortium: a conceptual model for breast, cervical, and colorectal cancer screening. J Natl Cancer Inst. 107: djv120. [DOI] [PMC free article] [PubMed] [Google Scholar]
- 3.Taplin SH, Yabroff KR, Zapka J. (2012) A Multilevel Research Perspective on Cancer Care Delivery: The Example of Follow-Up to An Abnormal Mammogram. Cancer Epidemiology Biomarkers & Prevention. 21: 1709–15. [DOI] [PMC free article] [PubMed] [Google Scholar]
- 4.Oeffinger KC, Fontham EH, Etzioni R, et al. (2015) Breast cancer screening for women at average risk: 2015 guideline update from the american cancer society. JAMA. 314: 1599–614. [DOI] [PMC free article] [PubMed] [Google Scholar]
- 5.Goldman LE, Walker R, Hubbard R, Kerlikowske K, Consortium BCS. (2013) Timeliness of abnormal screening and diagnostic mammography follow-up at facilities serving vulnerable women. Medical care. 51: 307. [DOI] [PMC free article] [PubMed] [Google Scholar]
- 6.Leung J, McKenzie S, Martin J, McLaughlin D. (2014) Effect of rurality on screening for breast cancer: a systematic review and meta-analysis comparing mammography. Rural and Remote Health. 14: 2730. [PubMed] [Google Scholar]
- 7.US Census Bureau. (2010) 2010 Census Urban and Rural Classification and Urban Area Criteria, Percent Urban and Rural in 2010 by State and County. Washington DC: US Census Bureau. [Google Scholar]
- 8.Allen JD, Shelton RC, Harden E, Goldman RE. (2008) Follow-up of abnormal screening mammograms among low-income ethnically diverse women: Findings from a qualitative study. Patient Education and Counseling. 72: 283–92. [DOI] [PubMed] [Google Scholar]
- 9.Katz ML, Young GS, Reiter PL, et al. (2013) Barriers reported among patients with breast and cervical abnormalities in the patient navigation research program: impact on timely care. Womens Health Issues. [DOI] [PMC free article] [PubMed] [Google Scholar]
- 10.Raich PC, Whitley EM, Thorland W, Valverde P, Fairclough D. (2012) Patient navigation improves cancer diagnostic resolution: an individually randomized clinical trial in an underserved population. Cancer Epidemiology, Biomarkers & Prevention. [DOI] [PMC free article] [PubMed] [Google Scholar]
- 11.Dudley DJ, Drake J, Quinlan J, et al. (2012) Beneficial Effects of a Combined Navigator/Promotora Approach for Hispanic Women Diagnosed with Breast Abnormalities. Cancer Epidemiology Biomarkers & Prevention. 21: 1639–44. [DOI] [PMC free article] [PubMed] [Google Scholar]
- 12.Markossian TW, Darnell JS, Calhoun EA. (2012) Follow-Up and Timeliness After an Abnormal Cancer Screening Among Underserved, Urban Women in a Patient Navigation Program. Cancer Epidemiology Biomarkers & Prevention. 21: 1691–700. [DOI] [PMC free article] [PubMed] [Google Scholar]
- 13.Hoffman HJ, LaVerda NL, Young HA, et al. (2012) Patient Navigation Significantly Reduces Delays in Breast Cancer Diagnosis in the District of Columbia. Cancer Epidemiology Biomarkers & Prevention. 21: 1655–63. [DOI] [PMC free article] [PubMed] [Google Scholar]
- 14.Paskett ED, Katz ML, Post DM, et al. (2012) The Ohio Patient Navigation Research Program: Does the American Cancer Society Patient Navigation Model Improve Time to Resolution in Patients with Abnormal Screening Tests? Cancer Epidemiology Biomarkers & Prevention. 21: 1620–8. [DOI] [PMC free article] [PubMed] [Google Scholar]
- 15.Wells KJ, Lee JH, Calcano ER, et al. (2012) A cluster randomized trial evaluating the efficacy of patient navigation in improving quality of diagnostic care for patients with breast or colorectal cancer abnormalities. Cancer Epidemiol Biomarkers Prev. 21: 1664–72. [DOI] [PMC free article] [PubMed] [Google Scholar]
- 16.Tiro JA, Inrig SJ, Balasubramanian BA, et al. (in press 2018) Clinic variation in colorectal cancer screening in an integrated system. Population Health Management. [Google Scholar]
- 17.Lee SJC, Inrig SJ, Balasubramanian BA, et al. (2018) Identifying quality improvement targets to facilitate colorectal cancer screening completion. Preventive medicine reports. 9: 138–43. [DOI] [PMC free article] [PubMed] [Google Scholar]
- 18.Krok-Schoen JL, Kurta ML, Weier RC, et al. (2015) Clinic Type and Patient Characteristics Affecting Time to Resolution after an Abnormal Cancer-Screening Exam. Cancer Epidemiology Biomarkers & Prevention. 24: 162–8. [DOI] [PMC free article] [PubMed] [Google Scholar]
- 19.Milat AJ, Bauman A, Redman S. (2015) Narrative review of models and success factors for scaling up public health interventions. Implementation Science : IS. 10: 113. [DOI] [PMC free article] [PubMed] [Google Scholar]
- 20.Yancy B, Royalty JE, Marroulis S, Mattingly C, Benard VB, DeGroff A. (2014) Using data to effectively manage a national screening program. Cancer. 120: 2575–83. [DOI] [PMC free article] [PubMed] [Google Scholar]
- 21.Siegl EJ, Miller JW, Khan K, Harris SE. (2014) Quality assurance through quality improvement and professional development in the National Breast and Cervical Cancer Early Detection Program. Cancer. 120: 2584–90. [DOI] [PMC free article] [PubMed] [Google Scholar]
- 22.Martinez-Donate A, Halverson J, NJ S, et al. (2013) Identifying health literacy and health system navigation needs among rural cancer patients: findings from the Rural Oncology Literacy Enhancement Study (ROLES). J Canc Educ. [DOI] [PMC free article] [PubMed] [Google Scholar]
- 23.Richardson LC, Royalty J, Howe W, Helsel W, Kammerer W, Benard VB. (2010) Timeliness of breast cancer diagnosis and initiation of treatment in the National Breast and Cervical Cancer Early Detection Program, 1996–2005. Am.J.Public Health. 100: 1769–76. [DOI] [PMC free article] [PubMed] [Google Scholar]
- 24.Benard VB, Howe W, Royalty J, Helsel W, Kammerer W, Richardson LC. (2012) Timeliness of cervical cancer diagnosis and initiation of treatment in the National Breast and Cervical Cancer Early Detection Program. J Womens Health (Larchmt). 21: 776–82. [DOI] [PMC free article] [PubMed] [Google Scholar]
- 25.Inrig SJ, Higashi RT, Tiro JA, Argenbright KE, Lee SJC. (2017) Assessing local capacity to expand rural breast cancer screening and patient navigation: An iterative mixed-method tool. Evaluation and Program Planning. 61: 113–24. [DOI] [PMC free article] [PubMed] [Google Scholar]
- 26.Lee SJC, Higashi RT, Inrig SJ, et al. (2017) County-level outcomes of a rural breast cancer screening outreach strategy: a decentralized hub-and-spoke model (BSPAN2). Translational Behavioral Medicine. 1–9. [DOI] [PMC free article] [PubMed] [Google Scholar]
- 27.Argenbright K, Anderson RP, Senter M, Lee SJC. (2013) Breast screening and patient navigation in rural Texas counties: Strategic steps. Texas Public Health Journal. 65: 25–7. [Google Scholar]
- 28.Robinson JC, Casalino LP. (1996) Vertical integration and organizational networks in health care. Health Affairs 15: 7–22. [DOI] [PubMed] [Google Scholar]
- 29.Inrig SJ, Tiro JA, Melhado TV, Argenbright KE, Craddock Lee SJ. (2014) Evaluating a de-centralized regional delivery system for breast cancer screening and patient navigation for the rural underserved. Texas Public Health Journal. 66: 25–34. [PMC free article] [PubMed] [Google Scholar]
- 30.American Cancer Society. (2016) What is a BI-RADS score?
- 31.Battaglia TA, Bak SM, Heeren T, et al. (2012) Boston Patient Navigation Research Program: The Impact of Navigation on Time to Diagnostic Resolution after Abnormal Cancer Screening. Cancer Epidemiology Biomarkers & Prevention. 21: 1645–54. [DOI] [PMC free article] [PubMed] [Google Scholar]
- 32.Tosteson AN, Beaber EF, Tiro J, et al. (2016) Variation in Screening Abnormality Rates and Follow-Up of Breast, Cervical and Colorectal Cancer Screening within the PROSPR Consortium. J Gen Intern Med. 31: 372–9. [DOI] [PMC free article] [PubMed] [Google Scholar]
- 33.Lee JH, Fulp W, Wells KJ, Meade CD, Calcano E, Roetzheim R. (2013) Patient Navigation and Time to Diagnostic Resolution: Results for a Cluster Randomized Trial Evaluating the Efficacy of Patient Navigation among Patients with Breast Cancer Screening Abnormalities, Tampa, FL. PLoS ONE. 8: e74542. [DOI] [PMC free article] [PubMed] [Google Scholar]
- 34.Caplan LS, Helzlsouer KJ, Shapiro S, Wesley MN, Edwards BK. (1996) Reasons for delay in breast cancer diagnosis. Prev Med. 25: 218–24. [DOI] [PubMed] [Google Scholar]
- 35.Katz ML, Kauffman RM, Tatum CM, Paskett ED. (2008) Influence of church attendance and spirituality in a randomized controlled trial to increase mammography use among a low-income, tri-racial, rural community. Journal of religion and health. 47: 227–36. [DOI] [PMC free article] [PubMed] [Google Scholar]
- 36.Gaudet A, Kelley ML, Williams A. (2014) Understanding the distinct experience of rural interprofesional collaboration in developing palliative care programs. Rural and Remote Health. 14. [PubMed] [Google Scholar]
- 37.Whitten P, Holtz B, Nguyen L. (2010) Keys to a successful and sustainable telemedicine program. Int.J Technol.Assess.Health Care. 26: 211–6. [DOI] [PubMed] [Google Scholar]
- 38.George M, Ngo P, Prawira A. (2014) Rural Oncology: Overcoming the Tyranny of Distance for Improved Cancer Care. Journal of Oncology Practice. 10: e146–e9. [DOI] [PubMed] [Google Scholar]
- 39.Texas State Department of Health Services (DSHS). (2011) Policy and Procedure Manual for Breast and Cervical Cancer Services, Fiscal Year 2012. Austin, TX.
- 40.Elkin EB, Ishill NM, Snow JG. (2010) Geographic access and the use of screening mammography. Med Care. 48. [DOI] [PMC free article] [PubMed] [Google Scholar]
- 41.Post DM, McAlearney AS, Young GS, Krok-Schoen JL, Plascak JJ, Paskett ED. (2015) Effects of Patient Navigation on Patient Satisfaction Outcomes. Journal of cancer education : the official journal of the American Association for Cancer Education. 30: 728–35. [DOI] [PMC free article] [PubMed] [Google Scholar]
- 42.Schutt RK, Cruz ER, Woodford ML. (2008) Client satisfaction in a breast and cervical cancer early detection program: the influence of ethnicity and language, health, resources, and barriers. Women & health. 48: 283–302. [DOI] [PubMed] [Google Scholar]
- 43.Goldstein LJ, Miller BJ, Nicotera N, Pendleton D. (2014) Reducing the time from initial call to first appointment: the impact of patient access redesign and a nurse navigation program. Journal of the National Comprehensive Cancer Network : JNCCN. 12 Suppl 1: S16–8. [DOI] [PubMed] [Google Scholar]
- 44.Brett J, Bankhead C, Henderson B, Watson E, Austoker J. (2005) The psychological impact of mammographic screening. A systematic review. Psycho-oncology. 14: 917–38. [DOI] [PubMed] [Google Scholar]
- 45.Azami-Aghdash S, Ghojazadeh M, Sheyklo SG, et al. (2015) Breast Cancer Screening Barriers from the Womans Perspective: a Meta-synthesis. Asian Pacific journal of cancer prevention : APJCP. 16: 3463–71. [DOI] [PubMed] [Google Scholar]
- 46.Edwards SA, Chiarelli AM, Ritvo P, Stewart L, Majpruz V, Mai V. (2011) Satisfaction with initial screen and compliance with biennial breast screening at centers with and without nurses. Cancer Nurs. 34: 293–301. [DOI] [PubMed] [Google Scholar]
- 47.Peipins LA, Shapiro JA, Bobo JK, Berkowitz Z. (2006) Impact of women’s experiences during mammography on adherence to rescreening (United States). Cancer Causes Control. 17: 439–47. [DOI] [PubMed] [Google Scholar]
- 48.Cole MB, Wright B, Wilson IB, Omar Galarraga, Trivedi AN. (2018) Medicaid Expansion And Community Health Centers: Care Quality And Service Use Increased For Rural Patients. Health Affairs. 37: 900–7. [DOI] [PMC free article] [PubMed] [Google Scholar]
- 49.Sickles E, CJ DO. (2013) ACR BI-RADS® Follow-up and Outcome Monitoring ACR BI-RADS® Atlas, Breast Imaging Reporting and Data System. Reston, VA: American College of Radiology. [Google Scholar]