

Abstract
HIV and pathogenic SIV infection are characterized by mucosal dysfunction including epithelial barrier damage, loss of Th17 cells, neutrophil infiltration, and microbial translocation with accompanying inflammation. However, it is unclear how and when these contributing factors occur relative to one another. In order to determine if any of these features initiates the cycle of damage, we longitudinally evaluated the kinetics of mucosal and systemic T cell activation, microbial translocation, and Th17 cell and neutrophil frequencies following intrarectal SIV infection of rhesus macaques. We additionally assessed the colon proteome to elucidate molecular pathways altered early after infection. We demonstrate increased T cell activation (HLA-DR+) beginning 3-14 days post-SIV challenge, reduced peripheral zonulin 3-14 days post-SIV, and evidence of microbial translocation 14 days post-SIV. The onset of mucosal dysfunction preceded peripheral and mucosal Th17 depletion, which occurred 14-28 days post-SIV and gut neutrophil accumulation was not observed. Proteins involved in epithelial structure were downregulated 3 days post-SIV followed by an upregulation of immune proteins 14 days post-SIV. These data demonstrate that immune perturbations such as Th17 loss and neutrophil infiltration occur after alterations to epithelial structural protein pathways, suggesting epithelial damage occurs prior to widespread immune dysfunction.
Introduction
Gastrointestinal (GI) mucosal damage and immune dysfunction in HIV infection result in microbial translocation and immune activation, which are major contributors to non-infectious comorbidities and mortality1–5. GI mucosal dysfunction in HIV infection includes structural damage to the epithelial barrier that results in reduced barrier integrity6. Several mechanisms have been shown to contribute to reduced GI barrier integrity in HIV infection. These include 1) enterocyte apoptosis and tight junction downregulation due to inflammatory cytokines 2) dysfunction, abnormal proliferation, and increased turnover of enterocytes caused by HIV proteins and 3) substantial CD4+ T cell depletion in the GI during acute infection, including the loss of Th17 and Th22 cells known to homeostatically maintain the epithelial barrier7–10. While the contributions of these various events to mucosal dysfunction have been well described, the kinetics have not been fully elucidated. It remains unclear which of these features of pathogenic infection may initiate mucosal damage and therefore what targets should be the focus of potential therapeutic interventions.
Local inflammation, including inflammatory cytokines and interferon responses, has been implicated in mucosal epithelial damage and systemic immune activation following SIV infection. Specifically, transcriptomics demonstrated the downregulation of tight junction proteins in the gut epithelium 2.5 days post-SIV was associated with increased IL-1β11. Another study of rhesus macaques that received an interferon antagonist during acute SIV infection suggested a role for interferon stimulated genes (ISGs) in both viral control and chronic immune activation12. However, studies longitudinally assessing mucosal protein alterations in acute SIV infection in relation to cellular features implicated in mucosal dysfunction are lacking.
Cellular features with the potential to contribute to mucosal epithelial barrier breakdown include Th17 loss and neutrophil infiltration. Th17 cells are preferentially depleted in both acute and chronic HIV and pathogenic SIV infection and their loss is associated with mucosal damage, systemic immune activation, and disease progression10, 13–15. Furthermore, during chronic HIV infection, neutrophils infiltrate the GI tract at high levels16, yet the kinetics of neutrophil infiltration and the contribution of neutrophils to mucosal dysfunction and inflammation in HIV have not previously been examined.
Here, we describe a longitudinal study utilizing simian immunodeficiency virus (SIV) infection of rhesus macaques, which is a well-characterized infection model consisting of CD4+ T cell depletion in the periphery and mucosa, mucosal dysfunction, chronic immune activation, and progression to AIDS if left untreated. We measured the changes in the mucosal proteome using a mass-spectrometry approach in longitudinal colon biopsy samples in order to delineate the relative kinetics of changes in epithelial barrier proteins and immune response proteins and their temporal relationship to cellular alterations and microbial translocation post-SIV infection. We also present a comprehensive kinetic assessment of mucosal and peripheral immune activation, Th17 depletion, and GI neutrophil frequencies measured by flow cytometry to determine which features of mucosal dysfunction precede epithelial protein alterations and microbial translocation following infection.
Results
Viral kinetics and peripheral and mucosal CD4+ T cell depletion following intrarectal SIV infection of rhesus macaques
After one round of intrarectal virus exposure, we observed detectable plasma virus in all six animals beginning 7 days post-SIV (Figure 1A). As expected for this model, plasma viremia reached an average peak viral load of 6.4×10⁷ copies/ml 14 days post-SIV and an average viral set point of 3.5×10⁶ copies/ml 28 days post-SIV. Additionally, the SIV integrase gene was amplified and sequenced from plasma, colon, and rectum to assess viral variant composition in the periphery and GI mucosa. While the proportions of each viral variant detected and the total number of viral variants detected did not differ between compartments within an animal, variation was observed between animals (Supplementary Figure 1). However, the variants found in each animal and their proportions remained consistent throughout the study, and we observed no significant changes in variant composition between days 14, 28, and 63 post-SIV in any of the compartments (data not shown). Additionally, there were no apparent differences in disease progression or measured immunological parameters among animals based on viral variant composition.
Figure 1. Dynamics of viral load and CD4+ T cell depletion in rhesus macaques following intrarectal infection with SIVMac239x.
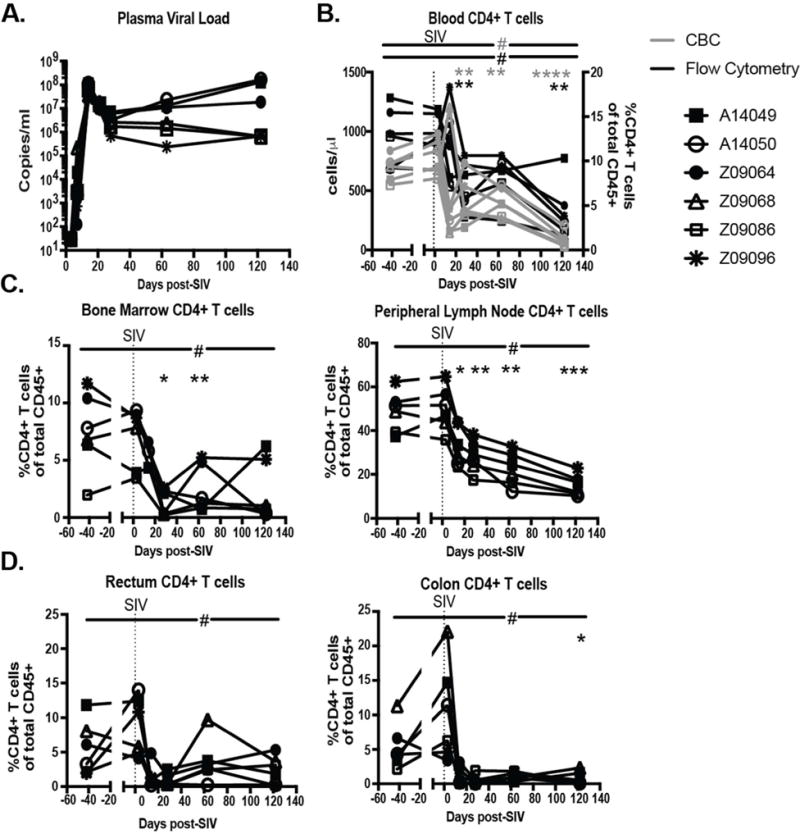
A.) SIVgag RNA copies/ml measured in plasma. B.) Blood CD4+ T cell counts as measured by CBC (grey) as cells/μl and by flow cytometry (black) as a percentage of total live, CD45+ leukocytes C.) CD4+ T cells as a percentage of total live, CD45+ leukocytes measured in whole bone marrow and peripheral lymph nodes. D.) CD4+ T cells as a percentage of total live, CD45+ leukocytes isolated from colon and rectal biopsies. All data reported are individual measurements for n=6. Significant differences determined by ANOVA with a p-value<0.05 denoted by #. Dunnett’s post-hoc analyses were performed comparing post-SIV timepoints to baseline with an adjusted p-value<0.05 denoted with *, <0.01 denoted with **, <0.001 denoted with ***, and <0.0001 denoted with ****.
As expected, blood CD4+ T cells declined dramatically early in infection with significant depletion reached 28 days post-SIV, as measured by both complete blood count (CBC) and flow cytometry (Figure 1B). Although five of the six animals dropped below 200 CD4+ T cells/μl, only one animal exhibited AIDS-defining criteria and reached clinical endpoint prior to the predetermined study endpoint (122 days post-SIV). Significant depletion of CD4+ T cells was observed in the peripheral lymph nodes beginning 14 days post-SIV and the bone marrow beginning 28 days post-SIV. We observed a loss of CD4+ T cells beginning 14 days post-SIV in the colon, although significant depletion was not observed until necropsy, and we observed a similar but less dramatic decrease in the rectum (Figure 1D). Importantly, longitudinal sampling of uninfected control animals demonstrated no effect on CD4+ T cell frequencies in GI biopsies (Supplementary Figure 2A). Taken together these data demonstrate that the animals in this study succumbed to depletion of peripheral and mucosal CD4+ T cells post SIV-infection, which is a defining characteristic of HIV infection.
Proteins involved in epithelial integrity are altered 3 days post-SIV infection followed by immune system proteins 14 days post-SIV
To determine the pathways altered early after SIV infection we measured the changes in the proteome using a mass spectrometry approach in longitudinal colon biopsy samples. We identified 1662 proteins, of those 292 were differentially expressed following SIV infection with 5% false discovery rate (FDR), for at least one time point (Figure 2A left). Following gene ontology assignment, we selected factors having roles in epithelial barrier/cell structure maintenance and the immune system to determine the relative kinetics of these two processes. A total of 105 proteins in these categories were significantly altered with a 5% FDR for at least one time point post-SIV.
Figure 2. Epithelial barrier and immune proteins show distinct kinetics of alteration in the colon during acute SIV infection.
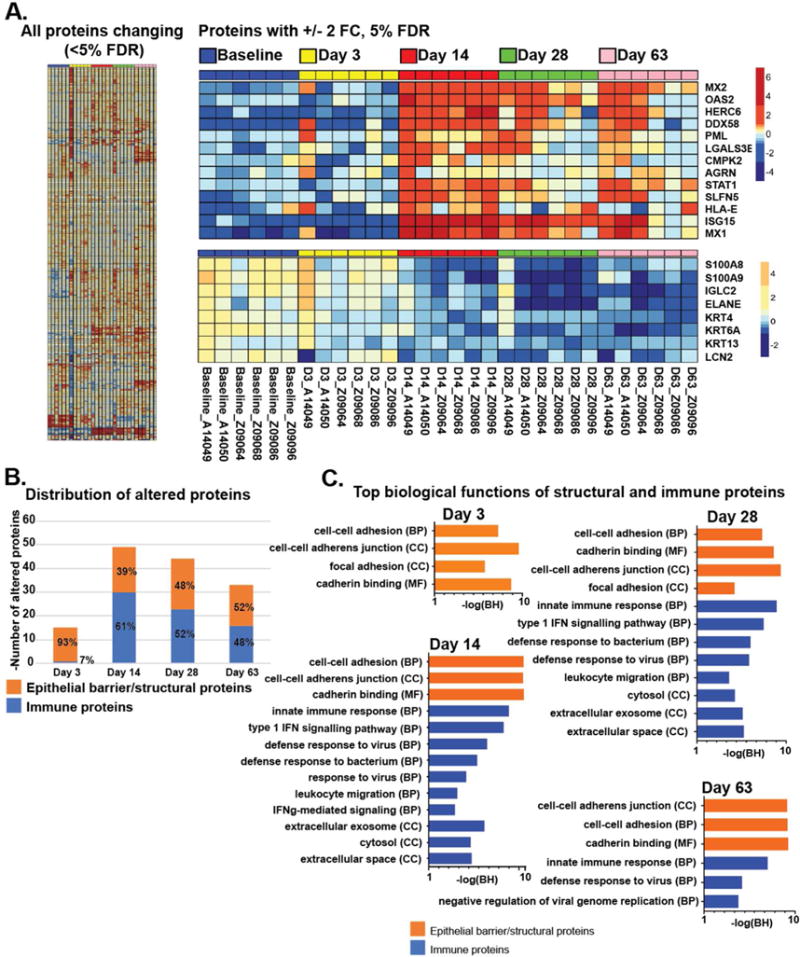
Proteins altered in colon tissue in rhesus macaques post-SIV as measured by mass spectrometry. A.) Left, large map: Heatmap of all proteins differentially abundant after SIV infection compared to pre-SIV (5% false discovery rate (FDR), n=6). Right: Proteins that were upregulated or downregulated 2.0-fold at 14 days post-SIV compared to pre-SIV (n=6; FC=fold change). B.) Number of proteins changing post SIV-infection with roles in epithelial barrier/structure and the immune response at each time point (p<0.05, log2 fold change>0.5, n=6). C.) Top biological functions (DAVID) associated with epithelial barrier/structural and immune proteins (from 1B) altered during acute infection (n=6; BH= Benjamini-Hochberg).
Hierarchical clustering of these proteins shows distinct kinetics and alterations in abundance following SIV infection (Figure 2A), and a majority of factors trended towards upregulation post-SIV (61% or 64/105 trended up at Day 3 and 66% or 69/105 trended up at later time points). Two distinct clusters of proteins showed greater than or equal to 2 fold upregulation (Figure 2A top) or downregulation (Figure 2A bottom) post-SIV compared to pre-SIV. Downregulated proteins included those with functions in epithelial maintenance (LCN2) and cell structure (keratins), which decreased as early as day 3 post-SIV (Supplementary Figure 3). Upregulated proteins included immune factors such as interferon stimulated genes MX1, MX2, OAS2, ISG15, which significantly increased by 14 days post-SIV. Differential kinetics between epithelial barrier/cell structure proteins and immune response proteins can also be visualized by including all proteins significantly altered in each category (p<0.05) over time (Figure 2B). The largest proportion of proteins altered 3 days post-SIV consisted of epithelial barrier proteins, followed by more proteins involved in immunity by 14 days post-SIV.
By assessing the top biological functions, proteins altered 3 days post-SIV are mainly associated with cell-cell and focal adhesion, specifically cadherin-mediated adhesion (Figure 2C). By 14 days post-SIV, interferon response, innate immune response, and leukocyte migration functions are activated alongside cell-cell adhesion functions. Similar pathways were altered through 63 days post-SIV, with top functions associating with cell-cell adhesions/junction, innate immune responses, and defense against virus. These data suggest that proteins involved in epithelial structure are altered prior to proteins involved in the immune response in the colonic mucosa following SIV infection. Importantly, a comparison of proteins altered between two longitudinal baseline samples demonstrated few significant protein alterations as a result of longitudinal sampling in the absence of infection, with only 7% of total proteins significantly altered between baselines and 13-28% significantly altered at post-SIV timepoints (Supplementary Figure 4). Further review of proteins altered between longitudinal baseline samples revealed that only 3/49 proteins involved in the immune response that were altered for post-SIV timepoints were also altered between baseline samples and only 8/48 proteins involved in epithelial barrier/cell structure that were altered for post-SIV timepoints were also altered between baseline samples (data not shown). These data suggest that the majority of alterations reported post-SIV are not due to longitudinal sampling variation, but to the SIV infection.
Peripheral evidence of barrier breakdown beginning 3 days post-SIV
To further assess barrier breakdown and microbial translocation, we measured zonulin, a modulator of epithelial tight junctions that is decreased in HIV infection and associated with disease progression and mortality17, and LPS binding protein (LBP), a peripheral indicator of microbial translocation increased in HIV and SIV18. We observed a significant decrease in peripheral zonulin beginning 3 days post-SIV that was sustained through 28 days post-SIV (Figure 3A). Interestingly, the zonulin levels returned to baseline in some animals following day 28 post-SIV, but dropped significantly again by necropsy. These data are in accordance with the downregulation of proteins involved in epithelial structure observed 3 days post-SIV.
Figure 3. Decreased Zonulin and increased LBP in Acute SIV Infection.
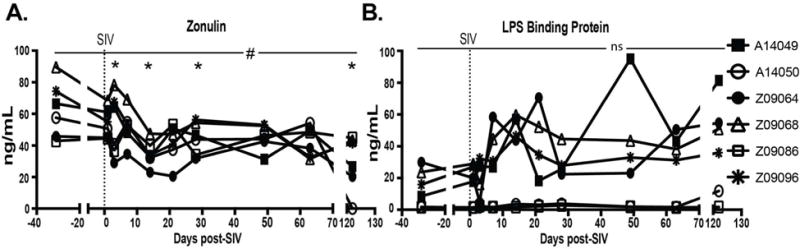
A.) Zonulin levels in plasma as measured by ELISA (n=6). A) LPS binding protein (LBP) levels in plasma as measured by ELISA (n=6). Significant differences determined by ANOVA with a p-value<0.05 denoted by #. Dunnett’s post-hoc analyses were performed comparing post-SIV timepoints to baseline with an adjusted p-value<0.05 denoted with *, <0.01 denoted with **, <0.001 denoted with ***, and <0.0001 denoted with ****.
Additionally, we observed a transient increase in LBP in the periphery 14-21 days post-SIV in 4/6 animals, however these changes did not remain significant after accounting for multiple comparisons (Figure 3B). Interestingly, LBP decreased again in most animals 28-63 days post-SIV before returning to an increased level later in chronic infection. Overall, these data provide evidence that there is early damage to the epithelium in acute SIV infection, potentially allowing microbial products to translocate, followed by a timeframe of partial recovery before succumbing to further damage in chronic infection.
Peripheral and mucosal T cell activation begins 3-14 days post-SIV
Peripheral T cell activation as measured by the expression of activation markers such as HLA-DR have been shown to be more predictive of CD4+ T cell depletion than viral load and also correlate with systemic microbial translocation19, 20. However, the kinetics of early systemic immune activation relative to epithelial barrier damage remains unclear. In order to better elucidate this, we evaluated peripheral and mucosal T cell activation longitudinally post-SIV. We observed increased CD4+ T cell activation in peripheral lymph nodes, blood, and bone marrow beginning at day 28 post-SIV (Figure 4A). In contrast, CD8+ T cells in the blood and bone marrow become activated 3 days post-SIV and remain activated throughout infection (Figure 4B) while activation of CD8+ T cells in peripheral lymph node (Figure 4B) occurs at day 14 in conjunction with peak viral load. Activation of CD4+ T cells in the mucosal tissues began at day 28 in the colon, while activation of CD4+ T cells in the rectum did not occur until day 63 (Figure 4C). Earlier activation of CD8+ T cells was observed in mucosal tissues with activation in the colon and rectum beginning at day 14 (Figure 4D). Therefore, CD4+ T cells in peripheral and mucosal tissues become activated once virus set point is reached, while CD8+ T cells in the periphery and mucosa become activated earlier than CD4+ T cells. Interestingly, the percentage of activated HLA-DR+CD8+ T cells in the colon and rectum and HLA-DR+CD4+ T cells in the colon decrease 3 days post-SIV (Figure 4C and 4D). This could be due to an influx of CD4+ and CD8+ T cells that are not activated or do not express HLA-DR in the tissues, as we observed a transient increase in the frequency of total CD4+ and CD8+ T cells in both tissues (Figure 1D and data not shown). Importantly, uninfected control animals demonstrated no significant variation in GI tract T cell activation due to longitudinal sampling (Supplementary Figure 2B). Taken together, the data we present here demonstrate that widespread systemic T cell activation is not established until 14-28 days post-SIV.
Figure 4. Kinetics of peripheral and mucosal T cell activation following intrarectal SIV infection of rhesus macaques.
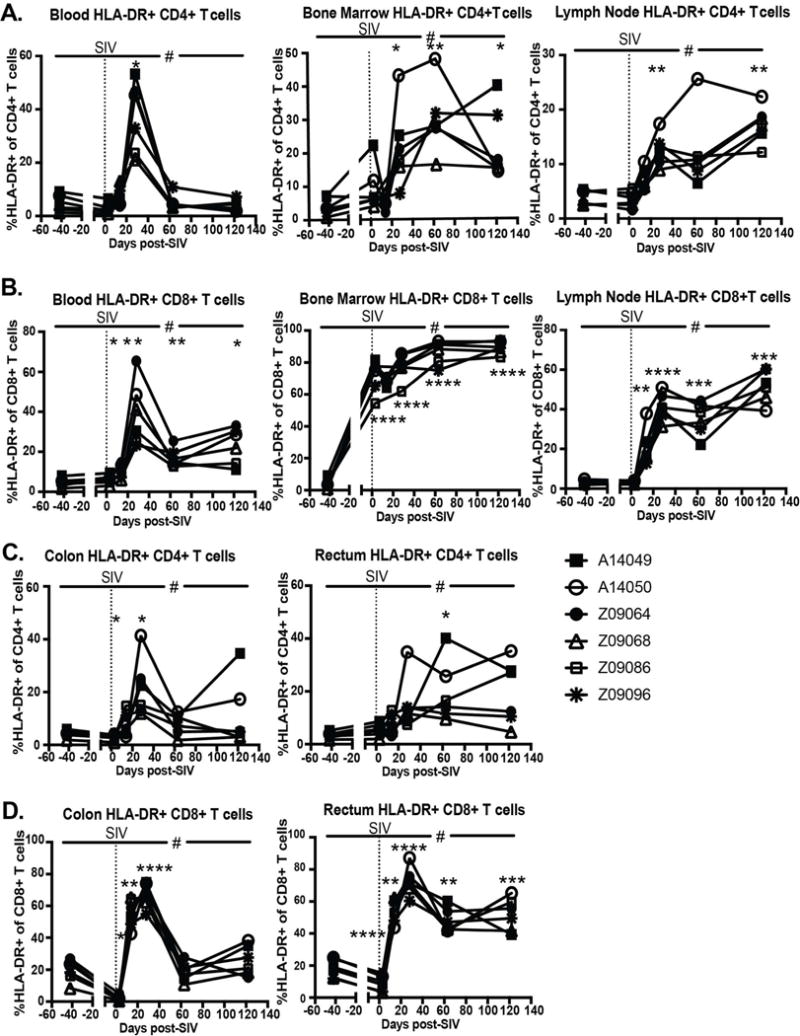
A.) Percentage of HLA-DR+ CD4+ T cells measured in whole blood, whole bone marrow, and peripheral lymph nodes. B.) Percentage of HLA-DR+ CD8+ T cells measured in whole blood, whole bone marrow, and peripheral lymph nodes. C.) Percentage of HLA-DR+ CD4+ T cells measured in leukocytes isolated from colon and rectum biopsies. D.) Percentage of HLA-DR+ CD8+ T cells measured in leukocytes isolated from colon and rectum biopsies. All data reported are individual measurements for n=6. Significant differences determined by ANOVA with a p-value<0.05 denoted by #. Dunnett’s post-hoc analyses were performed comparing post-SIV timepoints to baseline with an adjusted p-value<0.05 denoted with *, <0.01 denoted with **, <0.001 denoted with ***, and <0.0001 denoted with ****.
Loss of peripheral and mucosal Th17 cells begins 14-28 days post-SIV infection
Although Th17 cell depletion has been reported as early as 10-14 days post-SIV14, studies assessing the kinetics of their depletion in the mucosae relative to the onset of barrier breakdown and microbial translocation post-SIV are lacking. In our longitudinal study, we found that Th17 cell frequencies in peripheral lymph nodes and blood did not decline until 28 days post-SIV and were not significantly decreased until 63 days post-SIV (Figure 5A). In the mucosa, we saw evidence of Th17 cell depletion beginning 14 days post-SIV in the jejunum and colon, but significant depletion was not observed until 28 days post-SIV in the jejunum and 63 days post-SIV in the colon (Figure 5B and Figure 5C). Depletion in the rectum was not observed until necropsy, however this change was not significant. Similar analyses of Th22 cells in the periphery and mucosa reveal Th22 cells are also maintained in early acute infection and begin to decline 14 days post-SIV in the GI, particularly in the colon, followed by decline in the peripheral PBMCs beginning 28 days post-SIV and maintenance in the other tissues examined (Supplementary Figure 5). Additionally, Th17 and Th22 assessments in longitudinal colon biopsies of uninfected animals showed minimal changes over time compared to the decreases observed post-SIV (Supplementary Figure 2C). These data suggest that mucosal Th17 and Th22 depletion did not occur prior to barrier alterations and the onset of systemic immune activation in this study.
Figure 5. Kinetics of Th17 cell depletion in the periphery and mucosa following intrarectal SIV infection.
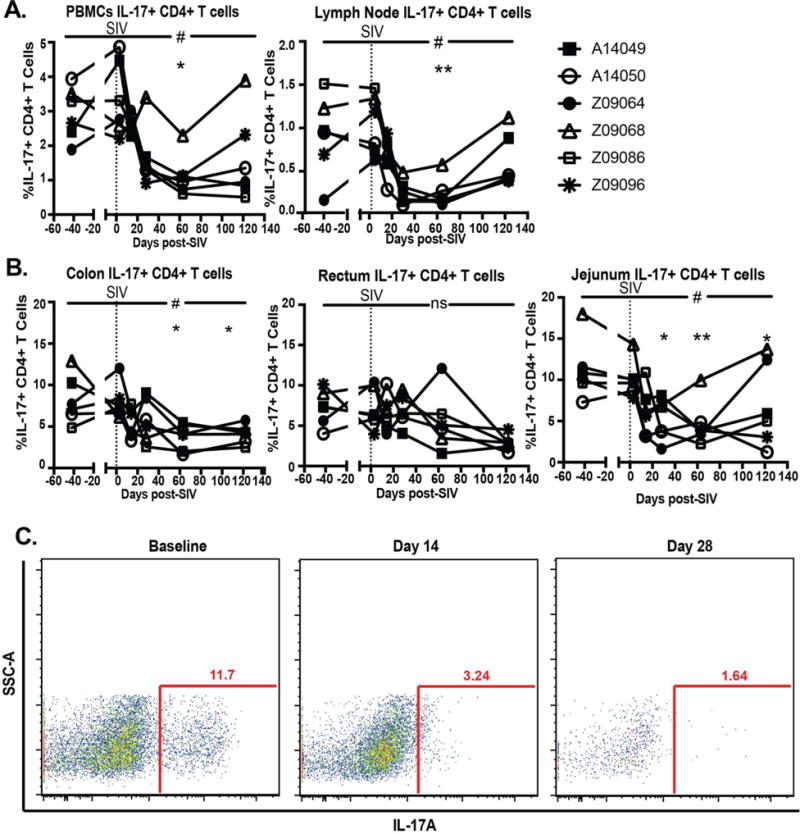
The percentage of total CD4+ T cells expressing IL-17 after 14 hours at 37°C with 10 ng/ml PMA and 1 μg/ml Ionomycin was measured at each timepoint. A.) Percentage of IL-17+ CD4+ T cells in PBMCs and peripheral lymph nodes after stimulation. B.) Percentage of IL-17+ CD4+ T cells in leukocytes isolated from colon, rectum, and jejunum biopsies after stimulation. C. Representative staining of stimulated leukocytes isolated from jejunum biopsies taken at baseline, 14 days post-SIV, and 28 days post-SIV. All data reported are individual measurements for n=6. Significant differences determined by ANOVA with a p-value<0.05 denoted by #. Dunnett’s post-hoc analyses were performed comparing post-SIV timepoints to baseline with an adjusted p-value<0.05 denoted with *, <0.01 denoted with **, <0.001 denoted with ***, and <0.0001 denoted with ****.
Neutrophils do not infiltrate GI tissues in early SIV infection
Given our data that mucosal Th17 cells are maintained early after SIV infection and the role that Th17 cells play in the neutrophil response to pathogens, we next investigated the neutrophil response after SIV infection. In order to assess neutrophil frequencies, we developed a flow cytometry panel to distinguish neutrophils in both blood and tissues (Figure 6). In short, neutrophils in macaques were defined as CD45+CD3−CD20−CD14+CD11b+HLA-DR-HighSSC cells. Markers often used to distinguish human neutrophils cannot be used in macaque studies due to lack of cross-reactive antibodies (e.g. CD15) or because macaque neutrophils do not express some human neutrophil surface markers (e.g. CD16b)21. Additionally, macaque neutrophils express levels of CD14 more similar to monocytes/macrophages than human neutrophils22. This CD14 positivity distinguishes neutrophils from CD14 low/negative eosinophils and basophils, however HLA-DR and SSC are needed to further distinguish neutrophils from CD14+ monocytes/macrophages. Confirming the separation between neutrophils and monocytes is the presence of HLA-DR+, low SSC monocytes in lymph node but a lack of cells that we define as neutrophils, as would be expected (Figure 6C). Additionally, neutrophil frequencies in the blood obtained using this panel significantly correlated with complete blood count frequencies (Figure 6D), thus validating our approach.
Figure 6. Distinguishing neutrophils in blood and tissues using flow cytometry.
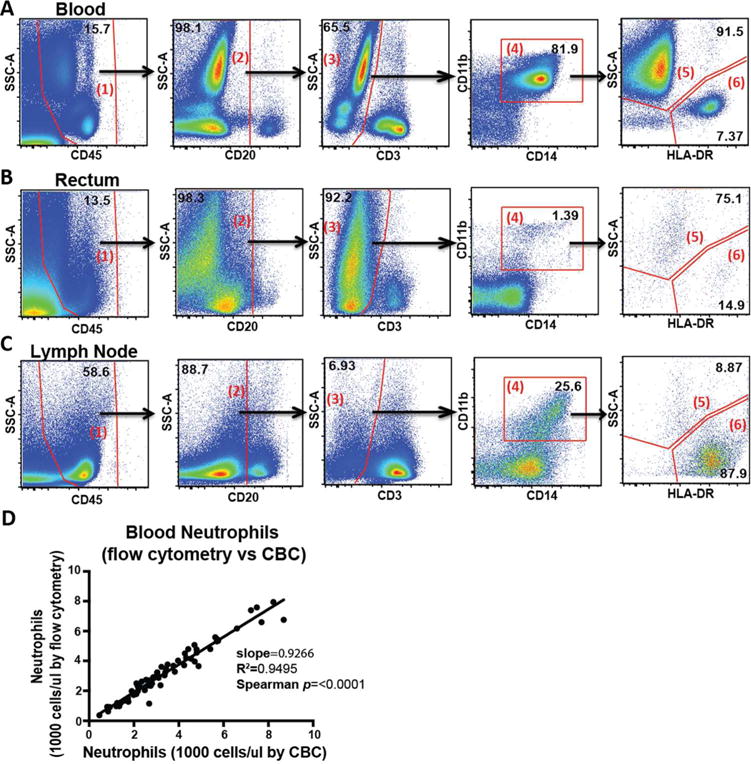
Representative plots demonstrating neutrophil gating rhesus macaque blood and tissues stained and analyzed by flow cytometry (n=1). A–C.) Whole blood (A) and leukocytes isolated from rectum biopsies (B) and lymph nodes (C) from a rhesus macaque (n=1) were gated as follows: Live cells were gated for CD45+ leukocytes (1) and CD20+ B cells (2) and CD3+ T cells (3) were excluded. Neutrophils and monocytes were then gated as CD14+CD11b+ (4). Finally, neutrophils were distinguished as high SSC, HLA-DR low cells (5) while monocytes and macrophages were distinguished as low SSC, HLA-DR+ cells (6). D.) Neutrophil frequencies as a % of total CD45+ cells obtained via flow cytometry were converted to cells/μl by multiplying by the total number of leukocytes counted by complete blood count (y axis). These data were then correlated with total neutrophils counted by complete blood count (x axis). Significance was assessed using the Spearman’s rank correlation test.
We observed decreased neutrophil frequencies in the blood and bone marrow beginning 28 days post-SIV, which reached significance in the blood 63 days post-SIV and returned to baseline by day 122 post-SIV (Figure 7A). This decrease in the blood in acute SIV infection has been previously attributed to increased neutrophil apoptosis23. In the mucosa, we observed an increase of neutrophils into the rectum and colon of some animals 3 days post-SIV infection that returned to baseline by day 14 post-SIV, however these changes were not significant (Figure 7B). Interestingly, we observed no sustained accumulation of neutrophils in the GI tissues throughout the course of the study. Myeloperoxidase (MPO) staining of colon biopsies confirmed no consistent MPO increases in the GI tissues post-SIV (Supplementary Figure 6). The MPO staining supports the neutrophil flow cytometry data, with specific animals at specific timepoints with higher neutrophil frequencies by flow cytometry (e.g. animal A14049 at day 63 and animal Z09068 at baseline) also demonstrating positive MPO staining (Supplementary Figure 6A and 6B). However, most animals showed very little positive MPO staining at all timepoints, similar to that shown for Z09086. It will be important in the future to assess the initial neutrophil response to SIV infection in a larger study.
Figure 7. The dynamics of peripheral and mucosal neutrophil frequencies following intrarectal SIV infection of rhesus macaques.
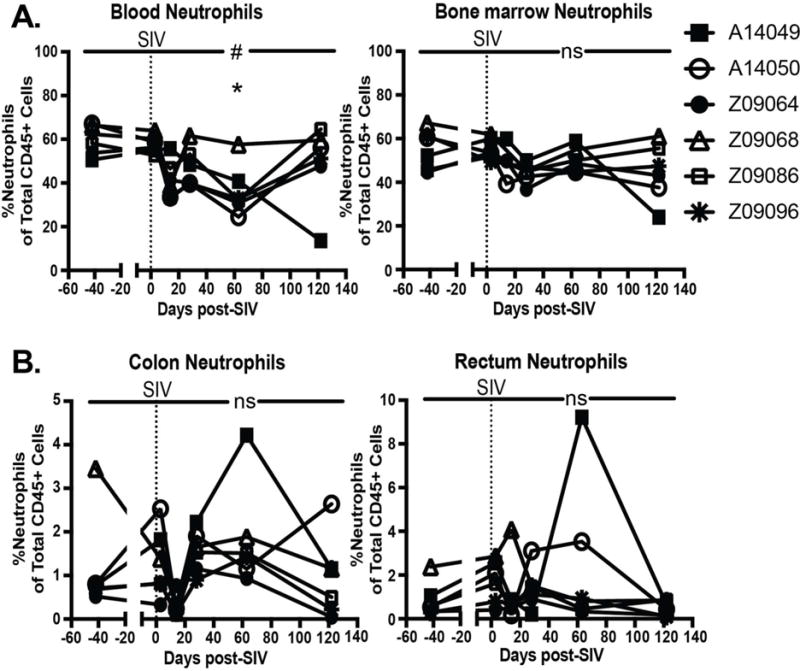
A.) Neutrophils as a percentage of CD45+, live leukocytes in whole blood and whole bone marrow. B.) Neutrophils as a percentage of CD45+, live leukocytes isolated from colon and rectum biopsies. All data reported are individual measurements for n=6. Significant differences determined by ANOVA with a p-value<0.05 denoted by #. Dunnett’s post-hoc analyses were performed comparing post-SIV timepoints to baseline with an adjusted p-value<0.05 denoted with *, <0.01 denoted with **, <0.001 denoted with ***, and <0.0001 denoted with ****.
Discussion
The events contributing to systemic immune activation and increased morbidities and mortality in HIV infection are complex and interconnected. While relationships clearly exist between mucosal dysfunction, characterized by barrier breakdown and microbial translocation, and immune activation and disease progression in chronic infection, the kinetics of these events in relation to one other has yet to be examined in a longitudinal study beginning in the early days after infection. Here, we comprehensively examined the kinetics of pathological events in both the mucosa and periphery in order to better elucidate “cause and effect” in vivo, and create a more complete understanding of the onset of important pathologies in lentiviral infection. We provide evidence that alterations to the epithelial barrier occur very early in acute infection and precede cellular immune dysfunctions such as Th17 loss and neutrophil accumulation.
Using a mass-spectrometry approach, we assessed the colon proteome to determine the earliest pathways altered in the mucosa post-SIV infection, which is the first time this innovative approach has been utilized to assess mucosal dysfunction in the context of acute lentiviral infection. Proteins downregulated early (i.e. day 3) post-SIV included proteins involved in cell structure and/or epithelial maintenance such as keratins, and epithelial barrier/cell structure proteins. Top biological functions affected 3 days post-SIV included cell-cell adhesion, focal adherens junctions, and cadherin-binding functions, indicating very early alterations to the epithelial barrier. Interestingly, immune proteins were upregulated after this, mostly at day 14 post-SIV. Top immunological pathways included the innate immune response (specifically the type 1 interferon signaling pathway), defense response to virus, defense response to bacteria, and leukocyte migration. This host response to virus occurred in conjunction with peak viremia and microbial translocation, and while the majority of these pathways were maintained through 28 days post-SIV, the type 1 interferon pathway and defense response to bacterium were no longer evident by 63 days post-SIV. This is in accordance with previous transcriptomic studies demonstrating that ISG expression increases in acute SIV infection, and although many ISGs remain significantly increased compared to baseline in chronic infection, the upregulation of ISGs in chronic infection is less dramatic, particularly in the colon13. Overall, these data suggest that at the proteome level, there are earlier changes to epithelial barrier proteins relative to immune system proteins post-SIV infection, implicating very early alterations to the epithelial barrier in pathogenic SIV infection which may precede an immune response to the viral infection, and may be the first step in the proceeding mucosal dysfunction.
Immunologically, we observed CD8+ T cell activation in rectum and colon beginning 14 days post-SIV and CD4+ T cell activation colon 28 days post-SIV and the rectum 63 days post-SIV. Although our viral sequencing approach did not detect virus in the tissues 3 days post-SIV, previous studies have detected virus in the GI tissues 7 days post-SIV and in the rectum and lymph nodes 3 days following intrarectal SHIV infection24, 25. Therefore, the early activation in mucosal tissues we observed could have been partially mediated by direct interaction with virus that remained below our level of detection or was missed in our longitudinal sampling. However, it is unlikely that a majority of this T cell activation is stimulated by virus in an antigen-specific way because the frequency of HIV-specific T cells is likely too small to represent all activated T cells measured. This is more likely a bystander effect of the inflammatory milieu, potentially induced by early epithelial disruption, as we demonstrated via proteomic analysis, allowing early microbial translocation.
We found decreased zonulin beginning 3 days post-SIV in accordance with the proteomics data suggesting downregulation of epithelial structural proteins at that time. We also observed a transient increase in LBP 14 days post-SIV, which is consistent with other studies demonstrating evidence of microbial translocation in acute infection26–27. Although not statistically significant after correcting for multiple comparisons in our small study, the increased level of LBP we measured in acute and chronic infection is similar in concentration to what has been previously observed in progressive SIV infection in macaques and HIV infection in humans18, 20. Taken together, these data suggest that barrier breakdown in the gut begins by 14 days post-SIV and may have an impact on early mucosal and systemic T cell activation.
Th17 cells are important for homeostatic maintenance of the epithelial barrier and their loss is linked to increased barrier permeability, disease progression, and microbial translocation10, 28. Although several studies have assessed Th17 cells in cross-sectional studies in chronic infection or longitudinally beginning in late acute infection, here we present a longitudinal assessment beginning very early after infection in the peripheral and gut compartments and demonstrate that Th17 cells are maintained in the periphery and mucosal tissues in early acute SIV infection. The longitudinal data we present here demonstrate that Th17 cells in the GI tissues began to decline 14 days post-infection, as can be visualized in Figure 6C, and these data are in in accordance with previous cross-sectional analyses14. It is possible that this decrease observed 14 days post-SIV was not significant because we were underpowered given our small sample size. However, given that we observed early alterations in the abundances of epithelial barrier proteins and peripheral evidence of epithelial breakdown 3 days-post infection, we can conclude that the loss of Th17 cells observed in this study did not precede barrier damage following SIV infection. It is possible that their loss perpetuates mucosal damage but is not necessarily an initial mechanism of reduced barrier integrity.
Interestingly, we observed no prolonged neutrophil accumulation in the GI tissues throughout the course of infection. Previously published data from SIV-infected macaques26 and HIV-infected individuals16 suggest that neutrophil accumulation depends on disease progression and the overall state of the immune system, and it is likely that our animals had not progressed to an adequately advanced stage of infection to demonstrate sustained neutrophil accumulation in the GI tissues. These previous studies taken together with our longitudinal data promote the hypothesis that sustained neutrophil accumulation in the gut presents after prolonged infection, immune dysfunction, and microbial translocation and is not likely contributing to early barrier damage post-infection. Better understanding of the dynamics of neutrophils in lentiviral infections will be very important in future studies.
In summary, here we demonstrated early dysregulation of pathways involved in epithelial barrier maintenance, regeneration, and repair via proteomic analysis of the colonic mucosa 3 days post-SIV. This was followed by peripheral evidence of barrier breakdown at 3-14 days post-SIV. We propose that this early barrier breakdown may lead to increased microbial translocation that contributes to mucosal and systemic T cell activation in acute infection, which we observed 3-14 days post-SIV depending on the compartment. Additionally, our data suggest that Th17 loss is not a contributing factor to the initial barrier damage, as we report Th17 cells are maintained at day 3 post-SIV and begin to decline 14 days post-SIV in the GI. Finally, we report no sustained neutrophil accumulation in the gut during early infection. While the cause of early barrier disruption remains unknown, evidence exists that viral dissemination could occur very early and interactions between epithelial cells and viral proteins or inflammatory factors trigger epithelial disruption9, 29. However, further investigation to better understand the mechanisms of early epithelial damage and the pathways involved in early protein alterations are needed. The data presented here provide evidence that local barrier damage precedes a widespread immune response and mucosal cellular alterations, and that maintenance of epithelial cell-cell adhesion proteins could be the target of future strategies to prevent mucosal dysfunction and immune activation in acute SIV infection.
Methods
Study animals and sampling schedule
Six male rhesus macaques (Macaca mulatta) were infected intrarectally with 100,000 IU (determined by TZMbl) of SIVmac239X, a swarm virus composed of 10 different molecular clones each containing 2-3 synonymous base changes in the integrase gene which act as unique molecular barcode30. All six animals became infected after one round of infection (Figure 1A). EDTA blood, bone marrow in ACD, peripheral lymph nodes, colon, rectum, and jejunum biopsy samples were collected prior to infection and on days 3, 14, and 28 and 63 days post-SIV. Baseline samples prior to infection were taken 63, 49 and 21 days pre-SIV, and data from two baseline samples were averaged and graphed as day -42. Animals were then euthanized per the protocol specified experimental endpoint between 101-141 days post-SIV and samples were graphed collectively as day 122 post-SIV. Longitudinal samples from a separate study in which rectal and colon biopsies were collected from six male rhesus macaques were additionally included in order to control for alterations in flow cytometry assessments done on longitudinal biopsy samples in the absence of infection.
Blood and tissue processing
Plasma and peripheral blood mononuclear cells (PBMCs) were separated by density gradient centrifugation, and the plasma was frozen for later analysis. Colon, rectum, and jejunum biopsies were immediately enzymatically digested as previously described31. Lymph nodes were immediately ground through 70-μm cell strainer into a single cell suspension. PBMCs and single cell suspensions of biopsies and lymph nodes were then analyzed by flow cytometry. Complete blood counts with differential were measured on a Beckman Coulter AC*T 5diff CP hematology analyzer. Viral loads were determined by real-time reverse transcription (RT)-PCR using primers specific for SIVgag as previously detailed32.
Protein extraction and digestion
Proteins were extracted from frozen colon biopsies as previously described33. Briefly, frozen tissue samples were added to 3ml of lysis buffer and homogenized. Samples were centrifuged (9000xg, 20′) aliquoted and centrifuged again (15,000xg, 20′). Final supernatants were pooled and stored at −80°C until peptide digestion and preparation for mass spectrometry as previously described34, 35. Briefly, 700μl of extracted protein was denatured with urea exchange buffer (10′ at room temp) then passed through a filter membrane. The loaded filter cartridge was incubated with 50mM iodoacetamide for 20 minutes then washed with 50mM HEPES buffer. Filters were incubated with benzonase solution (in HEPES with MgCl2) for 30 minutes at room temperature and washed with HEPES. Trypsin was added, and filters were incubated overnight (37 °C). Peptides were eluted using 50μl HEPES buffer, dried using a speed vacuum and stored at −80°C until ready for mass spectrometry analysis.
Reversed-phase liquid chromatography and Mass spectrometry
Samples were cleaned using reversed phase liquid chromatography as previously described34 (high pH RP, Agilent 1200 series micro-flow pump, Water XBridge column C18 3.5um, 2.1×100mm). The samples were dried (speed vacuum) and stored at −80 °C until quantification using LavaPep’s Fluorescent Peptide and Protein Quantification Kit (Gel Company) according to manufacturer’s protocol. Equal amounts of peptides for each sample were re-suspended (2% acetonitrile, 0.1% formic acid) and injected into a nano flow liquid chromatography system (Easy nLC, Thermo Fisher) connected inline to a Q Exactive Quadrupole Orbitrap mass spectrometer. Raw MS spectra were processed by Progenesis (Nonlinear Dynamics) and Mascot (Matrix Science) as previously described35, 36. Technical variability was determined by the addition of a protein mix of all the samples that was injected in 10 sample intervals. Search results were entered into Scaffold (v4.4.1.1; Proteome Software, Portland, OR) to determine protein identifications (80% peptide confidence; 95% protein confidence, with minimum of 2 unique peptides per protein).
Viral Variant Sequencing
Viral RNA was extracted with vRNA isolation kit (Qiagen) and reverse transcribed into cDNA using SuperScript III reverse transcription and the antisense primer SIVmacIntR1 5′-AAG CAA GGG AAA TAA GTG CTA TGC AGT AA-3′. PCR was then performed to amplify the cDNA with MiSeq adaptors added directly onto the amplicon. Reactions were prepared using High Fidelity Platinum Taq (ThermoFisher Scientific), using primers previously described30 combined with either the F5 or F7 Illumina adaptor sequence containing a unique 8 nucleotide index sequences. Reaction conditions for PCR were: 94°C, 2 min; 40× [94°C, 15 sec; 60°C, 1:30 min; 68°C, 30 sec]; 68°C, 5 min. Following PCR, 10uL from each reaction was pooled and purified using the QIAquick PCR purification kit (Qiagen). The resulting eluted DNA was quantified using the QuBit (ThermoFisher Scientific). Multiplexed samples and the PhiX control library were then diluted and loaded per the instructions provided using the MiSeq Reagent Kit v2 300 cycles (MS-102-2002; Illumina) and sequenced on the MiSeq instrument.
Flow Cytometry Staining
Surface antigen staining
Whole blood, whole bone marrow, and single cells from lymph nodes, colon biopsies, and rectum biopsies were first stained immediately with LIVE/DEAD Fixable Aqua Dead Cell Stain (ThermoFisher). Cells were then stained using the following surface antigen antibodies with clone denoted in (), from BD biosciences unless otherwise stated: CD45 PerCP (D058-1283), CD3 PE CF594 (SP34-2), CD20 PE Cy5 (2H7), CD4 Brilliant Violet 605 (Biolegend, OKT4), CD8 Brilliant Violet 570 (Biolegend, RPA-T8), CD14 Brilliant Violet 786 (Biolegend, M5E2), HLA-DR Brilliant Violet 711 (G46-6), and CD11b APC-H7 (ICRF44). Red blood cells were lysed in whole blood samples using FACs lysing solution (BD). T cells were defined as live/CD45+/CD20−/CD14−/CD3+ and CD4+ and CD8+ T cells were further delineated to assess activation by HLA-DR expression. Neutrophils were defined as live/CD45+/CD3−/CD20−/CD14+/CD11b+/HLA-DR−/HighSSC cells (Figure 7).
Intracellular cytokine staining
PBMCs and lymph node, colon, rectum, and jejnum cells were stimulated as previously described31 and stained with the following surface antigen antibodies from BD biosciences unless otherwise stated: CD45 PerCP (D058-1283), CD3 PE CF594 (SP34-2), CD4 Brilliant Violet 605 (Biolegend, OKT4), CD8 APC-H7 (SK1), CD14 Brilliant Violet 786 (Biolegend, M5E2). Following surface staining, stimulated cells were permeabilized using Cytofix/Cytoperm (BD biosciences), and stained using IL-17 PE (eBioscience, ebio64CAP17). T cells were defined as live/CD45+/CD20−/CD14−/CD3+ and CD4+ T cells were further delineated to assess IL-17 production.
Stained samples were fixed in 1% paraformaldehyde and collected on an LSR II (BD Biosciences, La Jolla, California). Analysis was performed in FlowJo (version 9.7.6, Treestar Inc., Ashland, Oregon).
Assessment of plasma cytokines and soluble factors
LPS Binding Protein (Biometic, Brixen, Italy) was assessed in plasma via ELISA using a pre-prepared kit. ELISA plates were read using an iMark Microplate Reader (Biorad, Hercules, CA).
Myeloperoxidase staining of colon biopsy tissue
Immunohistochemical staining was performed as previously described37 using a rabbit polyclonal antimyeloperoxidase antibody (1:2000; DAKO, Santa Clara, CA) on formalin-fixed paraffin embedded colon biopsies. Following staining, all slides were counterstained with hematoxylin, mounted in Permount (Fisher Scientific), and scanned at high magnification (200×) using the ScanScope CS System (Aperio Technologies) to yield images of each tissue section in their entirety. Regions of interest spanning the entire section were extracted and assessed and select images representing positive and negative staining were chosen for publication.
Statistics
Protein abundance values were generated with Progenesis Software. Outliers were determined as those with a median normalized abundance greater than one standard deviation of all samples in the run and subsequently removed prior to analysis. Proteins with >25% covariance were removed from downstream analysis. Protein abundances were then normalized by the mean, and log2 transformed. Protein differences were determined using unpaired, non-parametric Mann-Whitney tests, comparing average baseline values to each time point post-SIV (Day 3, 14, 28, 63). A false discovery rate of q < 0.05 was applied to correct for multiple comparisons to determine significantly altered proteins. Cluster analysis (RStudio) was performed on proteins differentially abundant at any time point, using Spearman rank correlation as the distance metric. Differentially abundant proteins were used to characterize top biological pathways and functions altered during acute infection, using both DAVID38, 39 (Database for Annotation, Visualization, and Integrated Discovery, v6.8) and IPA (Ingenuity® Pathway Analysis) software.
Statistical analysis of flow cytometry subsets and soluble factor data was performed using GraphPad Prism statistical software (Version 6, GraphPad Software, San Diego, CA). Longitundal data was assessed using an ANOVA. Individual post-SIV timepoints were compared to baseline (averaged pre-SIV timepoints) by Dunnet’s post-hoc analyses, and significance was evaluated using the adjusted p-value and an alpha level of 0.05.
Study Approval
Animals were housed and cared for in Association for the Assessment and Accreditation of Laboratory Animal Care international (AAALACi) accredited facilities, and all animal procedures were performed according to protocols approved by the Institutional Animal Care and Use Committee (IACUC) of University of Washington.
Supplementary Material
Acknowledgments
We would like to thank all veterinary staff of the Washington National Primate Research Center for animal studies. This work was supported by 1K22AI098440-01, IR01AI117828, 1DP13A037979 and start-up funds to NRK from University of Washington and Washington National Primate Research Center. Research reported in this publication was additionally supported in part by the primate center NIH core grant P51OD010425 and federal funds from the National Cancer Institute, National Institutes of Health, under Contract No. HHSN261200800001E, the Canadian Institutes for Health Research (TMI-138658), and Public Health Agency of Canada. We thank Stuart McCorrister and Garrett Westmacott for technical assistance. The content of this publication is solely the responsibility of the authors and does not necessarily reflect the views or policies of the National Institutes of Health or the Department of Health and Human Services, nor does mention of trade names, commercial products, or organizations imply endorsement by the U.S. Government.
Footnotes
Author Contributions: THM performed and analyzed experiments and wrote paper. NRK conceived of study with help of AB, MC, and RKR. CM, JM, ASZ, PF, SH, and JG assisted with experiments. BFK provided virus and sequence analysis. JS and BA provided veterinary support for animals and study design.
Conflicts of Interest: The authors have declared no conflict of interest exists.
Works Cited
- 1.Rodger AJ, Fox Z, Lundgren JD, Kuller LH, Boesecke C, Gey D, et al. Activation and coagulation biomarkers are independent predictors of the development of opportunistic disease in patients with HIV infection. The Journal of infectious diseases. 2009;200(6):973–983. doi: 10.1086/605447. [DOI] [PMC free article] [PubMed] [Google Scholar]
- 2.Kuller LH, Tracy R, Belloso W, De Wit S, Drummond F, Lane HC, et al. Inflammatory and coagulation biomarkers and mortality in patients with HIV infection. PLoS Med. 2008;5(10):e203. doi: 10.1371/journal.pmed.0050203. [DOI] [PMC free article] [PubMed] [Google Scholar]
- 3.Hunt PW, Cao HL, Muzoora C, Ssewanyana I, Bennett J, Emenyonu N, et al. Impact of CD8+ T-cell activation on CD4+ T-cell recovery and mortality in HIV-infected Ugandans initiating antiretroviral therapy. Aids. 2011;25(17):2123–2131. doi: 10.1097/QAD.0b013e32834c4ac1. [DOI] [PMC free article] [PubMed] [Google Scholar]
- 4.Klatt NR, Funderburg NT, Brenchley JM. Microbial translocation, immune activation, and HIV disease. Trends in microbiology. 2013;21(1):6–13. doi: 10.1016/j.tim.2012.09.001. [DOI] [PMC free article] [PubMed] [Google Scholar]
- 5.Brenchley JM, Douek DC. HIV infection and the gastrointestinal immune system. Mucosal immunology. 2008;1(1):23–30. doi: 10.1038/mi.2007.1. [DOI] [PMC free article] [PubMed] [Google Scholar]
- 6.Deeks SG, Lewin SR, Havlir DV. The end of AIDS: HIV infection as a chronic disease. Lancet. 2013;382(9903):1525–1533. doi: 10.1016/S0140-6736(13)61809-7. [DOI] [PMC free article] [PubMed] [Google Scholar]
- 7.Batman PA, Miller AR, Forster SM, Harris JR, Pinching AJ, Griffin GE. Jejunal enteropathy associated with human immunodeficiency virus infection: quantitative histology. Journal of clinical pathology. 1989;42(3):275–281. doi: 10.1136/jcp.42.3.275. [DOI] [PMC free article] [PubMed] [Google Scholar]
- 8.Veazey RS, DeMaria M, Chalifoux LV, Shvetz DE, Pauley DR, Knight HL, et al. Gastrointestinal tract as a major site of CD4+ T cell depletion and viral replication in SIV infection. Science. 1998;280(5362):427–431. doi: 10.1126/science.280.5362.427. [DOI] [PubMed] [Google Scholar]
- 9.Nazli A, Chan O, Dobson-Belaire WN, Ouellet M, Tremblay MJ, Gray-Owen SD, et al. Exposure to HIV-1 directly impairs mucosal epithelial barrier integrity allowing microbial translocation. PLoS pathogens. 2010;6(4):e1000852. doi: 10.1371/journal.ppat.1000852. [DOI] [PMC free article] [PubMed] [Google Scholar]
- 10.Klatt NR, Estes JD, Sun X, Ortiz AM, Barber JS, Harris LD, et al. Loss of mucosal CD103+ DCs and IL-17+ and IL-22+ lymphocytes is associated with mucosal damage in SIV infection. Mucosal immunology. 2012;5(6):646–657. doi: 10.1038/mi.2012.38. [DOI] [PMC free article] [PubMed] [Google Scholar]
- 11.Hirao LA, Grishina I, Bourry O, Hu WK, Somrit M, Sankaran-Walters S, et al. Early mucosal sensing of SIV infection by paneth cells induces IL-1beta production and initiates gut epithelial disruption. PLoS pathogens. 2014;10(8):e1004311. doi: 10.1371/journal.ppat.1004311. [DOI] [PMC free article] [PubMed] [Google Scholar]
- 12.Sandler NG, Bosinger SE, Estes JD, Zhu RT, Tharp GK, Boritz E, et al. Type I interferon responses in rhesus macaques prevent SIV infection and slow disease progression. Nature. 2014;511(7511):601–605. doi: 10.1038/nature13554. [DOI] [PMC free article] [PubMed] [Google Scholar]
- 13.Favre D, Lederer S, Kanwar B, Ma ZM, Proll S, Kasakow Z, et al. Critical loss of the balance between Th17 and T regulatory cell populations in pathogenic SIV infection. PLoS pathogens. 2009;5(2):e1000295. doi: 10.1371/journal.ppat.1000295. [DOI] [PMC free article] [PubMed] [Google Scholar]
- 14.Cecchinato V, Trindade CJ, Laurence A, Heraud JM, Brenchley JM, Ferrari MG, et al. Altered balance between Th17 and Th1 cells at mucosal sites predicts AIDS progression in simian immunodeficiency virus-infected macaques. Mucosal immunology. 2008;1(4):279–288. doi: 10.1038/mi.2008.14. [DOI] [PMC free article] [PubMed] [Google Scholar]
- 15.Klatt NR, Brenchley JM. Th17 cell dynamics in HIV infection. Current opinion in HIV and AIDS. 2010;5(2):135–140. doi: 10.1097/COH.0b013e3283364846. [DOI] [PMC free article] [PubMed] [Google Scholar]
- 16.Somsouk M, Estes JD, Deleage C, Dunham RM, Albright R, Inadomi JM, et al. Gut epithelial barrier and systemic inflammation during chronic HIV infection. Aids. 2015;29(1):43–51. doi: 10.1097/QAD.0000000000000511. [DOI] [PMC free article] [PubMed] [Google Scholar]
- 17.Hunt PW, Sinclair E, Rodriguez B, Shive C, Clagett B, Funderburg N, et al. Gut epithelial barrier dysfunction and innate immune activation predict mortality in treated HIV infection. The Journal of infectious diseases. 2014;210(8):1228–1238. doi: 10.1093/infdis/jiu238. [DOI] [PMC free article] [PubMed] [Google Scholar]
- 18.Canary LA, Vinton CL, Morcock DR, Pierce JB, Estes JD, Brenchley JM, et al. Rate of AIDS progression is associated with gastrointestinal dysfunction in simian immunodeficiency virus-infected pigtail macaques. Journal of immunology. 2013;190(6):2959–2965. doi: 10.4049/jimmunol.1202319. [DOI] [PMC free article] [PubMed] [Google Scholar]
- 19.Sousa AE, Carneiro J, Meier-Schellersheim M, Grossman Z, Victorino RM. CD4 T cell depletion is linked directly to immune activation in the pathogenesis of HIV-1 and HIV-2 but only indirectly to the viral load. Journal of immunology. 2002;169(6):3400–3406. doi: 10.4049/jimmunol.169.6.3400. [DOI] [PubMed] [Google Scholar]
- 20.Brenchley JM, Price DA, Schacker TW, Asher TE, Silvestri G, Rao S, et al. Microbial translocation is a cause of systemic immune activation in chronic HIV infection. Nature medicine. 2006;12(12):1365–1371. doi: 10.1038/nm1511. [DOI] [PubMed] [Google Scholar]
- 21.Rogers KA, Scinicariello F, Attanasio R. IgG Fc receptor III homologues in nonhuman primate species: genetic characterization and ligand interactions. Journal of immunology. 2006;177(6):3848–3856. doi: 10.4049/jimmunol.177.6.3848. [DOI] [PubMed] [Google Scholar]
- 22.Rogers KA, Scinicariello F, Attanasio R. Identification and characterization of macaque CD89 (immunoglobulin A Fc receptor) Immunology. 2004;113(2):178–186. doi: 10.1111/j.1365-2567.2004.01949.x. [DOI] [PMC free article] [PubMed] [Google Scholar]
- 23.Elbim C, Monceaux V, Francois S, Hurtrel B, Gougerot-Pocidalo MA, Estaquier J. Increased neutrophil apoptosis in chronically SIV-infected macaques. Retrovirology. 2009;6:29. doi: 10.1186/1742-4690-6-29. [DOI] [PMC free article] [PubMed] [Google Scholar]
- 24.Mattapallil JJ, Douek DC, Hill B, Nishimura Y, Martin M, Roederer M. Massive infection and loss of memory CD4+ T cells in multiple tissues during acute SIV infection. Nature. 2005;434(7037):1093–1097. doi: 10.1038/nature03501. [DOI] [PubMed] [Google Scholar]
- 25.Miyake A, Ibuki K, Enose Y, Suzuki H, Horiuchi R, Motohara M, et al. Rapid dissemination of a pathogenic simian/human immunodeficiency virus to systemic organs and active replication in lymphoid tissues following intrarectal infection. The Journal of general virology. 2006;87(Pt 5):1311–1320. doi: 10.1099/vir.0.81307-0. [DOI] [PubMed] [Google Scholar]
- 26.Estes JD, Harris LD, Klatt NR, Tabb B, Pittaluga S, Paiardini M, et al. Damaged intestinal epithelial integrity linked to microbial translocation in pathogenic simian immunodeficiency virus infections. PLoS pathogens. 2010;6(8):e1001052. doi: 10.1371/journal.ppat.1001052. [DOI] [PMC free article] [PubMed] [Google Scholar]
- 27.Ericsen AJ, Lauck M, Mohns MS, DiNapoli SR, Mutschler JP, Greene JM, et al. Microbial Translocation and Inflammation Occur in Hyperacute Immunodeficiency Virus Infection and Compromise Host Control of Virus Replication. PLoS pathogens. 2016;12(12):e1006048. doi: 10.1371/journal.ppat.1006048. [DOI] [PMC free article] [PubMed] [Google Scholar]
- 28.Klatt NR, Harris LD, Vinton CL, Sung H, Briant JA, Tabb B, et al. Compromised gastrointestinal integrity in pigtail macaques is associated with increased microbial translocation, immune activation, and IL-17 production in the absence of SIV infection. Mucosal immunology. 2010;3(4):387–398. doi: 10.1038/mi.2010.14. [DOI] [PMC free article] [PubMed] [Google Scholar]
- 29.Miller CJ, Li Q, Abel K, Kim EY, Ma ZM, Wietgrefe S, et al. Propagation and dissemination of infection after vaginal transmission of simian immunodeficiency virus. Journal of virology. 2005;79(14):9217–9227. doi: 10.1128/JVI.79.14.9217-9227.2005. [DOI] [PMC free article] [PubMed] [Google Scholar]
- 30.Del Prete GQ, Park H, Fennessey CM, Reid C, Lipkey L, Newman L, et al. Molecularly tagged simian immunodeficiency virus SIVmac239 synthetic swarm for tracking independent infection events. Journal of virology. 2014;88(14):8077–8090. doi: 10.1128/JVI.01026-14. [DOI] [PMC free article] [PubMed] [Google Scholar]
- 31.Hensley-McBain T, Zevin AS, Manuzak J, Smith E, Gile J, Miller C, et al. The effects of fecal microbial transplantation on microbiome and immunity in SIV-infected macaques. Journal of virology. 2016 doi: 10.1128/JVI.00099-16. [DOI] [PMC free article] [PubMed] [Google Scholar]
- 32.Li Y, Cleveland B, Klots I, Travis B, Richardson BA, Anderson D, et al. Removal of a single N-linked glycan in human immunodeficiency virus type 1 gp120 results in an enhanced ability to induce neutralizing antibody responses. Journal of virology. 2008;82(2):638–651. doi: 10.1128/JVI.01691-07. [DOI] [PMC free article] [PubMed] [Google Scholar]
- 33.Burgener A, Tjernlund A, Kaldensjo T, Abou M, McCorrister S, Westmacott GR, et al. A systems biology examination of the human female genital tract shows compartmentalization of immune factor expression. J Virol. 2013;87(9):5141–5150. doi: 10.1128/JVI.03347-12. [DOI] [PMC free article] [PubMed] [Google Scholar]
- 34.Birse KM, Burgener A, Westmacott GR, McCorrister S, Novak RM, Ball TB. Unbiased proteomics analysis demonstrates significant variability in mucosal immune factor expression depending on the site and method of collection. PLoS One. 2013;8(11):e79505. doi: 10.1371/journal.pone.0079505. [DOI] [PMC free article] [PubMed] [Google Scholar]
- 35.Birse K, Arnold KB, Novak RM, McCorrister S, Shaw S, Westmacott GR, et al. Molecular Signatures of Immune Activation and Epithelial Barrier Remodeling Are Enhanced during the Luteal Phase of the Menstrual Cycle: Implications for HIV Susceptibility. J Virol. 2015;89(17):8793–8805. doi: 10.1128/JVI.00756-15. [DOI] [PMC free article] [PubMed] [Google Scholar]
- 36.Romas L, Birse K, Mayer KH, Abou M, Westmacott G, Giguere R, et al. Rectal 1% Tenofovir Gel Use Associates with Altered Epidermal Protein Expression. AIDS Res Hum Retroviruses. 2016;32(10–11):1005–1015. doi: 10.1089/aid.2015.0381. [DOI] [PMC free article] [PubMed] [Google Scholar]
- 37.Sereti I, Estes JD, Thompson WL, Morcock DR, Fischl MA, Croughs T, et al. Decreases in colonic and systemic inflammation in chronic HIV infection after IL-7 administration. PLoS pathogens. 2014;10(1):e1003890. doi: 10.1371/journal.ppat.1003890. [DOI] [PMC free article] [PubMed] [Google Scholar]
- 38.Huang DW, Sherman BT, Tan Q, Collins JR, Alvord WG, Roayaei J, et al. The DAVID Gene Functional Classification Tool: a novel biological module-centric algorithm to functionally analyze large gene lists. Genome Biol. 2007;8(9):R183. doi: 10.1186/gb-2007-8-9-r183. [DOI] [PMC free article] [PubMed] [Google Scholar]
- 39.Huang DW, Sherman BT, Tan Q, Kir J, Liu D, Bryant D, et al. DAVID Bioinformatics Resources: expanded annotation database and novel algorithms to better extract biology from large gene lists. Nucleic Acids Res. 2007;35:W169–175. doi: 10.1093/nar/gkm415. Web Server issue. [DOI] [PMC free article] [PubMed] [Google Scholar]
Associated Data
This section collects any data citations, data availability statements, or supplementary materials included in this article.