Abstract
Rationale and Objectives
To evaluate a natural language processing (NLP) system built with open-source tools for identification of lumbar spine imaging findings related to low back pain on magnetic resonance (MR) and x-ray radiology reports from four health systems.
Materials and Methods
We used a limited data set (de-identified except for dates) sampled from lumbar spine imaging reports of a prospectively-assembled cohort of adults. From N=178,333 reports, we randomly selected N=871 to form a reference-standard dataset, consisting of N=413 x-ray and N=458 MR reports. Using standardized criteria, 4 spine experts annotated the presence of 26 findings, where 71 reports were annotated by all 4 experts and 800 were each annotated by 2 experts. We calculated inter-rater agreement and finding prevalence from annotated data. We randomly split the annotated data into development (80%) and testing (20%) sets. We developed an NLP system from both rule-based and machine-learned models. We validated the system using accuracy metrics such as sensitivity, specificity, and Area Under the ROC Curve (AUC).
Results
The multi-rater annotated dataset achieved inter-rater agreement of Cohen’s kappa > 0.60 (substantial agreement) for 25/26 findings, with finding prevalence ranging from 3%-89%. In the testing sample, rule-based and machine-learned predictions both had comparable average specificity (0.97 and 0.95, respectively). The machine-learned approach had a higher average sensitivity (0.94, compared to 0.83 for rules-based), and a higher overall AUC (0.98, compared to 0.90 for rules-based).
Conclusion
Our NLP system performed well in identifying the 26 lumbar spine findings, as benchmarked by reference-standard annotation by medical experts. Machine-learned models provided substantial gains in model sensitivity with slight loss of specificity, and overall higher AUC.
Keywords: Natural Language Processing, Lumbar Spine Diagnostic Imaging, Low Back Pain
INTRODUCTION
Low back pain (LBP) has an estimated global lifetime prevalence of almost 40% (1). In the United States, LBP is the second most common symptom prompting physician visits (after respiratory infections), with an estimated annual cost of over $100 billion (2; 3). Despite numerous available interventions for this common and burdensome condition, LBP remains difficult to diagnose and treat effectively (4). One difficulty in addressing LBP is substantial heterogeneity in its etiology, progression, and response to treatment. For instance, a clinical presentation of LBP could be caused by reasons ranging from minor muscle strains to malignant tumor (5; 6).
The discovery of patient subgroups with similar prognoses and intervention recommendations is a research priority for advancing LBP care (7; 8). Spine imaging findings may help define such subgroups. In most cases, imaging findings alone are insufficient to diagnose the underlying reasons for LBP. Furthermore, even when present, imaging findings are often of uncertain clinical significance given their frequent presence in asymptomatic individuals (9). Yet, certain imaging findings, such as endplate changes, are more prevalent in LBP patients compared to non-clinical populations (10). To understand relationships between imaging findings and LBP, an important step is the accurate extraction of findings, such as stenosis and disc herniation, from large patient cohorts.
Radiologists identify lumbar spine imaging findings on images and create reports containing these findings. While information extraction from these reports can be done manually, this technique is impractical for large sample sizes. As an alternative to manual extraction, natural language processing (NLP) has been successfully used to harvest specific findings and conditions from unstructured radiology reports with high accuracy. For example, a model to identify pulmonary nodules from computed tomography reports attained a positive predictive value (PPV) of 0.87 (11). Another group achieved an average specificity of 0.99 applying complex automated queries to identify 24 conditions from chest x-ray reports, including neoplasms, pneumonia, and tuberculosis (12). Such methods have not been previously applied to lumbar spine degenerative findings commonly found in LBP patients. Automated identification of these findings is an important step in building clinical information systems that can support large-scale learning approaches to improve both clinical care and clinical research.
In this manuscript, we describe the development and evaluation of an NLP system for identification of 26 lumbar spine imaging findings related to LBP on magnetic resonance (MR) and x-ray radiology reports. Our set of 26 imaging findings includes 8 findings commonly found in subjects without LBP, as well as additional findings that are less common but are potentially clinically important (9).
MATERIALS AND METHODS
Reference-Standard Dataset
We used a limited data set (de-identified except for dates of service) and our study protocol was deemed minimal risk with waivers for both consent and Health Insurance Portability and Accountability Act (HIPAA) authorization by site Institutional Review Boards (IRBs). This was a retrospective study of lumbar spine imaging reports sampled from a prospectively-assembled cohort of adults studying the effect of report content on subsequent treatment decisions (13). The cohort consisted of patients enrolled between October 2013 and September 2016 from four integrated health systems (Kaiser Permanente of Washington, Kaiser Permanente of Northern California, Henry Ford Health System, Mayo Clinic Health System). We assembled a reference-standard dataset from the N=178,333 index reports available on April 2016, randomly sampled stratified by site and imaging modality to obtain an approximately balanced sample of N=413 x-ray and N=458 MR reports (Table 1). Sample sizes were based on recommendations for NLP classification tasks (14) and also additionally justified by post-hoc power calculations.
Table 1.
Reference-standard annotated dataset.
| N in dataset | Average document length (number of words) | Average age in years | Men (%) | |
|---|---|---|---|---|
| Kaiser Permanente of Washington | ||||
| x-ray | 102 | 1073±212 | 70.4±13.9 | 40.2 |
| MR | 115 | 2141±731 | 58.9±14.4 | 51.3 |
| Total | 217 | 1639±767 | 64.3±15.2 | 46.1 |
| Kaiser Permanente of Northern California | ||||
| x-ray | 104 | 1054±235 | 67.5±16.8 | 39.4 |
| MR | 114 | 1953±647 | 57.1±15.0 | 47.4 |
| Total | 218 | 1524±668 | 62.1±16.9 | 43.6 |
| Henry Ford Health System | ||||
| x-ray | 103 | 1129±323 | 67.2±16.0 | 28.2 |
| MR | 115 | 2130±986 | 59.2±16.0 | 49.6 |
| Total | 218 | 1657±901 | 63.0±16.4 | 39.4 |
| Mayo Clinic Health System | ||||
| x-ray | 103 | 1094±280 | 69.4±16.2 | 38.8 |
| MR | 115 | 1722±645 | 55.1±15.4 | 41.7 |
| Total | 218 | 1425±595 | 61.9±17.3 | 40.4 |
| All | ||||
| x-ray | 413 | 1088±266 | 68.6±15.8 | 36.7 |
| MR | 458 | 1987±782 | 57.6±15.2 | 47.5 |
| Total | 871 | 1561±746 | 62.8±16.4 | 42.4 |
Note: Values after ± are standard deviations. MR = magnetic resonance imaging.
Our team had two neuroradiologists, a physiatrist, and a physical therapist, all with clinical expertise in spine disorders (JGJ, HTH, PS, SDR). This group jointly identified 26 imaging findings that are potentially related to LBP, including 8 commonly found on radiology reports, and 6 considered clinically important (Table 2). We based the findings identified in this study on prior research, and these findings represent a wide range of radiological findings related to LBP (2; 15; 16). For each finding, the experts listed associated keywords, which are synonyms of the finding, and supplemented them with online searches of medical databases (17; 18). The keyword list was expanded iteratively, where additional keywords were identified through the annotation process.
Table 2.
List of 26 findings identified by NLP system.
| Type of finding | Imaging Finding | RadLexID |
|---|---|---|
|
| ||
| Deformities | Listhesis – Grade 1* | RID4780ˆ |
| Listhesis – Grade 2 or higher | RID4780ˆ | |
| Scoliosis | RID4756 | |
|
| ||
| Fracture | Fracture | RID4658,4699,49608 |
| Spondylosis | RID5121 | |
|
| ||
| Anterior column degeneration | Annular Fissure* | RID4716-7, RID4721-3 |
| Disc Bulge* | RID5089 | |
| Disc Degeneration* | RID5086 | |
| Disc Desiccation* | RID5087 | |
| Disc Extrusion | RID5094-6 | |
| Disc Height Loss* | RID5088 | |
| Disc Herniation | RID5090 | |
| Disc Protrusion* | RID5091-3 | |
| Endplate Edema, or Type 1 Modic | RID5110 | |
| Osteophyte – anterior column | RID5079 | |
|
| ||
| Posterior column degeneration | Any Stenosis | RID5028-34 |
| Facet Degeneration* | NA | |
|
| ||
| Associated with leg pain | Central Stenosis | RID5029-32 |
| Foraminal Stenosis | RID5034 | |
| Nerve Root Contact | NA | |
| Nerve Root Displaced or Compressed | NA | |
| Lateral Recess Stenosis | NA | |
|
| ||
| Non-specific findings/other | Any Degeneration | RID5085 |
| Hemangioma | RID3969 | |
| Spondylolysis | RID5120 | |
| Any Osteophytes | RID5076,RID5078-9,RID5081 | |
Note:
after a finding indicates the 8 findings commonly found in subjects without LBP;
indicates the 6 findings that are less common but are potentially clinically important.
indicates the RadLexID for spondylolisthesis. Any Stenosis refers to stenosis at any location (Central, Foraminal, or Lateral Recess) or not otherwise specified. Any Degeneration refers to any of Disc Degeneration, Facet Degeneration, or Degeneration not otherwise specified. LBP = Low Back Pain.
Our clinicians annotated each report for the presence or absence of each finding using a secure online interface developed with Research Electronic Data Capture (REDCap) (Appendix Figure A.1) (19). Interpretations of findings were guided by how reports are likely understood by receiving physicians (20). To achieve consistency in interpretation, all 4 experts annotated 71 reports for the 26 findings. Then, the group reviewed annotations and discussed discrepancies until consensus was reached. We arrived at our initial 71 reports through an iterative training process, selecting reports based on report length, where sufficient consensus among readers was achieved after having reviewed 71 reports. The remaining 800 reports were each annotated by 2 separate experts. We created all possible pairs from 4 experts for a total of 6 expert pairs; each rater pair annotated about 133 reports. Expert pairs discussed and corrected any discrepancies in their annotations. As needed, the senior neuroradiologist (JGJ) provided final adjudications. As a post-annotation check, all report ratings were updated to reflect changes in the keyword list. The reference-standard dataset contains annotations of all 26 findings based on relevant keywords. For the doubly-annotated 800 reports, we measured interrater agreement in the reference-standard dataset using Cohen’s kappa (21).
NLP System
We implemented our NLP system with feature extraction, model development, and model validation steps (Figure 1). Our NLP system included routines for pre-processing steps such as section segmentation, sentence segmentation, and text normalization. The section segmentation code separated each report into history, body, and impression sections, but we excluded the history sections from analyses as we were primarily concerned with findings. The sentence segmentation routine split text into individual sentences based on sentence boundaries. The text normalization routine mapped spelling errors and variations into the same word stem, and reduced variation in modeling. To make formatting more consistent across radiology reports received from four separate health systems, two authors with expertise in text processing (WKT, ENM) conducted programmatic checks and data cleaning. We developed separate rule-based and machine-learned models for each of the 26 findings.
Figure 1.
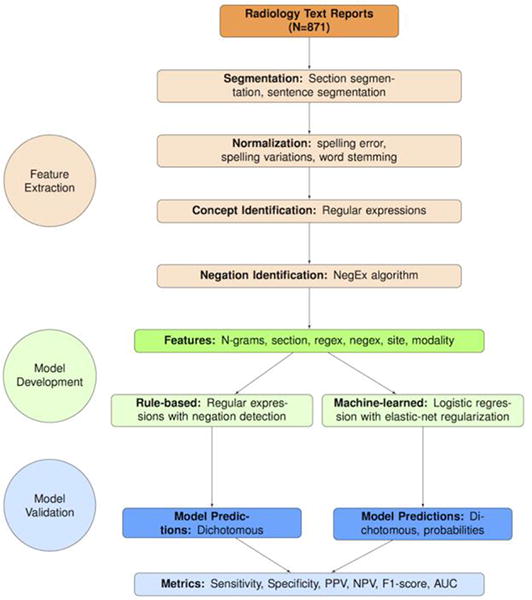
Flowchart illustrating steps involved in development of the NLP system on N=871 medical expert annotated x-ray and MR reports, sampled from four health system sites. Note: A “feature” is an NLP terminology that is equivalent to the terminology “predictor” in statistical modeling; “extraction” refers to the process of creating predictors from free text. MR = Magnetic Resonance; NLP = Natural Language Processing.
We implemented the rule-based model (Appendix Figure A.2) in Java (v4.6.0), using Apache Lucene (v6.1.0), Porter Stemmer and NegEx (22; 23; 24; 25). For every sentence of each report, we searched for keywords using regular expressions, which are sequences of characters and symbols (26), to identify relevant terms (called Regex). Then, we used a publicly-available algorithm (24) to infer whether keywords were negated (called NegEx). We included a rule favoring the impression section information over any conflicting information in the body section (27). We produced dichotomous predictions for each report, where a positive assignment was made if there was at least one sentence with a keyword that was not modified by a negation term.
We implemented the machine-learned model in R (v3.3.0) (28), using the caret (v6.0–73) package (29). Predictors used included sequences of N words (called N-grams), section tags, Regex and NegEx from the rule-based model, imaging modality, and health system site (Figure 2). Therefore, the machine-learned model used both input features based on the output of the rule-based model (Regex and NegEx), plus additional predictors. N-grams are considered baseline features in NLP applications; we additionally modeled whether the N-grams were in the body or impression section of reports. We included the categorical variables modality and site to account for any potential heterogeneity in language between x-ray and MR reports, as well as heterogeneity among different health systems. We excluded extremely rare (<0.05%) or common (>95%) N-grams and used logistic regression with elastic-net regularization as the modeling approach (30). Elastic-net is a variable selection procedure that penalizes both the absolute value and the squared magnitude of model coefficients, allowing simultaneous selection of correlated predictors. We randomly split the dataset into 80% development (training and validation) and 20% for testing to evaluate model diagnostic accuracy. We fine-tuned model hyperparameters on the development subsample, with 10-fold cross-validation using a Receiver Operating Characteristic (ROC) loss function. We produced predicted probabilities, and applied 10-fold cross-validated thresholds to obtain dichotomous predictions.
Figure 2.
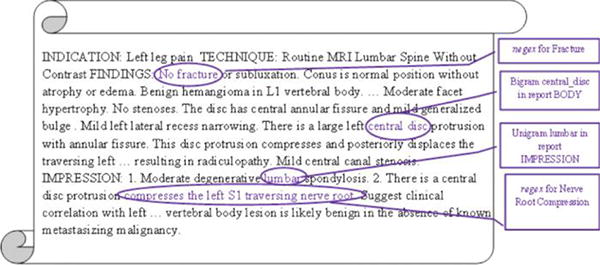
Examples of text-based predictors extracted from a radiology report snippet and used in machine-learned models. The phrase “No fracture” is used as a NegEx predictor (keyword negated) for the model to classify Fracture. The phrase “compresses the left S1 traversing nerve root” is used as a Regex predictor (keyword present) for the model to classify Nerve Root Displacement or Compression. The N-grams “central disc” and “lumbar” are used as predictors for all machine-learned models.
Statistical Analyses
We conducted statistical analyses in R (v3.3.0). We measured the prevalence of each finding, as well as inter-rater agreements using Cohen’s Kappa (31), on the annotated dataset. We compared NLP model predictions to reference-standard annotations in the test set. Evaluation measures were sensitivity, specificity, F1-score and Area Under the ROC Curve (AUC) (32). The F1-score is the harmonic mean (the reciprocal of the arithmetic mean of the reciprocals) of sensitivity and Positive Predictive Value (PPV), providing a single performance measure among reports with positive findings. For the rule-based models that outputted binary predictions, we used the trapezoidal rule approximation to the AUC (33). For the measures sensitivity, specificity, and AUC, we calculated point estimates for each finding as well as averaged over all findings, over the 8 common findings, and over the 6 clinically important findings. We estimated 95% confidence intervals using bootstrap percentiles on the test set based on 500 iterations. We sought to determine whether a rule-based or a machine-learned model was more accurate in classifying findings. Analyses focused on sensitivity and specificity. For each measure and for each finding, we compared the rule-based and machine-learned models using McNemar’s test of marginal homogeneity, not accounting for multiple comparisons (34).
Among the machine-learned models, we also characterized model performance by evaluating both data availability (amount of data available to learn from) and linguistic complexity (difficulty posed by the learning problem). Analyses focused on the F1-score. Because the same development set was used for all findings, we used finding prevalence as a proxy for data availability. Since disagreements among experts were likely due to difficulty in identifying a finding from text, we used inter-rater agreement as a proxy for linguistic complexity. Due to the small number of findings (Nfindings = 26), we did not provide inferential statistics; instead, we illustrated relationships with scatterplots and non-parametric Local Regression (LOESS) smoothed fits.
Our study was Health Insurance Portability and Accountability Act (HIPAA) compliant and approved by the Group Health Cooperative Institutional Review Board Protocol # 476829 for the LIRE pragmatic trial.
RESULTS
Appendices (Appendix A and Appendix B) are available online as supplementary material.
Reference-Standard Dataset Characteristics
In the entire annotated dataset (N=871), finding prevalence ranged from 3% (listhesis grade 2) to 89% (any degeneration). In the test set, finding prevalence ranged from 1% (listhesis grade 2) to 92% (any degeneration). Among the 800 reports, 25/26 findings achieved a minimum Cohen’s kappa > 0.60, which is generally considered “substantial” agreement (31); we observed variation in agreement across findings as well as across rater pairs (Figure 3). We observed lower agreement for disc herniation (kappa=0.49) and endplate edema (kappa=0.72). Simple errors and report ambiguity accounted for most disagreements (Table 3).
Figure 3.
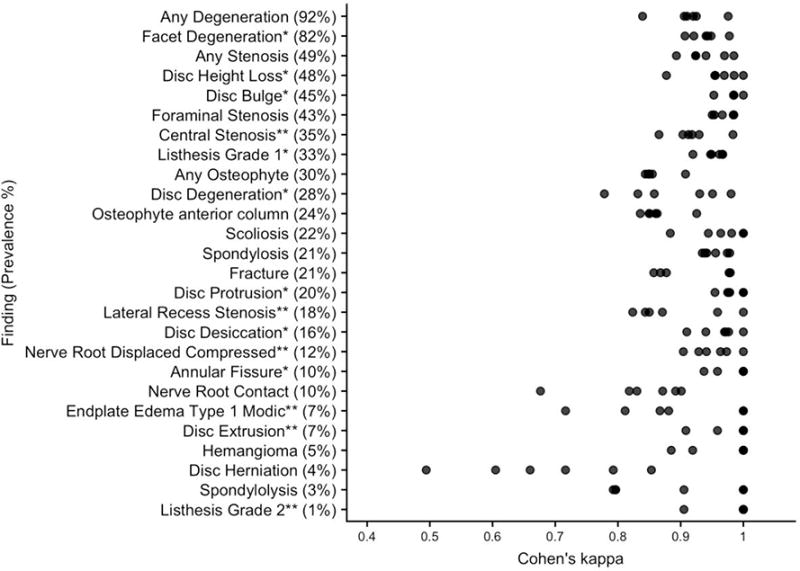
Distribution of agreement patterns in the annotated dataset. The findings are ordered by decreasing prevalence in the test set. Note: * after a finding indicates the 8 findings commonly found in subjects without LBP; ** indicates the 6 findings that are less common but are potentially clinically important. LBP = Low Back Pain.
Table 3.
Text excerpts from reference-standard dataset.
| Finding | Text excerpts |
|---|---|
| Disc Herniation | …degenerative change is evident at L2–L3 and… disc herniation is not excluded. |
| Essentially Unremarkable. L3–4: Minimal left posterior lateral focal herniation… | |
| right laminotomy. No definite disc herniation. Mild nonmasslike enhancing tissue… | |
| Endplate Edema/Type 1 Modic | …S1 superior endplate with surrounding edema suggesting element of acuity… |
| …high signal intensity on T2 and low signal intensity on T1 suggestive of acute to subacute superior endplate deformity. | |
| Minimal edema in the superior L5 endplate with more chronic appearance. | |
| Lateral Recess Stenosis | Narrowing of the spine canal and lateral recesses and the right neuroforamen… |
| …displaces the traversing left S1 nerve root in the left nerve root in the left lateral recess… | |
| …eccentric to the left with a left foraminal and far lateral component compressing the exiting left… | |
| Nerve Root Displaced or Compressed | Severe facet arthrosis with a diffusely bulging annulus causes moderate to severe central stenosis with redundant nerve roots above and below the interspace level. |
| There is granulation tissue surrounding the descending right S1 nerve root… | |
| …has minimal mass effect on the descending left S1 nerve root… |
Examples of report text from the reference-standard dataset show ambiguity in report text for the two findings with lower inter-rater agreement: Disc Herniation (kappa=0.49) and Endplate Edema (kappa=0.72), and reports that were “missed” by rule-based but “found” by machine-learned models for Lateral Recess Stenosis and Nerve Root Displaced or Compressed. Note: An ellipsis (…) indicates omitted raw text. Words in italics refer to ambiguous language.
NLP System Performances
For each of the 26 findings, Figure 4 illustrates patterns of model performance for sensitivity, specificity, and AUC; Figure 5 shows ROC curves for the 8 findings that are common among patients without LBP; Appendix Table B.1 summarizes the top 5 predictors from each machine-learned model.
Figure 4.
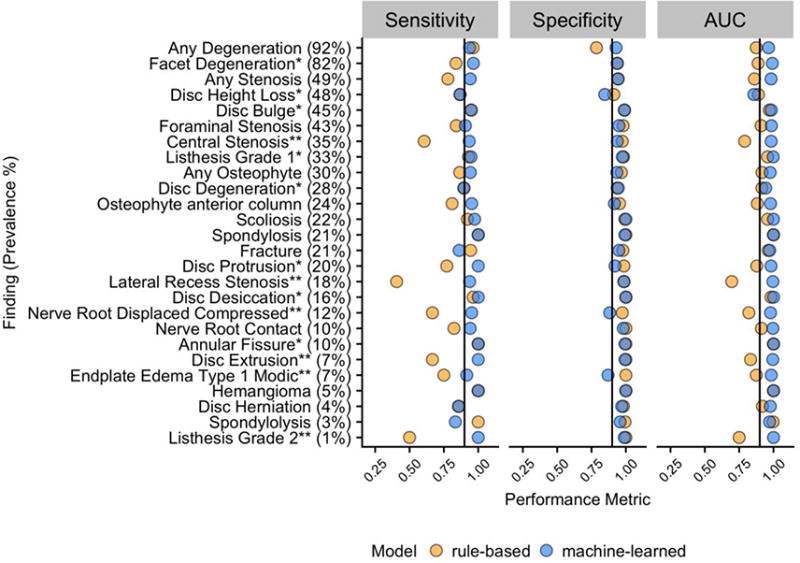
Point estimates of sensitivity, specificity and AUC of rule-based and machine-learned models for each finding as measured in a test set of N=174. The findings are ordered by decreasing prevalence in the test set; black lines on each panel correspond to 0.90. Note: * after a finding indicates the 8 findings commonly found in subjects without LBP; ** indicates the 6 findings that are less common but are potentially clinically important. AUC = Area Under the Receiver Operating Characteristic (ROC) curve; LBP = Low Back Pain.
Figure 5.
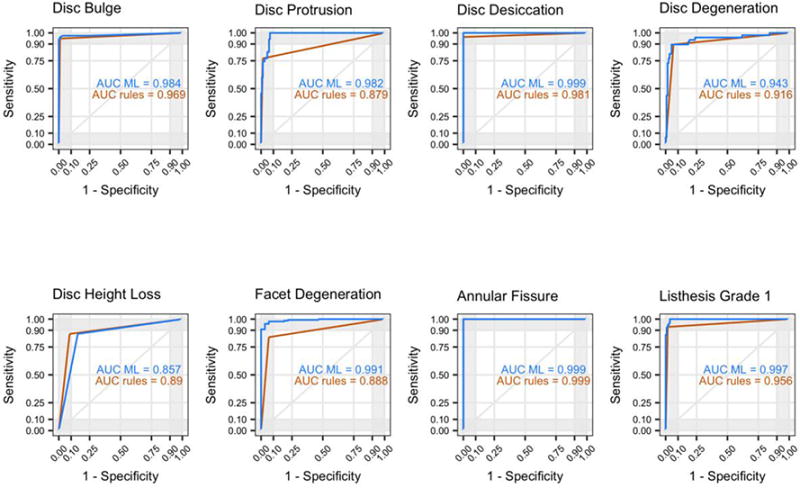
ROC curves and AUC in the test set for rule-based and machine-learned models of the 8 findings commonly found in subjects without LBP. AUC = Area Under the Receiver Operating Characteristic (ROC) curve; LBP = Low Back Pain; ML = machine-learned.
Over all 26 findings in our study, the average sensitivity = 0.83 (95% C.I. 0.38,1.00), specificity = 0.97 (95% C.I. 0.85,1.00), and AUC = 0.90 (95% C.I. 0.68,1.00) for the rules-based approach and average sensitivity = 0.94 (95% C.I. 0.76,1.00), specificity = 0.95 (95% C.I. 0.84,1.00), and AUC = 0.98 (95% C.I. 0.86,1.00) for the machine-learned approach. In detecting the 8 findings commonly found in subjects without LBP, for the rules-based approach, average sensitivity = 0.90 (95% C.I. 0.71,1.00), specificity = 0.97 (95% C.I. 0.88,1.00), and AUC = 0.93 (95% C.I. 0.84,1.00) while for the machine-learned approach, average sensitivity = 0.95 (95% C.I. 0.82,1.00), specificity = 0.95 (95% C.I. 0.81,1.00), and AUC = 0.97 (95% C.I. 0.84,1.00). In detecting the 6 findings that are likely clinically more important for LBP, the rules-based average sensitivity = 0.57 (95% C.I. 0.00,1.00), specificity = 0.99 (95% C.I. 0.95,1.00), and AUC = 0.78 (95% C.I. 0.50,1.00) and the machine-learned average sensitivity = 0.96 (95% C.I. 0.86, 1.00), specificity = 0.96 (95% C.I. 0.85,1.00)., and AUC = 0.99 (95% C.I. 0.96,1.00). None of the machine-learned model had site among the top 5 predictors, but two findings (any stenosis, foraminal stenosis) included modality in the list of top 5 predictors (Appendix Table B.1).
On average across all findings, the machine-learned approach provided improved sensitivity, comparable specificity, and an overall higher AUC. Among the rule-based models, the lowest sensitivities were observed for findings that consists of multiple concepts, for example lateral recess stenosis and nerve root compression or displacement. We provide more details on these points in the next subsection.
Comparison of rules-based and machine-learned models
Figure 6a shows the proportion of positive reports in the test set classified correctly by one model but not the other, compared to reference-standard true positives (sensitivity comparisons). Similarly, Figure 6b compares true negatives for each model (specificity comparisons); Appendix Table B.2 illustrates 2 × 2 tables for calculating the proportions; Appendix Table B.3 shows the resulting p-values based on McNemar’s tests.
Figure 6.
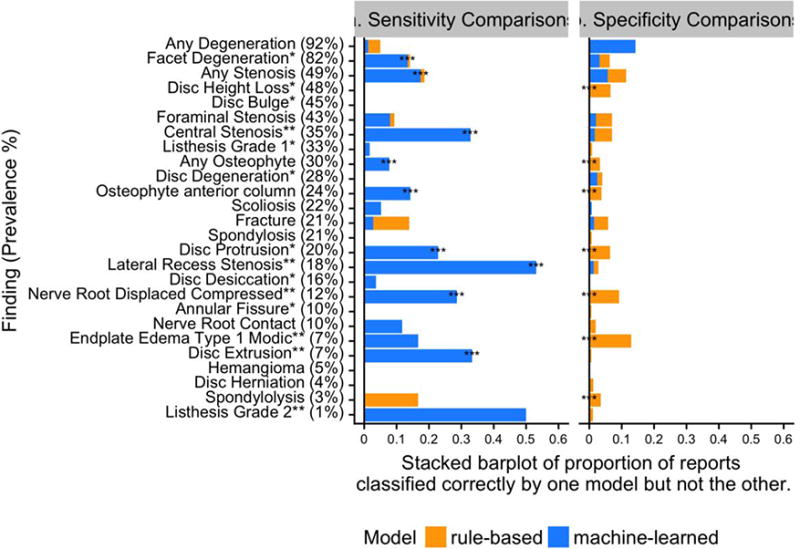
(a) Sensitivity comparisons: Proportion of reports classified correctly by one model but not the other, as compared to true positive annotations in the test set. (b) Specificity comparisons: Proportion of reports classified correctly by one model but not the other, as compared to true negative annotations in the test set. The test set has N=174 reports; denominators in calculating proportions are test set size multiplied by prevalence (for sensitivity comparisons), or one minus prevalence (for specificity comparisons). Note: * after a finding indicates the 8 findings commonly found in subjects without LBP; ** indicates the 6 findings that are less common but are potentially clinically important. *** at the left of the stacked bar plots indicates p<0.05 from McNemar’s test, not adjusting for multiple comparisons. LBP = Low Back Pain.
For example, in Figure 6a, for the finding any stenosis (third row), among all of the reports classified as true positive, the rule-based and machine-learned models classified 19% differently. Of these 19%, the machine-learned model was correct for nearly all (94%) which is why the bar is nearly completely blue. In Figure 6b, among all the true negative reports, the rule-based and machine-learned models classified 11% of the reports differently, where the machine-learned model was correct for half. Overall, machine-learned models demonstrated substantial and statistically significant better sensitivity for 9/26 findings, and slightly worse model specificity for 7/26 findings that were statistically significant. Therefore, machine-learned models provided substantially higher sensitivities and slightly lower specificities compared to rule-based approaches.
The most substantial difference between the models though, was gains in using machine-learned models to detect the presence of compound findings. For example, nerve root displacement or compression can be thought of as a compound of the concepts “nerve root” and “displacement” or “compression,” with varying language appearing between them in actual radiology reports. While a rule-based model achieved a sensitivity of only 0.67, a machine-learned model achieved sensitivity of 0.95 (p<0.05). Similarly, the finding lateral recess stenosis, compound of the “lateral recess” and spinal “stenosis”, was identified with a sensitivity of 0.41 by the rule-based model versus a sensitivity of 0.94 by the machine-learned model (p<0.05). Table 3 illustrates examples of reports missed by rule-based but identified by machine-learned models for these two findings. In these cases, the compound parts of the findings can be inferred from context.
Effect of data availability and linguistic complexity on machine-learned models
Figure 7a displays the relationship between machine-learned model performance as measured by F1-score and data availability as measured by finding prevalence; Figure 7b shows model performance by linguistic complexity as measured by average Cohen’s kappa.
Figure 7.
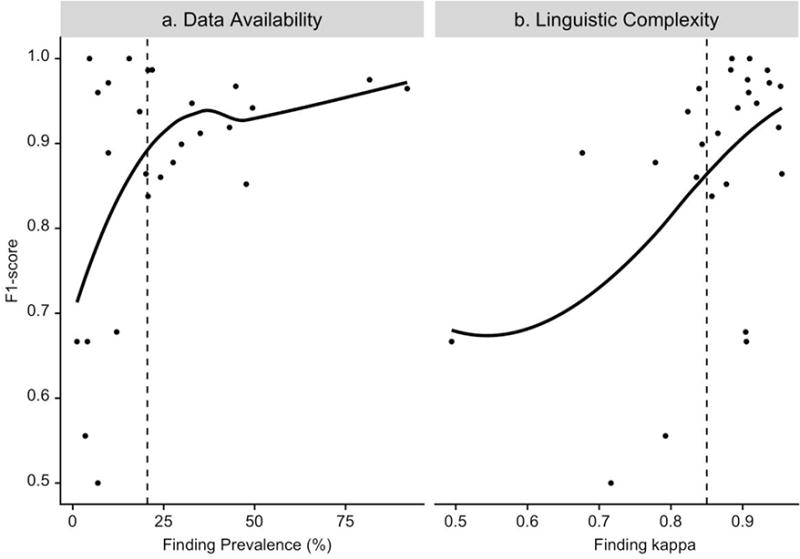
a. Performance of machine-learned models as measured by F1-score versus data availability as measured by finding prevalence; vertical dashed line is finding prevalence = 20%. b. Performance of machine-learned models as measured by F1-score versus linguistic complexity as measured by inter-rater kappa; vertical dashed line is kappa = 0.85. Note: Each dot represents a finding. The blue lines are non-parametric Local Regression fits to the data.
Model performance was typically higher when more data were available for learning. Among the 13 findings with prevalence less than 20%, F1-score of machine-learned models was observed to increase substantially with the increase in finding prevalence. Among the 13 findings with prevalence greater than 20%, F1-score increased slightly with the increase in finding prevalence.
Model performance tended to be higher when the finding was less linguistically complex. Among the 17 findings with kappa greater than 0.85, F1-score of machine-learned models was observed to increase substantially with the increase in kappa (decrease in linguistic complexity). Among the 9 findings with kappa less than 0.85, the effect of linguistic complexity on model performance was less definitive; however, the variability in F1-score was high.
DISCUSSION
Many imaging findings related to LBP are not explicitly coded in medical databases that are part of the electronic health record. NLP allows for automated identification of such findings from free-text radiology reports, reducing the burden of manual extraction (26). In this study, we sought to develop and validate an NLP system to identify 26 findings related to LBP from radiology reports. Our initial goal was to build a system for 8 radiological findings common among subjects without LBP, and we subsequently expanded this goal to encompass additional relevant findings. Our reference-standard annotations were guided by how radiology reports are likely interpreted by receiving physicians, and our NLP system was developed accordingly (20). To ensure internal consistency, we conducted pre-annotation training, double annotation of reports, and post-annotation checking of labels, resulting in a dataset with high inter-rater reliability for most findings.
In practice, NLP approaches can include rule-based and machine-learned (26; 32). Rule-based approaches have minimal set-up costs, but are burdensome to scale beyond limited findings or over time as language usage changes. Machine-learned approaches leverage the same feature sets to predict multiple findings, however require large sample sizes for development. The flexibility of machine-learned models may be more preferable to the rigidity of rules-based models, when considering scalability to large EMR databases. Furthermore, complicated machine-learned NLP models may not be necessary for report-level classification tasks: Zech et al. reported that simple features such as N-grams together with logistic regression was as accurate as more sophisticated features (35).
Our rule-based models achieved moderate sensitivity and very high specificity, comparable to the performances of rule-based models to identify findings for other conditions (36). Such performance has been often attributed to usage of open-source negation detection algorithms (24) to reduce false positives. Our machine-learned models provided substantial gains in model sensitivity with slight loss in specificity, and had overall higher discrimination. Such gains are due to machine-learned models augmenting the predictions of rule-based models with additional contextual text-based predictors (Appendix B).
One concern in using NLP for biomedical applications is the generalizability to new study sites, since reporting style and structure could vary by institution and radiologist training (26). Our dataset was assembled across four health systems, and site was included as a predictor in the machine-learned models. Interestingly, no models had site in the list of top 5 predictors, indicating that language used in expressing the imaging findings was relatively consistent across study sites. However, within-site linguistic variability is possible, since each site in our study encompassed multiple clinics, radiologists, and data systems. Due to small sample sizes for each site (Table 1), we caution against any conclusive evidence.
Another issue in using NLP in radiology is the potential linguistic heterogeneity across imaging modalities. Our study included both x-ray and MR reports, where MR reports were on average twice as long as x-ray reports (Table 1). Additionally, while findings involving soft tissues and internal structures cannot directly be seen on x-ray images, they may occasionally be inferred and dictated on x-ray reports, especially when providing recommendations for symptomatic patients (27). Therefore, we annotated for all 26 findings on reports from both modalities. Our machine-learned models were developed on reports from both modalities due to sample size constraints. We did, however, attempt to account for potential linguistic heterogeneity, by including modality as a predictor. Only two findings (any stenosis, foraminal stenosis) included modality in the list of top 5 predictors (Appendix Table B.1), suggesting that any linguistic heterogeneity across modalities were contained within report text, and that the additional information of modality did not improve prediction.
Our study included 26 findings of differing prevalence and linguistic complexity. We demonstrated that using the same development sample, performances of machine-learned models were poorer when a finding was less prevalent or linguistically more complex. These were instances when, due to the low number or quality of instances of a finding, there was insufficient information in the development data for machine-learned models to classify accurately (37). Our results suggest that even within the same NLP system, additional work required to fine-tune model performances could vary depending on characteristics of target findings.
A limitation of this study is that we required dichotomous annotations and predictions, even though radiology reports can contain ambiguous terms such as “suggesting” and “no definite” (Table 3) which may affect model performance (38). We attempted to reduce any potential bias by consistently coding such terms as indicating the presence of the finding. Another limitation is sample size. Even though our sample size was consistent with recommendations for classification tasks with moderate prevalence findings (14), the machine-learned models of rarer (prevalence <20%) findings had lower PPVs and were imprecise (Appendix Table A.2), comparable to the results seen in Yetisgen-Yildiz et al (37). Larger datasets could provide larger training samples, thus better accuracies for machine-learned models, as well as larger testing samples, therefore validation performance measures that are less variable. We plan to augment our dataset with additional annotations in future work, using alternative sampling designs that can facilitate resource-efficient annotations. Another limitation is that we only considered x-ray and MR reports in this study, and thus our results may not generalize to other imaging modalities.
We recognize that our regularized regression-based machine-learned models were relatively simple, and deep learning neural networks could achieve higher accuracy if given a sufficiently large development sample size. In addition, instead of using NLP to identify lumbar spine imaging findings, image processing of actual scans has been observed to be highly accurate on MR images (39). It would be interesting to compare image processing and NLP predictions to downstream clinical outcomes.
Ultimately, our experience demonstrated the feasibility of an NLP system built with open-source tools to identify lumbar spine imaging findings from radiology reports sampled across two modalities and four health systems. We plan to use our NLP system to identify the 8 findings that are common among subjects without LBP, which our system demonstrated high accuracy for in the testing sample, after further validation on additional reports sampled from the cohort.
CONCLUSIONS
We developed and validated an NLP system to identify 26 findings related to LBP from x-ray and MR radiology reports sampled from four health systems. Machine-learned models provided substantial increase in sensitivity with the slight loss of specificity compared to rule-based models. Model accuracies were affected by finding prevalence and finding complexity.
Supplementary Material
Acknowledgments
This work is supported by the National Institutes of Health (NIH) Common Fund, through a cooperative agreement (5UH3AR06679) from the Office of Strategic Coordination within the Office of the NIH Director. The views presented here are solely the responsibility of the authors and do not necessarily represent the official views of the National Institutes of Health. Dr Suri is a staff physician at the VA Puget Sound Health Care System in Seattle, Washington. Dr. Suri is supported by VA Career Development Award #1IK2RX001515 from the US Department of Veterans Affairs Rehabilitation Research and Development Service. The contents of this work do not represent the views of the US Department of Veterans Affairs or the US Government.
Our study was Health Insurance Portability and Accountability Act (HIPAA) compliant and approved by the Group Health Cooperative Institutional Review Board Protocol # 476829 for the LIRE pragmatic trial.
Footnotes
Publisher's Disclaimer: This is a PDF file of an unedited manuscript that has been accepted for publication. As a service to our customers we are providing this early version of the manuscript. The manuscript will undergo copyediting, typesetting, and review of the resulting proof before it is published in its final citable form. Please note that during the production process errors may be discovered which could affect the content, and all legal disclaimers that apply to the journal pertain.
Declarations of interest: None
References
- 1.A systematic review of the global prevalence of low back pain. Hoy Damian, et al. Arthritis & Rheumatology. 2012;64(6):2028–2037. doi: 10.1002/art.34347. s.l. [DOI] [PubMed] [Google Scholar]
- 2.Evaluating and Managing Acute Low Back Pain in the Primary Care Setting. Atlas Steven J, Deyo Richard A. Journal General Internal Medicine. 2001 Feb;16:120–131. doi: 10.1111/j.1525-1497.2001.91141.x. [DOI] [PMC free article] [PubMed] [Google Scholar]
- 3.Lumbar disc disorders and low-back pain: socioeconomic factors and consequences. Katz JN. The Journal of bone and joint surgery. 2006;88(Suppl 2):21–4. doi: 10.2106/JBJS.E.01273. [DOI] [PubMed] [Google Scholar]
- 4.Report of the NIH Task Force on research standards for chronic low back pain. Deyo RA, Dworkin SF, Amtmann D, Andersson G, Borenstein D, Carragee E, Carrino J, Chou R, Cook K, DeLitto A, Goertz C. Pain Medicine. 2014 Aug;15:1249–67. doi: 10.1007/s00586-014-3540-3. [DOI] [PubMed] [Google Scholar]
- 5.Prognosis for patients with chronic low back pain: inception cohort study. Luciola da C Menezes Costa, et al. BMJ. 2009;339:b3829. doi: 10.1136/bmj.b3829. [DOI] [PMC free article] [PubMed] [Google Scholar]
- 6.The natural course of lumbar spinal stenosis. Johnsson KE, Rosen I, Uden A. Clinical orthopaedics and related research. 1992;279:82–86. [PubMed] [Google Scholar]
- 7.Low back pain research priorities: a survey of primary care practitioners. Henschke N, Maher CG, Refshauge KM, Das A, McAuley JH. BMC family practice. 2007 Jan;8:40. doi: 10.1186/1471-2296-8-40. [DOI] [PMC free article] [PubMed] [Google Scholar]
- 8.Discussion paper: what happened to the ‘bio’in the bio-psycho-social model of low back pain? Hancock MJ, Maher CG, Laslett M, Hay E, Koes B. European Spine Journal. 2011 Dec;20:2105–2110. doi: 10.1007/s00586-011-1886-3. [DOI] [PMC free article] [PubMed] [Google Scholar]
- 9.Systematic literature review of imaging features of spinal degeneration in asymptomatic populations. Brinjikji W, Luetmer PH, Comstock B, Bresnahan BW, Chen LE, Deyo RA, Halabi S, et al. American Journal of Neuroradiology. 2015 Apr;36:811–816. doi: 10.3174/ajnr.A4173. [DOI] [PMC free article] [PubMed] [Google Scholar]
- 10.European Spine Journal. Jensen TS, Karppinen J, Sorensen JS, Niinimaki J, Leboeuf-Yde C. Vertebral endplate signal changes (Modic change): asystematic literature review of prevalence and association with non-specific low back pain. 2008;17:1407–1422. doi: 10.1007/s00586-008-0770-2. [DOI] [PMC free article] [PubMed] [Google Scholar]
- 11.Automated identification of patients with pulmonary nodules in an integrated health system using administrative health plan data, radiology reports, and natural language processing. Danforth Kim N, et al. Journal of Thoracic Oncology. 2012 Aug;7:1257–1262. doi: 10.1097/JTO.0b013e31825bd9f5. [DOI] [PMC free article] [PubMed] [Google Scholar]
- 12.Use of Natural Language Processing to translate clinical information from a database of 889,921 chest radiographic reports. Hripcsak George, et al. Radiology. 2002 Jan;224:157–163. doi: 10.1148/radiol.2241011118. [DOI] [PubMed] [Google Scholar]
- 13.Lumbar Imaging with Reporting of Epidemiology (LIRE)—protocol for a pragmatic cluster randomized trial. Jarvik Jeffery G, et al. Contemporary clinical trials. 2015;45:157–163. doi: 10.1016/j.cct.2015.10.003. [DOI] [PMC free article] [PubMed] [Google Scholar]
- 14.Application of recently developed computer algorithm for automatic classification of unstructured radiology reports: validation study. Dreyer KJ, Kalra MK, Maher MM, Hurier AM, Asfaw BA, Schultz T, et al. Radiology. 2005 Feb;234:323–9. doi: 10.1148/radiol.2341040049. [DOI] [PubMed] [Google Scholar]
- 15.The longitudinal assessment of imaging and disability of the back (LAIDBack) study: baseline data. Jarvik JJ, Hollingworth W, Heagerty P, Haynor DR, Deyo RA. Spine. 2001 Oct;26:1158–1166. doi: 10.1097/00007632-200105150-00014. [DOI] [PubMed] [Google Scholar]
- 16.Design of the spine patient outcomes research trial (SPORT) Birkmeyer Nancy JO, Weinstein James N, Tosteson Anna NA, Tosteson Tor D, Skinner Jonathan S, Lurie Jon D, Deyo Richard, Wennberg John E. Spine. 2002 Dec;27:1361. doi: 10.1097/00007632-200206150-00020. [DOI] [PMC free article] [PubMed] [Google Scholar]
- 17.Centers for Medicare & Medicaid Services. ICD-9-CM Diagnosis and Procedure Codes: Abbreviated and Full Code Titles. Cms.gov. [Online] https://www.cms.gov/medicare/coding/ICD9providerdiagnosticcodes/codes.html.
- 18.Radiology Society of North America. RadLex. RadLex. [Online] http://www.rsna.org/radlex.aspx.
- 19.Research electronic data capture (REDCap) – A metadata-driven methodology and workflow process for providing translational research informatics support. Harris Paul A, Taylor Robert, Thielke Robert, Payne Jonathon, Gonzalez Nathaniel, Cond Jose G. J Biomed Inform. 2009 Feb;42:377–81. doi: 10.1016/j.jbi.2008.08.010. [DOI] [PMC free article] [PubMed] [Google Scholar]
- 20.Toward best practices in radiology reporting. Kahn Charles E, Jr, Langlotz Curtis P, Burnside Elizabeth S, Carrino John A, Channin David S, Hovsepian David M, Rubin Daniel L. Radiology. 2009 Mar;252:852–856. doi: 10.1148/radiol.2523081992. [DOI] [PubMed] [Google Scholar]
- 21.Cohen Jacob A. Educational and psychological measuremen. 1. Vol. 20. Sage Publications Sage CA; Thousand Oaks, CA: 1960. Coefficient of agreement for nominal scales; pp. 37–46. s.l. [DOI] [Google Scholar]
- 22.Oracle Corporation. Java. Redwood Shores, CA: Oracle Corporation; 2016. [Google Scholar]
- 23.The Apache Software Foundation. Apache Lucene. Forest Hill, MD: The Apache Software Foundation; 2016. [Google Scholar]
- 24.A simple algorithm for identifying negated findings and diseases in discharge summaries. Chapman Wendy W, et al. Journal of biomedical informatics. 2001;34.5:301–310. doi: 10.1006/jbin.2001.1029. [DOI] [PubMed] [Google Scholar]
- 25.Porter MF. Porter Stemmer: The Porter Stemming algorithm Web site. 2006 Jan; [Online] https://tartarus.org/martin/PorterStemmer/def.txt.
- 26.Natural Language Processing Technologies in Radiology Research and Clinical Applications. Cai T, Giannopoulos AA, Yu S, et al. RadioGraphics. 2016 Jan;36:176–191. doi: 10.1148/rg.2016150080. [DOI] [PMC free article] [PubMed] [Google Scholar]
- 27.Radiologic reporting: structure. Friedman PJ. American Journal of Roentgenology. 1983 Jan;140:171–172. doi: 10.2214/ajr.140.1.171. [DOI] [PubMed] [Google Scholar]
- 28.R Core Team. R: A language and environment for statistical computing. Vienna, Austria: R Foundation for Statistical Computing; 2013. [Google Scholar]
- 29.Kuhn M. Caret package. Journal of Statistical Software. 2008;28:5. s.l. [Google Scholar]
- 30.Regularization and variable selection via the elastic net. Zou Hui, Hastie Trevor. Journal of the Royal Statistical Society: Series B (Statistical Methodology) 2005;67.2:301–320. https://doi.org/0.1111/j.1467-9868.2005.00503.x. [Google Scholar]
- 31.The measurement of observer agreement for categorical data. Landis JR, Koch GG. Biometrics. 1977:159–174. doi: 10.2307/2529310. [DOI] [PubMed]
- 32.Natural language processing in radiology: a systematic review. Ewoud Pons, Braun Loes MM, Hunink MG Myriam, Kors Jan A. Radiology. 2016 Feb;279:329–343. doi: 10.1148/radiol.16142770. [DOI] [PubMed] [Google Scholar]
- 33.The area above the ordinal dominance graph and the area below the receiver operating characteristic graph. Bamber Donald. Journal of mathematical psychology. 1975 Apr;12:387–415. doi: 10.1016/0022-2496(75)90001-2. [DOI] [Google Scholar]
- 34.Note on the sampling error of the difference between correlated proportions or percentages. McNemar Quinn. Psychometrika. 1947 Feb;12:153–157. doi: 10.1007/BF02295996. [DOI] [PubMed] [Google Scholar]
- 35.Zech J, Pain M, Titano J, Badgeley M, Schefflein J, Su A, Costa A, Bederson J, Lehar J, Oermann EK. Reports, Natural Language–based Machine Learning Models for the Annotation of Clinical Radiology. Radiology. 2018:171093. doi: 10.1148/radiol.2018171093. [DOI] [PubMed]
- 36.Extracting information on pneumonia in infants using natural language processing of radiology reports. Mendonça EA, Haas J, Shagina L, Larson E, Friedman C. Journal of biomedical informatics. 2005 Apr;38:314–321. doi: 10.1016/j.jbi.2005.02.003. [DOI] [PubMed] [Google Scholar]
- 37.A text processing pipeline to extract recommendations from radiology reports. Yetisgen-Yildiz M, Gunn ML, Xia F, Payne TH. Journal of biomedical informatics. 2013 Feb;46:354–362. doi: 10.1016/j.jbi.2012.12.005. [DOI] [PubMed] [Google Scholar]
- 38.Using natural language processing to improve efficiency of manual chart abstraction in research: the case of breast cancer recurrence. Carrell David S, Scott Halgrim, Diem-Thy Tran, Diana SM Buist, Jessica Chubak, Wendy W Chapman, Guergana Savova. American journal of epidemiology. 2014:kwt441. doi: 10.1093/aje/kwt441. [DOI] [PMC free article] [PubMed]
- 39.Automation of reading of radiological features from magnetic resonance images (MRIs) of the lumbar spine without human intervention is comparable with an expert radiologist. Jamaludin A, Lootus M, Kadir T, Zisserman A, Urban J, Battié MC, Fairbank J, McCall I, Genodisc Consortium European Spine Journal. 2017 May;26:1374–1383. doi: 10.1007/s00586-017-4956-3. [DOI] [PubMed] [Google Scholar]
Associated Data
This section collects any data citations, data availability statements, or supplementary materials included in this article.


