

ABSTRACT
White striping (WS) is a major problem affecting the broiler industry. Fillets affected by this myopathy present pathologies that compromise the quality of the meat, and most importantly, make the fillets more prone to rejection by the consumer. The exact etiology is still unknown, which is why a metabolomics analysis was performed on breast samples of broilers. The overall objective was to identify biological pathways involved in the pathogenesis of WS. The analysis was performed on a total of 51 muscle samples and distinction was made between normal (n = 19), moderately affected (n = 24) and severely affected (n = 8) breast fillets. Samples were analyzed using gas chromatographic mass spectral analysis and liquid chromatography quadrupole time-of-flight mass spectrometry. Data were subsequently standardized, normalized and analyzed using various multivariate statistical procedures. Metabolomics allowed for the identification of several pathways that were altered in white striped breast fillets. The tricarboxylic acid cycle exhibited opposing directionalities. This is described in literature as the backflux and enables the TCA cycle to produce high-energy phosphates through matrix-level phosphorylation and, therefore, produce energy under conditions of hypoxia. Mitochondrial fatty acid oxidation was limited due to disturbances in especially cis-5–14:1 carnitine (log2 FC of 2, P < 0.01). Because of this, accumulation of harmful fatty acids took place, especially long-chain ones, which damages cell structures. Conversion of arginine to citrulline increased presumably to produce nitric oxide, which enhances blood flow under conditions of hypoxia. Nitric oxide however also increases oxidative damage. Increases in taurine (log2 FC of 1.2, P < 0.05) suggests stabilization of the sarcolemma under hypoxic conditions. Lastly, organic osmolytes (sorbitol, taurine, and alanine) increased (P < 0.05) in severely affected birds; likely this disrupts cell volume maintenance. Based on the results of this study, hypoxia was the most likely cause/initiator of WS in broilers. We speculate that birds suffering from WS have a vascular support system in muscle that is borderline adequate to support growth, but triggers like activity results in local hypoxia that damages tissue.
Keywords: broiler, hypoxia, metabolomics, pectoralis major, white striping
INTRODUCTION
Poultry meat is highly regarded as one of the most efficient protein sources. The demand has gone up in recent decades due to the low costs, suitability for further processing and the absence of cultural or religious aversions (Petracci, et al., 2013a). This has led to an increase in consumption to 13.5 kilograms of poultry meat per capita in the world in 2015 (OECD/FAO, 2016).The increase of production to satisfy demand has been rendered possible, in part, through genetic selection for quantitative traits. Growth rate has increased tremendously over the past few decades, but this also increased physical stress levels for broilers (Petracci, et al., 2013b; Petracci, et al., 2015). This has led to a variety of challenges, one of which is called white striping (WS) (Soglia, et al., 2015). It is a condition associated with especially the heavier broiler fillets and is observed macroscopically as white striations running parallel to the direction of the muscle fibers (Ferreira, et al., 2014). WS is predominantly seen on breast fillets, but it also appear on tenders and some thigh muscles. A recent study showed an incidence of over 90% (Kuttappan, et al., 2017).
Histopathological changes take place in affected muscles. The muscle damage is characterized by degeneration of muscle fibers along with an increase in fat and connective tissue (Kuttappan, et al., 2013b; Kuttappan, et al., 2013c). This leads to lower levels of protein in the breast muscles while the amount of fat is higher in comparison to “normal” breast fillets (Petracci, et al., 2014). The quality of the meat is perceived to be lower by industry due to problems with water retention and marinade uptake (Petracci and Cavani, 2011). In severe cases this leads to the meat being downgraded and used for the manufacturing of finely minced products, with the economic losses that come with it (Soglia, et al., 2016). Literature showed that consumer acceptance is also influenced by the occurrence of white striations on the breast muscles. Affected breast muscles are being perceived to be higher in fat (Kuttappan, et al., 2012b).
The exact etiology of WS is to date still not sufficiently well described. Studies have shown that there are markers for hypoxia, oxidative stress, fiber-type switching and nutritional deficiencies, but no conclusive evidence was found concerning the initiator (Bauermeister, et al., 2009; Kuttappan, et al., 2012a; Kuttappan, et al., 2013a; Russo, et al., 2015). The production of fast-growing broilers has contributed to the occurrence of WS. Production birds have never grown faster than they do today (Havenstein, et al., 2003a; Havenstein, et al., 2003b; Aviagen, 2012; Zuidhof, et al., 2014). Therefore, factors known to have an effect on broiler growth also have an influence on the occurrence of the disorder such as gender (males > female), genotype (high > standard breast-yield), growth rate (high > low), diet (high > low energy) and slaughtering weight (heavier > lighter) (Petracci, et al., 2015). Given the increase in incidence and growing concern from the consumers, there is a pressing need to find a solution for the problem.
Metabolomics can be used as a starting point in the search of the solution. Metabolomics results in a molecular fingerprint that is the downstream result of gene transcription and post-translational protein modification in a cell, tissue, or whole organism in a particular physiological state (Hoybye, et al., 2014). This is viewed as the ultimate response of the biological system to genetic and environmental change (Fiehn, 2002). There are two methods of performing a metabolomics analysis: targeted analysis and non-targeted analysis. Non-targeted analysis provides a global snapshot of all metabolites in a biological system and is an ideal method for identifying metabolic perturbations that may be at the basis of, or associated with, white striping. To further strengthen the work performed a mineral analysis on the breast muscles was also performed to further back any of the findings of the metabolomics work performed. Hence, the overall objective of this study was to use non-targeted metabolomics and mineral analysis for identifying biological pathways that are involved in the underlying etiology of white striping in broiler chickens.
MATERIALS AND METHODS
Sample Selection and Preparation
Broilers used in this study were all ROSS 308 males, raised on a research farm (Poultry Research Centre; Casarrubios del Monte, Toledo, Spain) to 35 days. Birds underwent a 3-phase feeding program (0–7, 7–25, 25–35 days) being raised under standard commercial conditions using wood shavings as litter. At day 35, birds were euthanized in compliance with welfare rules. Average body weight of the birds was 2300 grams. Muscle samples of the pectoralis major muscle were collected for 51 birds, which were randomly selected (two birds per pen). These muscle samples were scored for WS. Time between euthanization and sample collection was as short as possible to ensure proper sample quality. The average time interval between cervical dislocation and sample freezing was 2–2.5 min. WS was scored as normal, moderate or severe based on criteria described by Kuttappan et al., (2012). A lack of white striations was scored as normal, the presence of small thin lines covering at least 1/3rd of the fillet surface were considered as moderate and thick white striations (>1 mm) covering at least 2/3rd of the surface area were scored as severe. The samples were frozen immediately upon collection using liquid nitrogen and stored at −80°C until further processing. All animal care procedures were carried out as described in the protocol approved by Centro de Estudios Biosanitarios (Madrid, Spain) by the External Ethical Committee, and approved by the Junta de Castilla-La Mancha Animal Welfare department as compliable with the Real Decreto RD 53/2013.
Animal Care and Use Committee (98R064–0).
Sample Analysis
Metabolomic analysis of the samples was performed by Metabolomic Discoveries (Potsdam-Golm, Germany). For metabolite extraction, muscle tissue was homogenized using a ball mill. An aliquot of 100 mg was taken and stored at −80°C for further gas chromatography- and liquid chromatography-mass spectrometry analysis. Metabolites were extracted in 500 μl 80% methanol (−20°C) including internal standards. Derivatisation and analyses of metabolites by a gas chromatographic mass spectral analysis 7890A mass spectrometer (Agilent, Santa Clara, USA) were carried out (Lisec, et al., 2006). The liquid chromatography separation was performed using hydrophilic interaction chromatography with a ZIC-HILIC 3.5 μm, 200 Å column (Merck Sequant, Umeå Sweden), operated by an Agilent 1290 UPLC system (Agilent, Santa Clara, USA). The LC mobile phase was a linear gradient from 90% to 70% acetonitrile over 15 min, followed by linear gradient from 70% to 10% acetonitrile over 1 min, 3 min wash with 10% and 3 min re-equilibration with 90% acetonitrile. The flow rate was 400 μl/min, injection volume 1 μl. The mass spectrometry was performed using a 6540 QTOF/MS Detector (Agilent, Santa Clara, USA). The measured metabolite concentration was normalized to the internal standard. Metabolites were identified based on Metabolomic Discoveries' database entries of authentic standards. Muscle samples were also analyzed for P, Na, K, Ca, Mg, Cu, Fe, Zn, Co, Ni, Se. Samples were weighed, destructed using 16N HNO3 over and then analyzed by inductively coupled plasma mass spectrometry analysis using a Perkin Elmer ICP Mass Spectrometer NexION 350D (Perkin-Elmer, Waltham, USA) according to method NEN-EN 15,510 (Bikker, et al., 2017).
Statistical Analysis
Data were transformed using log transformation to remove heteroscedasticity (Bais, 2011). Auto-scaling was applied, which is a combination of mean centering and variance scaling and it sets all variables to unit variance. After auto-scaling, all metabolites have a standard deviation of one. This leads to the data being analyzed based on correlation instead of covariance's, and it reduces bias which otherwise would occur as the order of magnitude can vary between metabolites. Auto-scaling was performed following van den Berg et al., (2006) using MetaboAnalyst (Xia Lab, McGill, Canada) (van den Berg, et al., 2006; Xia, et al., 2009; Xia and Wishart, 2011; Xia, et al., 2012; Xia, et al., 2015). Principal component analysis was used to visualize the metabolites in the data. Identification of differentially expressed metabolites between all the groups was performed using an ANOVA test and t-tests were used to compare normal versus moderate and normal versus severe (MetaboAnalyst, Xia Lab, McGill, Canada). The p-value was adjusted using the false discovery rate (FDR) correction and were deemed significant if P < 0.05 (Vinaixa, et al., 2012). For this study MetaboAnalyst (Xia Lab, McGill, Canada), Pathvisio (Univ. Maastricht, Maastricht. NL), Metscape (Univ. Michigan, Ann Arbor, MI, US) and Ipath (EMBL, Heidelberg, Germany) were used for mapping and visualization of the data (Gao, et al., 2010; Yamada, et al., 2011; Karnovsky, et al., 2012; Kutmon, et al., 2015). Metabolomic Pathway Analysis of MetaboAnalyst was used for its pathway enrichment which shows subtle but consistent changes among a group of related compounds, that would go undetected using a conventional approach (Kankainen, et al., 2011). The significance level for the pathways was set at p-value of 0.05 (after FDR correction).
RESULTS
Bias was removed by the preprocessing steps, limiting the difference in absolute magnitude and difference in variance, thereby improving the quality of the dataset. The total number of metabolites used in the analysis was 599. In total, the ANOVA resulted in significant differences for 63 metabolites (Appendix Table A1). Several metabolites quantified were plant metabolites with poorly defined metabolic function. These will not be discussed in this article further.
It is worth mentioning the high levels of small peptides, the high levels of long-chain fatty acids (LCFA) as well as the decrease in carnitine esters in birds affected by white striping compared to unaffected birds. Especially long-chain fatty acids and carnitine esters, which are involved in fat metabolism, were of interest (Figure 1+2).
Figure 1.

The largest significant fold changes in fats present between severe white striping and no white striping. Longer fatty acids are increased substantially in the severely affected birds.
Figure 2.

Significant fold changes in carnitine esters between normal and severe WS. Carnitine esters involved in the transport of long-chain fatty acids into the mitochondria are all lowered, while C14:1 carnitine is increased (serves as a marker for beta-oxidation defects).
The nine most differentially expressed metabolites for each comparison are summarized in Table 1 with their respective log2 fold change (relative to normal fillets). A positive fold change indicates that the moderate or severe group in the contrast has increased concentrations of metabolites compared to the normal group.
Table 1.
Largest fold changes between the moderate-normal and severe-normal using ANOVA, showing the top four and bottom four largest significant changes in metabolite concentrations.
| Moderate vs normal | Severe-Normal | ||
|---|---|---|---|
| Compound | Fold Change [log2] | Compound | Fold Change [log2] |
| 2,3-bis(acetyloxy)propyl icosanoate | 5.6 | 2,3-bis(acetyloxy)propyl icosanoate | 6.4 |
| (5-D-ribonyl)hopane | 5.4 | (5-D-ribonyl)hopane | 6.1 |
| Delta 8,14 -Sterol | 4.6 | Delta 8,14 -Sterol | 5.5 |
| Vitamin K1 2,3-epoxide | 4.4 | Sorbitan palmitate | 5.3 |
| Asp-Glu-Glu-Gly | −1.6 | Maltose | −1.7 |
| Lys-Pro-Pro | −1.7 | Spermine | −1.7 |
| (S)-[8]-Gingerol | −1.7 | Ala-Lys-Thr-Arg | −1.8 |
| Ala-Glu-Asp-Ile | −1.8 | Stearoylcarnitine | −3.4 |
Pathway enrichment analysis between the groups showed that the arginine conversion to citrulline was amongst the most significantly perturbed pathway in the severe group. Together with the taurine and hypo-taurine metabolism (increase in taurine) it also had a high impact value (Table 2). Pathways that are small and only contain few metabolites (such as taurine and arginine metabolism) are easily ranked high with the method applied here. Individual pathway visualization of interesting pathways was performed to ensure a more precise interpretation of the data. These highlighted the glyoxylate metabolism, TCA cycle, arginine to citrulline conversion, and taurine metabolism. Other pathways that had a high p-value but are not discussed in this paper had a relatively low impact and therefore a lower biological effect.
Table 2.
Pathway analysis results (normal-severe) using Metaboanalyst. The P-value was calculated from pathway enrichment analysis and the impact was calculated using pathway topological analysis using betweenness centrality.
| P-value | Impact | |
|---|---|---|
| Glyoxylate and dicarboxylate metabolism | <0.01 | 0.29 |
| Galactose metabolism | <0.01 | 0.07 |
| Taurine and hypotaurine metabolism | <0.01 | 0.50 |
| Citrate cycle (TCA cycle) | <0.01 | 0.31 |
| Arginine and proline metabolism | 0.01 | 0.54 |
| Tyrosine metabolism | 0.03 | 0.13 |
| Starch and sucrose metabolism | 0.03 | 0.12 |
| Purine metabolism | 0.03 | 0.04 |
| Fructose and mannose metabolism | 0.03 | 0.19 |
| Butanoate metabolism | 0.03 | 0.13 |
Citrulline levels were elevated in especially the severe group (P <0.05), while arginine levels were lower compared to the normal fillets (P <0.05). The TCA cycle showed an increase in citrate (log2FC = 1), malate (log2FC = 1.4) and fumarate (log2FC = 0.8) in white stripe affected breast muscles (Figure 3). High numbers of incomplete breakdown products of protein digestion or catabolism along with isoleucine were also observed in birds affected by WS.
Figure 3.

TCA cycle depicting changes between severe WS and non-affected birds. Metabolites that were not present in the dataset do not have numbers. Dashed arrows show the direction of change that occurs in white striped affected broilers.
The results of the mineral analysis showed significant changes between the severe and normal group in Ca, Cu and Fe. Between normal and moderate there was only a significant difference for Cu. Zn levels in the severe group showed a tendency of being higher compared to normal breast fillets (P = 0.055) (Figure 4).
Figure 4.

Effect of moderate or severe WS on tissue mineral level. Ratios are in relation to the normal group. * indicates significance (P <0.05).
DISCUSSION
White striping is a major problem for the broiler industry and the pathology is still unclear. The results of this study showed clear differences in metabolites between birds affected and unaffected by WS; these differences could be linked to metabolic pathways. The statistical analysis showed that the differences, when comparing to the normal breast fillets, were practically continuous from normal to moderate to severe WS.
The increase in long- and medium-chain fatty acids and decrease in acylcarnitine esters, particularly the ones involved in the transfer of LCFA from the cytoplasm to the mitochondria (like palmitoylcarnitine, Figure 2), suggested a defect in the beta-oxidation. Increased levels of this metabolite were found in affected muscles (McCoin, et al., 2016). The increased levels of cis-5-tetradecanoylcarnitine (C14:1 carnitine) (P < 0.05) further back-up this theory, since this is used as a marker for beta-oxidation defects (Strauss, et al., 1995). Accumulation of fatty acids can be harmful to the cell, especially with compounds such as monoacylglycerides (P < 0.05), which affect membranes due to their strong detergent properties. The duration and extend of this lipid overload determines whether a cell is damaged (Listenberger, et al., 2003). Increase in fatty acid content can also increase intracellular Ca which may induce cytotoxic overload (Huang, et al., 1992). To determine if the same steps took place in these samples a mineral analysis was performed on the muscle samples, which showed a significant increase in calcium in this study as well (Figure 4).
One of the possible causes of the accumulation of fatty acids could be the lack of oxygen available. Oxygen deprivation can diminish or completely abolish the mitochondrial ß-oxidation, tricarboxylic acid cycle and the activity of the respiratory chain, which leads to the acute accumulation of fatty acids and their derivatives (van der Vusse, et al., 1992). ß-oxidation, however, occurs not only in mitochondria, but also in peroxisomes. In peroxisomal ß-oxidation, fatty acids can diffuse across the peroxisomal membrane thus not requiring a carrier molecule such as carnitine as is the case for the mitochondrial ß-oxidation (Visser, et al., 2007). This leads to an accumulation of medium to long-chain fatty acids, since peroxisomal ß-oxidation is outpacing the mitochondrial ß-oxidation. As these intermediates behave as detergents, however, they can induce cell damage and ultimately cell death. Hypoxia is also known for leading to mitochondrial architectural changes such as degeneration of cristae and, to some extent, dissolution of the matrix or the entire mitochondrion (Polak, et al., 2009; Papah, et al., 2017). Given the fact that fast growing broilers also have a low total amount of mitochondria makes them more susceptible to damage due to prolonged anaerobic metabolism. The breast muscles are almost entirely composed of very low mitochondrial-content Type IIB fibers, which could explain why WS is most prevalent there (Hudson, et al., 2017).
Arginine in animals is used in two direct metabolic pathways: 1. Arginine is decomposed into ornithine and urea by arginase, and 2. arginine and molecular oxygen generate citrulline and nitric oxide (NO) by nitric oxide synthase (NOS) (Guo, et al., 2015). The arginine NO-pathway was found to be significantly altered by the pathway enrichment analysis, a system that can be used for managing blood flow to tissues (Figure 5) (Müller Fernandes and Eiko Murakami, 2010).
Figure 5.
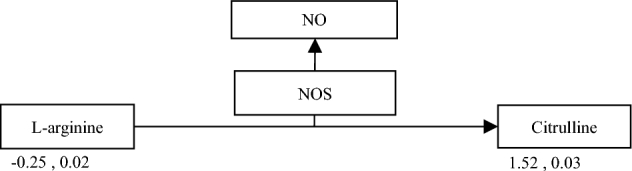
Conversion of arginine to citrulline. Numbers below metabolites depict fold change (log2) and p-value (FDR-adjusted).
Citrulline levels were elevated in especially the severe group, while arginine levels were lower compared to the normal fillets. The findings suggest an increase in the conversion from arginine to citrulline in order to increase the production of nitric oxide. Unfortunately, nitric oxide levels were not determined so this could not be verified. Nitric oxide favors an enhanced blood flow due to vasodilation in humans and broilers (Tan, et al., 2007; Bloomer, et al., 2010). Due to the hypoxic state believed to be present in breast muscle the system apparently tries to increase blood flow towards the muscle. This method only works to a certain level since molecular oxygen is required for the formation of NO which is why the system is probably already maxed out before white striping occurs (Lundberg and Weitzberg, 2008; Lundberg and Weitzberg, 2009). The system itself is also limited because blood flow can only be increased up to a certain point. Broilers are not able to synthesize arginine de novo and, therefore, solely depend on dietary arginine levels (Müller Fernandes and Eiko Murakami, 2010). Besides being able to increase blood flow, NO also participates as one of the mediators of hypoxia and re-oxygenation injury (Yu, et al., 1994). This is due to its free radical nature and high reactivity with the superoxide radical to yield peroxynitrite, an oxidant molecule. Nitric oxide could be one of the factors leading to the tissue damage that was seen in affected muscle tissue rather than supporting the animal in increasing blood flow (Yu, et al., 1994; Galkin, et al., 2007).
Taurine levels were found to be increased in WS cases and the taurine metabolism was among the most perturbed pathways (but with only two components in it). Taurine exerts both short-term as well as long-term actions in the control of ion channels and Ca homeostasis. The key effect of taurine is stabilization of the sarcolemma. Besides this, taurine also modulates the activity of various types of K channels and in particular of those able to couple metabolic state of striated fibers to electrical activity. Lastly, it controls intracellular Ca homeostasis by modulating calcium handling mechanisms and consequently excitation-contraction coupling (Conte Camerino, et al., 2004). Increases in muscle fiber size are associated with lower capillarisation, which in turn may lead to inadequate supply of oxygen to the muscle and inadequate elimination of metabolic intermediate products (Hoving-Bolink, et al., 2000). Experimental and clinical data have shown that taurine plays a protective role against damage induced by hypoxia due to the effects described above (Mankovskaya, et al., 2000; Petracci, et al., 2015). Apparently, this hypoxic state leads to an increase in the accumulation of taurine and its metabolite hypo taurine to prevent damage as shown in the fillets that were analyzed. A consequence though, may well be tissue swelling due to its osmotic properties. This can further compromise oxygen supply through compression of blood vessels. Taurine was not the only metabolite with osmotic properties that increased; so did sorbitol and alanine. Besides increases in organic osmolytes, cells are also able to re-adjust their volume by regulatory volume decrease. This is accomplished by the efflux of KCl induced by activation of ATP-dependent K and Cl channels. When ATP deficient conditions are present, KCL can accumulate intracellularly which can lead to irreversible cell swelling and finally cell damage/rupture (Okada, et al., 2001; Belardinellia, et al., 2004). Data from the mineral analysis on the muscle samples taken during this trial showed indeed an increase in Ca in severe WS cases, which shows cell swelling. Our data does not show the changes in K and Cl, while Soglia et al., (2015) did show this. Soglia also saw an increase in the water to protein ratio from 3.25 in normal cases to 3.52 in white striping/wooden breast cases, which also indicates swelling was taking place. This swelling can be further induced by damage to the cell membranes by the fatty acid intermediates as discussed previously. It may well be that this imbalance in osmolytes involved in cell size maintenance is something that has been unknowingly selected for. Selections have been made for broilers that exhibited high growth and low FCR, something that can be achieved by swelling and thus this can be an explanation for the imbalance that was seen here.
The mineral analysis also showed a significant increase in Cu and Fe. Cu is an important mineral in the activity of superoxide dismutase (SOD). SOD is an important antioxidant defense in nearly all cells that are exposed to oxygen (Tainer, et al., 1983; Culotta, et al., 1997). Higher levels of Cu could be due to an increased activity of SOD due to the oxidative stress that is occurring in WS affected broilers. The increase in Fe was difficult to explain. One explanation could be that the degenerative myopathic lesions lead to disruption of muscle cell structure, which leads to damaged porphyrin ring. This leads to breakdown of the heme molecule leading to release of iron from globin (Soglia, et al., 2016). The mineral analysis, however, shows total Fe content in the tissue, not the difference between bound an unbound Fe, and hence does not give the necessary information to determine if this takes place in affected muscle tissue. High Fe is known to induce oxidative stress and reduce exercise performance in skeletal muscle, which further increases the oxidative stress load (Reardon and Allen, 2009).
The tricarboxylic acid cycle (TCA) cycle is responsible for the total oxidation of acetyl-CoA that is derived from pyruvate under aerobic conditions. Second, the TCA cycle intermediates are required for the biosynthesis and catabolism of several amino acids (Cronan Jr and Laporte, 2005). Parts of the TCA cycle increased in white striping affected broilers, but not the entire cycle, something that is also seen during the course of hypoxia in cerebral metabolism (Figure 3). Anaplerotic reactions thus outbalance those leading to loss of carbon skeletons from the TCA cycle (Norberg and Siesjö, 1975). An explanation for this could be the occurrence of the oxaloacetate-fumarate flux or backflux. This backflux is the anaerobic conversion of oxaloacetate to malate, fumarate or even succinate (Brekke, et al., 2012). During hypoxia the electron transport chain is not able to oxidize reducing equivalents. Segments of the TCA cycle remain operative but exhibit opposing directionalities. Oxaloacetate, for example, is reduced to malate by malate dehydrogenase instead of converted to citrate. This contributes to the re-oxidation of nicotinamide adenine dinucleotide when the electron-transport chain is inhibited due to a lack of oxygen. The TCA cycle is also able to generate high energy phosphates through matrix-level phosphorylation. This is a highly reversible reaction that only happens if succinyl CoA is readily available. Another key ingredient for this conversion is the availability of NAD+. High energy phosphates generated from this reaction will maintain a modest membrane potential and help in sparing the extra mitochondrial ATP pools from mitochondrial consumption (Chinopoulos, 2013). Unfortunately, oxaloacetate was not present in this dataset and succinate did not show the significant increase one would expect. Citrate can also be formed from glutamine initiated by isocitrate dehydrogenase 2 (Wise, et al., 2011). Increases in the isocitrate dehydrogenase 2-dependent carboxylation of glutamine are accompanied by an increase of 2-hydroxyglutarate, which was also shown in WS fillets in this study (P < 0.05). The fact that the glyoxylate metabolism ranked high in the pathway analysis was due to the fact that a number of TCA compounds are also involved in this pathway. No clear links could be established however due to the low amount of metabolites involved in this pathway present in our dataset.
High numbers of incomplete breakdown products of protein digestion or catabolism along with isoleucine were also observed in birds affected by WS. One explanation could be that this is an indicator of poor blood supply and therefore nutrient supply in periphery areas. Breakdown products accumulate due to limited removal. It is difficult however to determine if this is a problem that spawns from lack of utilization or from muscle catabolism.
The hypotheses generated from this study are in line with recent literature in which it was stated that genetic selection of broilers has led to reduced muscular oxygenation and impaired metabolic waste product displacement. This theory is based on differentially expressed genes (Zambonelli, et al., 2016). In this study, the problem was studied on metabolite level, which is as mentioned in the introduction the downstream result of gene transcription and post-translational protein modification. Both studies, using complementary techniques, find a lot of similarities and most importantly common markers for hypoxia.
Although outside the scope of this research, the above findings suggest that as possible solutions for WS improved oxygen supply into the breast muscle or avoiding stress which can diminish blood supply into the breast muscle should be considered. Avoiding stress is very much a management tool, although calming agents may facilitate this. The question is how to induce blood supply into the muscle. Exercising birds frequently is technically an option, but with limited practical relevance. Improving ventilation to maximize O2 concentrations (and to minimize NH3) may also offer opportunities. Lastly, compounds that relax blood vessels in the muscles may offer benefits.
CONCLUSION
The result of this metabolomics study showed disturbances in WS affected broilers in fatty acid oxidation, TCA cycle, arginine metabolism, taurine metabolism and osmolytes responsible for cell swelling. The overall trigger for these changes appears to be a hypoxic situation being present in the breast muscle tissue of broilers. Likely, the vascular system in the breast muscle is marginal; it supports muscle growth under steady-state conditions, but is inadequate to support muscle health under stress. This hypoxic state goes hand-in-hand with oxidative stress, which combined leads to muscle problems. Finding ways to prevent or alleviate the hypoxic state the tissue is in should be the focus of future research work.
APPENDIX
Table A1.
Table of significantly affected metabolites based on ANOVA between the groups (FDR corrected P < 0.05).
| Metabolite | P–value | FDR |
|---|---|---|
| cis-5-Tetradecenoylcarnitine | P < 0.001 | Q < 0.001 |
| MG1829Z.12Z/00/00 | P < 0.001 | Q < 0.001 |
| N-Acetyl-2,6-diethylaniline | P < 0.001 | Q < 0.001 |
| 2,3-bisAcetyloxypropyl icosanoate | P < 0.001 | Q < 0.001 |
| Lys-Lys-Lys-Val | P < 0.001 | Q < 0.001 |
| Theonellasterol B | P < 0.001 | Q < 0.001 |
| Stearoylcarnitine | P < 0.001 | Q < 0.001 |
| PI403 | P < 0.001 | Q < 0.001 |
| Citric acid | P < 0.001 | Q < 0.001 |
| Sorbitan palmitate | P < 0.001 | Q < 0.01 |
| 16-Hydroxy hexadecanoic acid | P < 0.001 | Q < 0.01 |
| PR 5-D-ribonylhopane | P < 0.001 | Q < 0.01 |
| Norselic acid C | P < 0.001 | Q < 0.01 |
| Vitamin K1 2,3-epoxide | P < 0.001 | Q < 0.01 |
| 2',3'-Dihydro-phytomenadione | P < 0.001 | Q < 0.01 |
| Ala-Asn-Pro-Pro | P < 0.001 | Q < 0.01 |
| Lethedoside B | P < 0.001 | Q < 0.01 |
| ST dimethyl60/60/60/30 5Z.7E.22E.24E.24bE-1S.3R-26.27-dimethyl-24a.24b.24c-trihomo-9.10-seco-5.7.1019.22.24.24b-cholestahexaene-1.3.25-triol | P < 0.001 | Q < 0.01 |
| PI426 | P < 0.001 | Q < 0.01 |
| Delta 8,14 -Sterol | P < 0.001 | Q < 0.01 |
| Ergosterol | P < 0.001 | Q < 0.01 |
| Methyl-delta-ionone | P < 0.001 | Q < 0.01 |
| 2,3-Diacetoxypropyl stearate | P < 0.001 | Q < 0.01 |
| Asp-Leu-Pro-Ser | P < 0.001 | Q < 0.01 |
| Cys-Thr-Cys-His | P < 0.001 | Q < 0.01 |
| Alpha-Tocotrienol | P < 0.001 | Q < 0.01 |
| PR Coenzyme Q8 | P < 0.001 | Q < 0.01 |
| Cys-Lys-Gln-Pro | P < 0.001 | Q < 0.01 |
| Cys-Leu-Cys-Cys | P < 0.001 | Q < 0.01 |
| Lys-Pro-Pro | P < 0.001 | Q < 0.01 |
| Ophrysanin | P < 0.001 | Q < 0.01 |
| Cyanidin | P < 0.001 | Q < 0.01 |
| Taurine | P < 0.001 | Q < 0.01 |
| MG1846Z.9Z.12Z.15Z/00/00 | P < 0.001 | Q < 0.01 |
| SMd423 | P < 0.001 | Q < 0.01 |
| Histamine | P < 0.001 | Q < 0.01 |
| 3-Methylbutyl dodecanoate | P < 0.001 | Q < 0.01 |
| 3-Methylbutyl decanoate | P < 0.001 | Q < 0.01 |
| 3-octaprenyl-4-hydroxy-5-methoxybenzoate | P < 0.001 | Q < 0.01 |
| Sorbitol | P < 0.01 | Q < 0.05 |
| 3-heptaprenyl-4-hydroxybenzoate | P < 0.01 | Q < 0.05 |
| L-thiazolidine-4-carboxylate | P < 0.01 | Q < 0.05 |
| Elaidic carnitine | P < 0.01 | Q < 0.05 |
| L-Malic acid | P < 0.01 | Q < 0.05 |
| Fructose | P < 0.01 | Q < 0.05 |
| Asp-Met-Cys-His | P < 0.01 | Q < 0.05 |
| Hydroxyprolyl-Histidine | P < 0.01 | Q < 0.05 |
| PI351 | P < 0.01 | Q < 0.05 |
| PS404 | P < 0.01 | Q < 0.05 |
| L-Methionine | P < 0.01 | Q < 0.05 |
| PS1819Z/180 | P < 0.01 | Q < 0.05 |
| 1-Phospho-alpha-D-galacturonate | P < 0.01 | Q < 0.05 |
| Thiomorpholine 3-carboxylate | P < 0.01 | Q < 0.05 |
| Quinic acid | P < 0.01 | Q < 0.05 |
| PEP-1819Z/1836Z.9Z.12Z | P < 0.01 | Q < 0.05 |
| alpha-Narcotine | P < 0.01 | Q < 0.05 |
| L-Palmitoylcarnitine | P < 0.01 | Q < 0.05 |
| Sinapinic acid-O-sulphate | P < 0.01 | Q < 0.05 |
| 2-Hydroxy-24-keto-octacosanolide | P < 0.01 | Q < 0.05 |
| Dimethylglycine | P < 0.01 | Q < 0.05 |
| Isoleucine | P < 0.01 | Q < 0.05 |
| Acetoacetic acid | P < 0.01 | Q < 0.05 |
| Artobiloxanthone | P < 0.01 | Q < 0.05 |
REFERENCES
- Aviagen. 2012. Ross 308 broiler performance objectives. Accessed Apr. 2016. http://en.aviagen.com/assets/Tech_Center/Ross_Broiler/Ross-308-Broiler-PO-2014-EN.pdf. [Google Scholar]
- Bais P. 2011. Bioinformatics methods for metabolomics based biomarker detection in functional genomics studies. PhD thesis. Iowa State University. [Google Scholar]
- Bauermeister L., Morey A., Moran E., Singh M., Owens C., McKee S.. 2009. Occurrence of white striping in chicken breast fillets in relation to broiler size. Poult. Sci 88:33. [Google Scholar]
- Belardinellia L., Antzelevitch C., Fraserc H.. 2004. Inhibition of late (sustained/persistent) sodium current: a potential drug target to reduce intracellular sodium-dependent calcium overload and its detrimental effects on cardiomyocyte function. European Heart Journal Supplements 6:i3–i7. [Google Scholar]
- Bikker P., ten Tije N., Tijkorte A.. 2017. Fosforbenutting bij biologisch gehouden vleesvarkens. Wageningen Livestock Research doi 10.18174/428030. [Google Scholar]
- Bloomer R. J., Farney T. M., Trepanowski J. F., McCarthy C. G., Canale R. E., Schilling B. K.. 2010. Comparison of pre-workout nitric oxide stimulating dietary supplements on skeletal muscle oxygen saturation, blood nitrate/nitrite, lipid peroxidation, and upper body exercise performance in resistance trained men. J Int Soc Sports Nutr 7:16. [DOI] [PMC free article] [PubMed] [Google Scholar]
- Brekke E., Walls A. B., Norfeldt L., Schousboe A., Waagepetersen H. S., Sonnewald U.. 2012. Direct measurement of backflux between oxaloacetate and fumarate following pyruvate carboxylation. Glia 60:147–158. [DOI] [PubMed] [Google Scholar]
- Chinopoulos C. 2013. Which way does the citric acid cycle turn during hypoxia? The critical role of α‐ketoglutarate dehydrogenase complex. J. Neurosci. Res. 91:1030–1043. [DOI] [PubMed] [Google Scholar]
- Conte Camerino D., Tricarico D., Pierno S., Desaphy J. F., Liantonio A., Pusch M., Burdi R., Camerino C., Fraysse B., De Luca A.. 2004. Taurine and skeletal muscle disorders. Neurochem Res 29:135–142. [DOI] [PubMed] [Google Scholar]
- Cronan Jr. J., Laporte D.. 2005. Tricarboxylic acid cycle and glyoxylate bypass. EcoSal Plus 1 doi 10.1128/ecosalplus.3.5.2 [DOI] [PubMed] [Google Scholar]
- Culotta V. C., Klomp L. W., Strain J., Casareno R. L. B., Krems B., Gitlin J. D.. 1997. The copper chaperone for superoxide dismutase. J. Biol. Chem. 272:23469–23472. [DOI] [PubMed] [Google Scholar]
- Ferreira T., Casagrande R., Vieira S., Driemeier D., Kindlein L.. 2014. An investigation of a reported case of white striping in broilers. J Appl Poultry Res 23:748–753. [Google Scholar]
- Fiehn O. 2002. Metabolomics—the link between genotypes and phenotypes. Plant Mol Biol 48:155–171. [PubMed] [Google Scholar]
- Galkin A., Higgs A., Moncada S.. 2007. Nitric oxide and hypoxia. Essays Biochem. 43:29–42. [DOI] [PubMed] [Google Scholar]
- Gao J., Tarcea V. G., Karnovsky A., Mirel B. R., Weymouth T. E., Beecher C. W., Cavalcoli J. D., Athey B. D., Omenn G. S., Burant C. F., Jagadish H. V.. 2010. Metscape: a Cytoscape plug-in for visualizing and interpreting metabolomic data in the context of human metabolic networks. Bioinformatics 26:971–973. [DOI] [PMC free article] [PubMed] [Google Scholar]
- Guo Y., Shi B., Yan S., Xu Y., Li J., Li T.. 2015. Effects of arginine on cytokines and nitric oxide synthesis in broilers. J. Anim. Plant. Sci. 25:366–371. [Google Scholar]
- Havenstein G. B., Ferket P. R., Qureshi M. A.. 2003. Carcass composition and yield of 1957 versus 2001 broilers when fed representative 1957 and 2001 broiler diets. Poult. Sci. 82:1509–1518. [DOI] [PubMed] [Google Scholar]
- Havenstein G. B., Ferket P. R., Qureshi M. A.. 2003. Growth, livability, and feed conversion of 1957 versus 2001 broilers when fed representative 1957 and 2001 broiler diets. Poult. Sci. 82:1500–1508. [DOI] [PubMed] [Google Scholar]
- Hoving-Bolink A. H., Kranen R. W., Klont R. E., Gerritsen C. L., de Greef K. H.. 2000. Fibre area and capillary supply in broiler breast muscle in relation to productivity and ascites. Meat Sci. 56:397–402. [DOI] [PubMed] [Google Scholar]
- Hoybye C., Wahlstrom E., Tollet-Egnell P., Norstedt G.. 2014. Metabolomics: a tool for the diagnosis of GH deficiency and for monitoring GH replacement? Endocrine Connections 3:200–206. [DOI] [PMC free article] [PubMed] [Google Scholar]
- Huang J. M., Xian H., Bacaner M.. 1992. Long-chain fatty acids activate calcium channels in ventricular myocytes.. Proc. Natl. Acad. Sci. 89:6452–6456. [DOI] [PMC free article] [PubMed] [Google Scholar]
- Hudson N., Bottje W., Hawken R., Kong B., Okimoto R., Reverter A.. 2017. Mitochondrial metabolism: a driver of energy utilisation and product quality? Anim. Prod. Sci. 57:2204–2215. [Google Scholar]
- Kankainen M., Gopalacharyulu P., Holm L., Oresic M.. 2011. MPEA–metabolite pathway enrichment analysis. Bioinformatics 27:1878–1879. [DOI] [PubMed] [Google Scholar]
- Karnovsky A., Weymouth T., Hull T., Tarcea V. G., Scardoni G., Laudanna C., Sartor M. A., Stringer K. A., Jagadish H. V., Burant C., Athey B., Omenn G. S.. 2012. Metscape 2 bioinformatics tool for the analysis and visualization of metabolomics and gene expression data. Bioinformatics 28:373–380. [DOI] [PMC free article] [PubMed] [Google Scholar]
- Kutmon M., van Iersel M. P., Bohler A., Kelder T., Nunes N., Pico A. R., Evelo C. T.. 2015. PathVisio 3: an extendable pathway analysis toolbox. PLoS Comput Biol 11:e1004085. [DOI] [PMC free article] [PubMed] [Google Scholar]
- Kuttappan V., Shivaprasad H., Shaw D., Valentine B., Hargis B., Clark F., McKee S., Owens C.. 2013. Pathological changes associated with white striping in broiler breast muscles. Poult. Sci. 92:331–338. [DOI] [PubMed] [Google Scholar]
- Kuttappan V. A., Brewer V. B., Apple J. K., Waldroup P. W., Owens C. M.. 2012. Influence of growth rate on the occurrence of white striping in broiler breast fillets. Poult. Sci. 91:2677–2685. [DOI] [PubMed] [Google Scholar]
- Kuttappan V. A., Huff G. R., Huff W. E., Hargis B. M., Apple J. K., Coon C., Owens C. M.. 2013. Comparison of hematologic and serologic profiles of broiler birds with normal and severe degrees of white striping in breast fillets. Poult. Sci. 92:339–345. [DOI] [PubMed] [Google Scholar]
- Kuttappan V. A., Lee Y. S., Erf G. F., Meullenet J. F., McKee S. R., Owens C. M.. 2012. Consumer acceptance of visual appearance of broiler breast meat with varying degrees of white striping. Poult. Sci. 91:1240–1247. [DOI] [PubMed] [Google Scholar]
- Kuttappan V. A., Owens C. M., Coon C., Hargis B. M., Vazquez-Anon M.. 2017. Incidence of broiler breast myopathies at 2 different ages and its impact on selected raw meat quality parameters. Poult Sci 96:3005–3009. [DOI] [PubMed] [Google Scholar]
- Kuttappan V. A., Shivaprasad H. L., Shaw D. P., Valentine B. A., Hargis B. M., Clark F. D., McKee S. R., Owens C. M.. 2013. Pathological changes associated with white striping in broiler breast muscles. Poult. Sci. 92:331–338. [DOI] [PubMed] [Google Scholar]
- Lisec J., Schauer N., Kopka J., Willmitzer L., Fernie A. R.. 2006. Gas chromatography mass spectrometry-based metabolite profiling in plants. Nat Protoc 1:387–396. [DOI] [PubMed] [Google Scholar]
- Listenberger L. L., Han X., Lewis S. E., Cases S., Farese R. V. Jr, Ory D. S., Schaffer J. E.. 2003. Triglyceride accumulation protects against fatty acid-induced lipotoxicity. Proc. Natl. Acad. Sci. 100:3077–3082. [DOI] [PMC free article] [PubMed] [Google Scholar]
- Lundberg J. O., Weitzberg E.. 2008. Nitrite reduction to nitric oxide in the vasculature. American Journal of Physiology-Heart and Circulatory Physiology 295:H477–H478. [DOI] [PubMed] [Google Scholar]
- Lundberg J. O., Weitzberg E.. 2009. NO generation from inorganic nitrate and nitrite: Role in physiology, nutrition and therapeutics. Arch. Pharm. Res. 32:1119–1126. [DOI] [PubMed] [Google Scholar]
- Mankovskaya I. N., Serebrovskaya T. V., Swanson R. J., Vavilova G. L., Kharlamova O. N.. 2000. Mechanisms of taurine antihypoxic and antioxidant action. High Altitude Medicine & Biology 1:105–110. [DOI] [PubMed] [Google Scholar]
- McCoin C. S., Piccolo B. D., Knotts T. A., Matern D., Vockley J., Gillingham M. B., Adams S. H.. 2016. Unique plasma metabolomic signatures of individuals with inherited disorders of long-chain fatty acid oxidation. J Inherit Metab Dis 39:399–408. [DOI] [PMC free article] [PubMed] [Google Scholar]
- Müller Fernandes J. I., Eiko Murakami A.. 2010. Arginine metabolism in uricotelic species. Acta Sci Anim Sci 32:357–366. [Google Scholar]
- Norberg K., Siesjö B.. 1975. Cerebral metabolism in hypoxic hypoxia. I. Pattern of activation of glycolysis: a re-evaluation. Brain Res. 86:31–44. [DOI] [PubMed] [Google Scholar]
- OECD/FAO 2016. OECD-FAO Agricultural Outlook 2016–2025. doi 10.1787/19991142. [Google Scholar]
- Okada Y., Maeno E., Shimizu T., Dezaki K., Wang J., Morishima S.. 2001. Receptor-mediated control of regulatory volume decrease (RVD) and apoptotic volume decrease (AVD). J Physiol 532:3–16. [DOI] [PMC free article] [PubMed] [Google Scholar]
- Papah M. B., Brannick E. M., Schmidt C. J., Abasht B.. 2017. Evidence and role of phlebitis and lipid infiltration in the onset and pathogenesis of Wooden Breast Disease in modern broiler chickens. Avian Pathol 46:1–21. [DOI] [PubMed] [Google Scholar]
- Petracci M., Bianchi M., Mudalal S., Cavani C.. 2013. Functional ingredients for poultry meat products. Trends in Food Science & Technology 33:27–39. [Google Scholar]
- Petracci M., Cavani C.. 2011. Muscle growth and poultry meat quality issues. Nutrients 4:1–12. [DOI] [PMC free article] [PubMed] [Google Scholar]
- Petracci M., Mudalal S., Babini E., Cavani C.. 2014. Effect of white striping on chemical composition and nutritional value of chicken breast meat. Italian Journal of Animal Science 13:3138. [Google Scholar]
- Petracci M., Mudalal S., Bonfiglio A., Cavani C.. 2013. Occurrence of white striping under commercial conditions and its impact on breast meat quality in broiler chickens. Poult. Sci. 92:1670–1675. [DOI] [PubMed] [Google Scholar]
- Petracci M., Mudalal S., Soglia F., Cavani C.. 2015. Meat quality in fast-growing broiler chickens. Worlds Poult. Sci. J. 71:363–374. [Google Scholar]
- Polak M., Przybylska-Gornowicz B., Faruga A.. 2009. Abnormal morphology of skeletal muscles in meat-type chickens-ultrastructural observations. Pol J Vet Sci 12:473. [PubMed] [Google Scholar]
- Reardon T. F., Allen D. G.. 2009. Iron injections in mice increase skeletal muscle iron content, induce oxidative stress and reduce exercise performance. Exp Physiol. 94:720–730. [DOI] [PubMed] [Google Scholar]
- Russo E., Drigo M., Longoni C., Pezzotti R., Fasoli P., Recordati C.. 2015. Evaluation of White Striping prevalence and predisposing factors in broilers at slaughter. Poult. Sci. 94:1843–1848. [DOI] [PubMed] [Google Scholar]
- Soglia F., Laghi L., Canonico L., Cavani C., Petracci M.. 2016. Functional property issues in broiler breast meat related to emerging muscle abnormalities. Food Res. Int. 89:1071–1076. [Google Scholar]
- Soglia F., Mudalal S., Babini E., Di Nunzio M., Mazzoni M., Sirri F., Cavani C., Petracci M.. 2015. Histology, composition, and quality traits of chicken Pectoralis major muscle affected by wooden breast abnormality. Poult Sci 95:651–659. [DOI] [PubMed] [Google Scholar]
- Strauss A. W., Powell C. K., Hale D. E., Anderson M. M., Ahuja A., Brackett J. C., Sims H. F.. 1995. Molecular basis of human mitochondrial very-long-chain acyl-CoA dehydrogenase deficiency causing cardiomyopathy and sudden death in childhood. Proc. Natl. Acad. Sci. 92:10496–10500. [DOI] [PMC free article] [PubMed] [Google Scholar]
- Tainer J. A., Getzoff E. D., Richardson J. S., Richardson D. C.. 1983. Structure and mechanism of copper, zinc superoxide dismutase. Nature 306:284–287. [DOI] [PubMed] [Google Scholar]
- Tan X., Sun W.-D., Li J.-C., Pan J.-Q., Liu Y.-J., Wang J.-Y., Wang X.-L.. 2007. L-arginine prevents reduced expression of endothelial nitric oxide synthase (NOS) in pulmonary arterioles of broilers exposed to cool temperatures. The Veterinary Journal 173:151–157. [DOI] [PubMed] [Google Scholar]
- van den Berg R. A., Hoefsloot H. C., Westerhuis J. A., Smilde A. K., van der Werf M. J.. 2006. Centering, scaling, and transformations: improving the biological information content of metabolomics data. BMC Genomics 7:142. [DOI] [PMC free article] [PubMed] [Google Scholar]
- van der Vusse G. J., Glatz J. F., Stam H. C., Reneman R. S.. 1992. Fatty acid homeostasis in the normoxic and ischemic heart. Physiol. Rev. 72:881–940. [DOI] [PubMed] [Google Scholar]
- Vinaixa M., Samino S., Saez I., Duran J., Guinovart J. J., Yanes O.. 2012. A Guideline to Univariate Statistical Analysis for LC/MS-Based Untargeted Metabolomics-Derived Data. Metabolites 2:775–795. [DOI] [PMC free article] [PubMed] [Google Scholar]
- Visser W. F., Van Roermund C. W., Ijlst L., Waterham H. R., Wanders R. J.. 2007. Metabolite transport across the peroxisomal membrane. Biochem. J. 401:365–375. [DOI] [PMC free article] [PubMed] [Google Scholar]
- Wise D. R., Ward P. S., Shay J. E. S., Cross J. R., Gruber J. J., Sachdeva U. M., Platt J. M., DeMatteo R. G., Simon M. C., Thompson C. B.. 2011. Hypoxia promotes isocitrate dehydrogenase-dependent carboxylation of α-ketoglutarate to citrate to support cell growth and viability. Proc. Natl. Acad. Sci. 108:19611–19616. [DOI] [PMC free article] [PubMed] [Google Scholar]
- Xia J., Mandal R., Sinelnikov I. V., Broadhurst D., Wishart D. S.. 2012. MetaboAnalyst 2.0–a comprehensive server for metabolomic data analysis. Nucleic Acids Res. 40:W127–W133. [DOI] [PMC free article] [PubMed] [Google Scholar]
- Xia J., Psychogios N., Young N., Wishart D. S.. 2009. MetaboAnalyst: a web server for metabolomic data analysis and interpretation. Nucleic Acids Res. 37:W652–W660. [DOI] [PMC free article] [PubMed] [Google Scholar]
- Xia J., Sinelnikov I. V., Han B., Wishart D. S.. 2015. MetaboAnalyst 3.0–making metabolomics more meaningful. Nucleic Acids Res 43:W251–W257. [DOI] [PMC free article] [PubMed] [Google Scholar]
- Xia J., Wishart D. S.. 2011. Metabolomic data processing, analysis, and interpretation using MetaboAnalyst. Curr Protoc Bioinformatics Chapter 14:Unit1410. [DOI] [PubMed] [Google Scholar]
- Yamada T., Letunic I., Okuda S., Kanehisa M., Bork P.. 2011. iPath2.0: interactive pathway explorer. Nucleic Acids Res. 39:W412–W415. [DOI] [PMC free article] [PubMed] [Google Scholar]
- Yu L., Gengaro P. E., Niederberger M., Burke T. J., Schrier R. W.. 1994. Nitric oxide: a mediator in rat tubular hypoxia/reoxygenation injury. Proc. Natl. Acad. Sci. 91:1691–1695. [DOI] [PMC free article] [PubMed] [Google Scholar]
- Zambonelli P., Zappaterra M., Soglia F., Petracci M., Sirri F., Cavani C., Davoli R.. 2016. Detection of differentially expressed genes in broiler pectoralis major muscle affected by White Striping – Wooden Breast myopathies. Poult. Sci. 95:2771–2785. [DOI] [PubMed] [Google Scholar]
- Zuidhof M. J., Schneider B. L., Carney V. L., Korver D. R., Robinson F. E.. 2014. Growth, efficiency, and yield of commercial broilers from 1957, 1978, and 2005. Poult Sci. 93:2970–2982. [DOI] [PMC free article] [PubMed] [Google Scholar]