Abstract
The objective of this study was to evaluate the effect of parity and stage of gestation on predicted maternal weight gain and efficiency of feed use in gestating sows from a commercial sow farm. A total of 712 females (Camborough, PIC, Hendersonville, TN) were group-housed from days 5 to 112 of gestation and individually fed with electronic sow feeders (ESF). Feed intake and body weight (BW) were recorded daily throughout gestation via the ESF and a scale located in an alleyway just after sows exited the feeding station. Gilts (parity 1) and sows received 6,450 or 7,418 kcal ME, respectively, whereas 12 thin females received 9,675 kcal ME per day. Maternal weight gain, not including products of conceptus, and feed efficiency were predicted using a series of equations to model nutrient utilization in gestation. Data were divided into 3 parity groups: 1, 2, and 3+, and gestation was divided into 3 periods: days 5 to 39, 40 to 74, and 75 to 109. After dividing energy requirements into tissue pools for maintenance, growth (maternal protein and fat deposition), and products of conceptus, the greatest portion of the energy requirement was for maintenance and maternal growth. The predicted energy used for maternal protein and fat deposition decreased (P < 0.05) in each period of gestation, regardless of parity group. Parity 2 sows had the greatest (P < 0.05) energy use for maternal protein and fat deposition in all stages of gestation, whereas parity 1 sows had a negative energy balance during the final stage of gestation. Parity 1 sow BW increased (P < 0.05) in each period of gestation; however, parity 2 and 3+ sow BW remained static from days 75 to 109 of gestation. Parity 3+ sows had the greatest (P < 0.05) maternal BW throughout the course of gestation compared with other parity groups. Regardless of parity, maternal ADG decreased (P < 0.05) from days 40 to 74 before increasing (P < 0.05) during the final stage of gestation. Parity 1 sows had the greatest (P < 0.05) ADG in all gestation periods. Parity 1 sow G:F decreased (P < 0.05) in each sequential period of gestation. Parity 2 and 3+ sow G:F decreased (P < 0.05) from days 40 to 74 but improved (P < 0.05) during the final period of gestation. Parity 1 sow G:F was greater than parity 2 and 3+ sows in most gestation periods. Overall, this study and subsequent prediction models show how stage of gestation and parity affect the growth of different tissue pools, sow maternal BW, and feed usage throughout the course of gestation.
Keywords: gestation, maternal growth, sows
INTRODUCTION
Previous gestating sow nutrient requirement research (Close et al., 1985; Noblet et al., 1990; Dourmad et al., 1999) has been used to develop models based on sow body condition, parity, and stage of gestation (Noblet and Etienne, 1987b; Dourmad et al., 2008; NRC 2012). The models predict energy requirements and utilization for individual sows where priority is given to satisfy energy requirements for body maintenance functions, growth of conceptus, and maternal body protein deposition with nutrients above these requirements available for maternal lipid deposition (Dourmad et al., 2008; NRC, 2012). In cases when energy from feed intake is insufficient, maternal body lipid is mobilized and used as an energy source. Dourmad et al. (1996) indicated that the initial stage of gestation seems to be the sole period during which body reserves can be reestablished.
Previous literature has reported changes in nutrient utilization by different stages of gestation and parity through comparative slaughter techniques (Dourmad et al., 1996; McPherson et al., 2004; Ji et al., 2005). However, data are limited pertaining to the application of these models in today’s commercial sow herds to determine maternal growth and efficiency of feed usage of modern sows with large litter sizes. This information will allow for a better understanding of how females use energy provided during gestation and their metabolic state upon entry into the farrowing house. Therefore, the objectives of this study were to investigate the effect of parity and stage of gestation on modeled maternal weight gain and efficiency of feed utilization in group-housed gestating sows from a commercial sow farm.
MATERIALS AND METHODS
The data used to model maternal weight gain and efficiency of feed use in this analysis were from a study by Thomas et al. (2018) that was conducted at a commercial sow farm in central Nebraska. Females were individually housed in stalls (gilts 0.56 × 2.1 m and sows 0.61 × 2.3) from days 0 to 5 of gestation and then were group-housed from days 5 to 112 of gestation. Pens for sows provided 2.04 m2 per sow and those for gilts provided 1.95 m2 per gilt. Each pen was equipped with 6 electronic feeding stations (Nedap Velos, Gronelo, Netherlands) allowing for up to 45 females per station and 28 nipple waterers to provide ad libitum access to water. Each feeding station was 2.0-m long × 0.56-m wide. Females were group-housed in dynamic groups (260 females per pen), meaning serviced sows were entering the group (approximately day 5 of gestation) as sows due to farrow were exiting (approximately day 112 of gestation). This occurred over a 3- to 4-wk period; thereafter, the pen remained static (no movement of newly bred sows into the pen) until the sows reached day 112 of gestation and the process repeated. Each pen was equipped with a scale (2.13-m long × 0.51-m wide, New Standard US Inc., Sioux Falls, SD) located in the alleyway following the feeding stations and prior to returning to the pen for individual sow weight collection every time the sow exited the feeding station.
From days 5 to 112 of gestation, females were fed a diet containing 0.63% standardized ileal digestible Lys and 3,325 kcal ME per kg according to parity and body condition. Gilts, ideal condition sows, and skinny sows were offered 2.0, 2.3, and 3.0 kg/d, respectively, providing 6,450, 7,418, and 9,675 kcal ME per day, respectively, following standard practice at this commercial farm. The ME content of the diet and intake was used rather than NE because models from the literature were reported on an ME basis.
Feed intake data were manually extracted daily through Nedap Velos software at approximately 13:00 to ensure that all females had eaten their daily allocation before system reset at 14:00. The Nedap Velos system reported 1 total intake value per day of gestation and it is assumed that the feed which was dispensed was consumed by the sow before leaving the feeding station. Sows had to walk across a scale as they moved from the feeding station back into the pen, and as a result, sow body weight (BW) was automatically recorded. Sows were also manually weighed at least twice during the course of the study. These weights were collected on all females near the beginning and end of gestation. These weights were then used to eliminate outlier weights in the data set based on the ADG generated from the 2 weights and predicted BW based on the initial known weight and day of gestation.
The study was conducted over a 149-d period, from late May to mid-October. A total of 861 females were enrolled in the study, of which 712 completed. Daily intake and weight values were recorded for each sow from days 5 to 112 of gestation. These data were then divided into 3 parity groups (1, 2, and 3+) and gestation was divided into three 5-wk intervals (days 5 to 39, 40 to 74, and 75 to 109). Days 110, 111, and 112 of gestation were not included in the analysis. Daily feed intake and BW were recorded from days 5 to 112 of gestation to determine ADFI, ADG, and G:F for each female. At the conclusion of the study, the total number of daily observations was 75,962.
Backfat depth was measured at entry into pen gestation and on entering the farrowing house (approximately days 5 and 112 of gestation). Backfat depth was measured at the P2 position (last rib, 7 cm from the center line of the back) using a Lean-Meater (RENCO, Minneapolis, MN).
Descriptive statistics in the form of means, histograms, and scatterplots were generated using the PROC MEANS, PROC GPLOT, and PROC SGPLOT statements in SAS (Version 9.4, SAS Institute Inc., Cary, NC) for the daily observations. Extreme observations were found for female ADG, using descriptive statistics, generated from the variability between daily BW collections. Observations were deemed as outliers based on a calculated critical t-score using a Bonferroni adjustment (0.05/number of observations) (Stroup, 2013). This indicated that observations ± 4.97 standard deviations from the mean were considered outliers and were removed from the data set.
Reproductive performance criteria of sows were recorded using the PigCHAMP Knowledge Software (Ames, IA) and were extracted at the end of the trial. The total number of pigs born, total number of pigs born alive, number of stillborn pigs, number of mummified fetuses, number of weaned pigs, and gestation length were recorded (Table 1).
Table 1.
Descriptive statistics for data included in the study
| Item | Mean | SD | Minimum | Maximum |
|---|---|---|---|---|
| Parity | 2.3 | 1.31 | 1 | 5 |
| Total born | 14.9 | 3.13 | 1 | 25 |
| Born alive | 14.2 | 3.06 | 1 | 23 |
| Stillbirths | 0.37 | 0.68 | 0 | 9 |
| Mummies | 0.30 | 0.59 | 0 | 4 |
| Pigs weaned | 13.3 | 2.19 | 0 | 17 |
| Gestation length, d | 115.3 | 0.99 | 112 | 117 |
Values from a total of 712 females (Camborough, PIC, Hendersonville, TN) are used.
Definitions and Calculations
Maternal body predictions do not include the products of conceptus, defined as the fetus, placenta, and fluids. Maternal weight gain and feed efficiency were predicted for each female using a series of equations to model nutrient utilization by determining daily conceptus weight, daily maintenance requirement, daily energy retention of conceptus, and daily energy use for maternal protein and lipid deposition. Models presented by the NRC (2012) and Dourmad et al. (2008) were used as a base to predict the response of the sow to a given nutrient supply. The models use the principle that energy is partitioned between maintenance, growth of conceptus, and maternal protein and lipid deposition as outlined by Dourmad et al. (1999). Briefly, priority is given to maintenance requirements and the demands of the growing conceptus (Dourmad et al., 1999). Then needs for maternal protein growth are prioritized and any excess contribute to lipid deposition. Conversely, body reserves will be mobilized when energy intake is below that for maintenance and products of conceptus.
The NRC (2012) prediction equation for energy-dependent maternal protein deposition requires an adjustment factor to account for unexplained changes in protein deposition that is not clearly defined. Consequently, the model proposed by Dourmad et al. (2008) was used to predict maternal protein and lipid deposition. Variables were calculated on an ME basis, as presented in the sow gestation models (Dourmad et al., 2008; NRC, 2012).
The NRC (2012) equation predicts the weight of conceptus (conceptus weight is comprised of the fetus, placenta, and fluids) and energy content of conceptus using natural logarithmic values as a function of time and litter size at farrowing:
The equations are adapted from Dourmad et al. (1999) where the authors combined a set of regression equations, developed by Noblet et al. (1985), generating 1 equation for both weight and energy content of conceptus (fetus, placenta, and fluids). The equations allow for estimations of conceptus weight and energy content at any given day of gestation. These equations should be used with caution as they were developed over 30 yr ago from a population of 26 gilts (Large White breed) with a range in litter size of 9 to 14. Total born has increased significantly since those studies, now averaging over 14 pigs in many of the most prolific sow herds, and a significant proportion of total born litter sizes are over 20 pigs (Thomas et al., 2018). The NRC (2012) accounts for these changes in litter size by correcting for mean piglet birth weight, using the following equation:
The equation is derived from the work of Dourmad et al. (1999) (except for the value 1.12), as the anticipated litter birth weight (fetus only, not including the weight of the placenta or fluids) based on anticipated gestation length (114 d) and litter size. It is unknown what the value 1.12 represents and details are not reported in the NRC (2012) nor are they found in the previous literature discussing the use of these equations (Noblet et al., 1985; Noblet et al., 1990; Dourmad et al., 1999). When applying this equation to individual sows with over 14 pigs born alive, the predictions are inflated due to the exponent terms and results in unrealistic estimates.
Therefore, a correction ratio was developed using the litter birthweight as the numerator portion and the denominator portion of the ratio is the NRC 2012 litter birth weight equation minus the 1.12 unexplained coefficient,
This ratio yielded litter birthweight estimates for total litter sizes observed (maximum of 25 pigs) in our study with more realistic predictions compared with those using the NRC (2012) equations.
In our study, it was not possible to collect pig birth weights. As a result, pig birth weight was estimated from an experiment by Gonçalves et al. (2016) that used similar high-producing females (14.5 total born pigs per litter average) housed in pen groups, fed similar amounts of feed. Briefly, individual pig birth weights from a total of 1,102 females from the study of Gonçalves et al. (2016) were used to develop a prediction equation for piglet BW. The initial model started with a single predictor variable of total born. A manual forward selection process was then conducted and addition of predictor variables was based on the Bayesian Information Criterion (BIC). An inclusion of a predictor variable with a reduction in BIC of more than 2 was considered improved. There was evidence parity grouping (1 or 2+) improved the model. Further evaluation of the total born by parity group interaction, quadratic response of total born by parity group interaction, or a quadratic term for total born additions to the model did not improve model fit. Therefore, the final model for the piglet birth weight prediction equation contained parity and total born as input variables and described as follows:
where the intercept (b) for parities 1 and 2+ were 1.78 and 1.90, respectively.
Daily predictions are required for modeling purposes for each of these variables and the ratio can only be used to determine weight and energy content of conceptus on day 114 of gestation because we only have known pig BW at farrowing. In an effort to determine weight and energy content of conceptus for each day of gestation, we reviewed the data from Noblet et al. (1985) where the NRC (2012) equation originated, and we determined the regression equation calculated for a litter size of 12. Next, we determined conceptus weight and energy content of conceptus from days 4 through 114 of gestation for a litter size of 12. We were then able to calculate the percent of final conceptus weight and percent of final energy content of conceptus for each day of gestation. Multiplying these percentages by final conceptus weight and final energy content of conceptus at day 114 of gestation generated a value for each day of gestation. Thus, the equations used to predict weight and energy content of conceptus at each day of gestation are as follows:
where final conceptus weight and final energy content of conceptus are calculated using the NRC (2012) equations, correcting for mean piglet birth weight, on day 114 of gestation.
Energy retention of the conceptus (ERc, kJ) was determined by calculating the difference in energy content of conceptus between each day of gestation.
The gestation sow model proposed by Dourmad et al. (2008) suggests that ME for maintenance (MEm) under thermoneutral conditions with moderate physical activity ranges from 400 to 460 kJ per kg BW0.75 based on observations by Noblet and Etienne (1987b) and Everts (1994). The equation used to predict female maintenance requirement per day of gestation is as follows:
Our estimations assume that temperature conditions were thermoneutral throughout the duration of this study and that females spent no more than 4 h per day standing. The staff monitored high and low room temperatures daily and the set point for ventilation control was 18 °C to ensure that environmental temperature was at or above the thermoneutral zone. Quantitative physical activity measures were not recorded but visual observations and inspection of feeding time records suggested that females likely spent no more than 4 h per day standing.
Nitrogen retention in the pregnant sow was estimated to determine maternal protein deposition. Nitrogen retention was calculated considering N retained in the conceptus (NRc) and N retained in maternal tissue which depends on parity, stage of gestation, and the supple of ME above the maintenance requirement. Protein content of the conceptus was predicted using the following equation (Dourmad et al., 2008) which can then be divided by 6.25, yielding N content of conceptus:
Nitrogen content of conceptus (g/d) = Protein content of conceptus (g)/6.25.
Nitrogen retained in the conceptus (NRc) was then determined by calculating the difference in daily N content of conceptus.
Whole body N retention was calculated using the following equation (Dourmad et al., 2008), assuming protein and amino acid intake were not limiting:
where NRc = N retention in conceptus (g/J), a = 0.571 in the first pregnancy and a = 0.366 for other parities, ME = kJ per day ME intake, and MEmm = maintenance requirement at day 5 of gestation.
The amount of energy available to be deposited as protein in maternal tissues (ERmp) was calculated from N retention (Dourmad et al., 2008) as follows:
Recall, in this model, priority is given to satisfy energy requirements for body maintenance functions, growth of conceptus, and maternal body protein deposition, with the remaining nutrients available for lipid deposition (ERmf). If energy intake was insufficient to support maintenance requirements, growth of conceptus, and maternal body protein deposition, maternal body lipid was mobilized and used as a source of energy (Dourmad et al., 2008) as follows:
where kc, kp, and kf are the efficiencies of ME for uterine growth, protein deposition, and fat deposition, respectively. Efficiencies of 0.50, 0.60, and 0.80 were used for kc, kp, and kf, respectively, in this study as reported by Dourmad et al. (2008). The efficiency of utilization of ME has been evaluated in previous research with estimates for maternal gain between 70% and 85% (Close et al., 1985; Noblet and Etienne, 1987b; Everts and Dekker, 1994). In the case of energy mobilization from body reserves (lipid mobilization) to provide energy, the efficiency was the same as fat, 0.80 (kr; Noblet et al., 1990).
The energy available for maternal tissue deposition was determined by combining the energy available for protein and lipid deposition. This was then converted from kJ to kcal to kg, assuming the kcal per kg ME provided in the diet was 3,225 kcal per kg, and later used to determine maternal feed efficiency as follows:
If energy intake was insufficient to support maintenance requirements, growth of the conceptus, and maternal protein deposition, the energy available for maternal deposition will be negative. This indicates that the female was in a negative energy balance and was mobilizing maternal lipids to meet maintenance requirements, energy required by the conceptus, and maternal protein deposition.
Finally, protein and lipid deposition were determined in terms of female BW (Dourmad et al., 2008) as follows:
Total maternal protein and maternal lipid deposition were predicted by calculating the sum of each, for each individual sow.
Maternal BW gain per day of gestation was determined by subtracting the weight of conceptus (fetus, placenta, and fluids), correcting for mean piglet birth weight, from the average weight recorded per day of gestation. Maternal BW gain from days 5 to 112 of gestation, respectively, was determined using the following equation:
When calculating maternal BW gain, the day of gestation for the final BW and weight of conceptus were the same. Meaning, if a female was moved to farrowing on day 111 of gestation, the final BW would be from day 111 of gestation and the corresponding weight of conceptus would also be from day 111 of gestation.
Maternal ADG was defined as the difference in daily maternal BW. Maternal feed efficiency is reported as G:F and was determined using the following equation:
Statistical Model
Data from this study were divided into 3 parity groups (1, 2, and 3+) and gestation was divided into 3 periods (indicating the average day within each period): days 5 to 39 (22), 40 to 74 (56), and 75 to 109 (92). The weekly mean of the daily observations was computed for each sow with the exception of G:F, where the median daily value was used for the analysis. The median value was used for G:F due to the instability of the estimates when the daily gain was near 0. Evaluation of a comparison of the weekly means for G:F and the median value suggested that the mean within period and parity was similar but using the median led to a reduction in the number of extreme estimates. These weekly values were then used for the analysis by period. Weight of conceptus, female maintenance requirement, energy retention of conceptus, energy used for maternal protein deposition, protein deposition, energy used for maternal lipid deposition, lipid deposition, energy used for maternal deposition, maternal BW, and ADG were analyzed using generalized linear mixed models whereby the linear predictor included parity group, period of gestation, and stage of gestation × parity as fixed effects, as well as the random effects of period nested within individual sow. So, the specified models recognized the individual female as the experimental unit for this study and week within female as the observational unit. Response variables were fitted assuming a normal distribution with heterogenous variance accounted for among parity groupings. The final models used for inference were fitted using restricted maximum likelihood estimation. Degrees of freedom were estimated using the Kenward–Rogers approach.
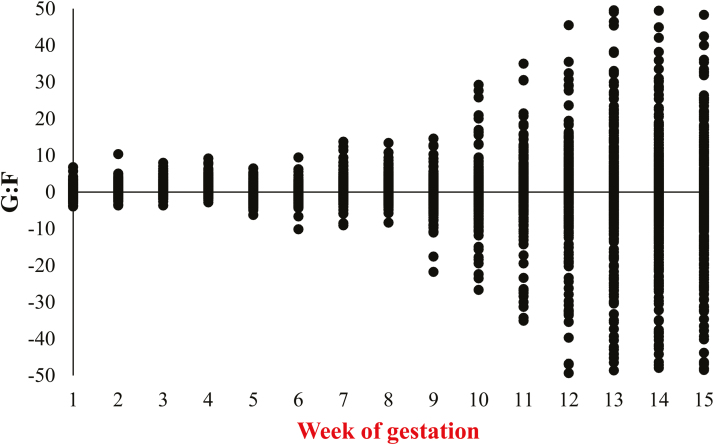
Maternal G:F was analyzed similarly; however, heterogenous variance across weeks was apparent with increasing variance as week of gestation increased (Figure 1). This is because as we move into late gestation, less energy is available for maternal growth, contributing to the increase in variability in G:F estimates. After evaluating studentized residual plots, heterogenous covariance structures were further considered for each parity group and the best model fit, based on a reduction on BIC, was antedependence of first-order heterogenous. When checking model assumptions, 50 out of 10,631 observations were found with large or small studentized residuals using a conservative Bonferroni-adjusted test. It was determined that these extreme values were a function of how the response variable, G:F, was generated, as a ratio of weight gain and energy used for maternal deposition. Although these values are within the expectation of a normal distribution given the empirical rule (nearly all of the data will fall within 3 standard deviations of the mean), the magnitude of these studentized residuals was a concern. Evaluation of the data set with and without these observations indicated that the means were unaffected, indicating they were not leading to bias in the mean estimates. However, variability was reduced when these 50 observations were excluded from the model. Thus, because the inference of the means was unaffected, the mean estimates and standard errors reported are based on the data set without these observations.
Figure 1.
Calculated G:F from weeks 1 to 15 of gestation. Values are from a total of 712 females (Camborough, PIC, Hendersonville, TN) that were used to determine G:F over time. The scatter plot indicates increasing heterogenous variance with increasing week of gestation.
Estimated means and corresponding standard errors (SEM) are reported for all least square means. Pairwise comparisons were conducted on such means using either Tukey–Kramer or Bonferroni adjustments, as appropriate in each case, to prevent inflation of Type I error due to multiple comparisons. Statistical models were fitted using the GLIMMIX procedure of SAS. Results were considered significant at P ≤ 0.05 and marginally significant at 0.05 < P ≤ 0.10.
RESULTS AND DISCUSSION
Descriptive Statistics
Descriptive statistics for predicted data is presented in Table 2. The average predicted pig birth weight was 1.3 kg ± 0.13 (mean ± SD) with a range of 1.0 to 1.9 kg. Our calculations are similar to those in the work of Quiniou (2014) whom reported an average pig birth weight of 1.38 kg for sows farrowing an average of 13.8 pigs per litter. Average final conceptus weight was predicted to be 29.9 kg ± 6.49 with a range from 2.0 to 50.5 kg. Previous research estimates the weight of conceptus calculated for 110 d of pregnancy and a litter size of 12 to be approximately 20 kg (Verstegen et al., 1987; Noblet et al. 1990). We expect our predictions of conceptus weight to be greater than 20 kg because the average total born from this herd is greater than 12 and the day of gestation in which weight of conceptus is reported is greater than day 110 of gestation. Thus, as litter size and gestation length increase, we expect conceptus weight to increase.
Table 2.
Descriptive statistics for predicted data
| Item | Mean | SD | Minimum | Maximum |
|---|---|---|---|---|
| Piglet birth weight, kg1 | 1.3 | 0.13 | 1.0 | 1.9 |
| Litter birth weight, kg2 | 19.5 | 3.00 | 1.9 | 25.6 |
| Final weight of conceptus, kg3 | 29.9 | 6.49 | 2.0 | 50.5 |
| Maternal weight gain, kg4 | 27.2 | 15.51 | −14.2 | 83.1 |
| Total lipid deposition, kg5 | 7.3 | 4.46 | −3.6 | 31.1 |
| Total protein deposition, kg6 | 4.0 | 0.58 | 2.6 | 5.9 |
Values from a total of 712 females (Camborough, PIC, Hendersonville, TN) are used to predict the above variables.
1Piglet birth weight (kg) = b – 0.035 × total born, n, where b for parities 1 and 2+ are 1.78 and 1.90.
2Litter birth weight (kg) = piglet birth weight kg × total born, n.
3Final weight of conceptus (day 114), kg = (((exp (8.621 − 21.02 × exp (−0.053 × gestation, d) + 0.114 × total born, n))/1,000) × (total born, n × average piglet birth weight, kg) / (exp {[9.095 – 17.69 exp (−0.0305 × 114) + 0.0878 × total born, n]}/1000)).
4Maternal weight gain, kg = (final gestation BW, kg – initial gestation BW, kg) – final weight of conceptus, kg.
5Total lipid deposition, kg = Sum of lipid deposition for each sow given by, (ERmf/ 39.7)/1000.
6Total protein deposition, kg = Sum of protein deposition for each sow given by, (ERmp/23.8)/1000.
Average predicted maternal BW gain was 27.2 kg ± 15.51 with a range from −14.2 to 83.1 kg. Previous research suggests that maternal weight gain is highly dependent on gestation feeding level and on the composition and the amount of previous lactation weight loss (Dourmad, 1999). Maternal weight gain is recommended to be between 20 and 25 kg of which 15 kg may be for development to mature BW, which is not achieved until the 4th or 5th parity (Verstegen et al., 1987; Noblet et al. 1990). Dourmad et al. (1996) investigated the effects of energy intake in gestation on changes in BW of multiparous sows reporting maternal weight gains of 25.6, 46.8, and 59.2 kg for low-, medium-, and high-energy diets. The diet fed in this study was comparable to the low and medium energy diets, and therefore, we expect maternal weight gains between 25.6 and 46.8 kg.
Predicted total lipid deposition averaged 7.3 kg ± 4.46 and ranged from −3.6 to 31.1 kg. This indicates in some females, feeding level exceeded body maintenance requirements, the demands of the conceptus, and protein deposition in the maternal body with the remaining energy deposited as lipid. In some cases, the opposite occurred and energy intake was insufficient to support all requirements, and as a result, maternal body lipid was mobilized and used as a source of energy. Total protein deposition averaged 4.0 kg ± 0.58 and ranged from 2.6 to 5.9 kg.
Predicted Weight of Conceptus
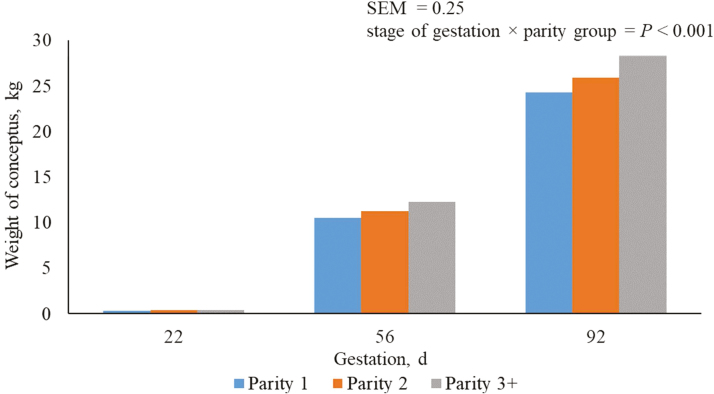
As expected, regardless of parity, conceptus weight increased (P < 0.05) in each subsequent period of gestation (Table 3). Differences between conceptus weight among parities started between days 40 and 74 of gestation and continued into the final period of gestation with parity 3+ sows having the heaviest (P < 0.05) conceptus weight and parity 1 sows having the lightest.
Table 3.
Predicted model parameters based on parity and stage of gestation
| Day of gestation, d | |||
|---|---|---|---|
| 5 to 39 | 40 to 74 | 75 to 109 | |
| Weight of conceptus, kg1 | |||
| Parity 1 | 0.4a ± 0.22 | 10.5bx ± 0.22 | 24.3cx ± 0.22 |
| Parity 2 | 0.4a ± 0.25 | 11.2bx ± 0.25 | 25.9cy ± 0.25 |
| Parity 3+ | 0.4a ± 0.21 | 12.3by ± 0.21 | 28.3cz ± 0.21 |
| Maintenance requirement, kcal2 | |||
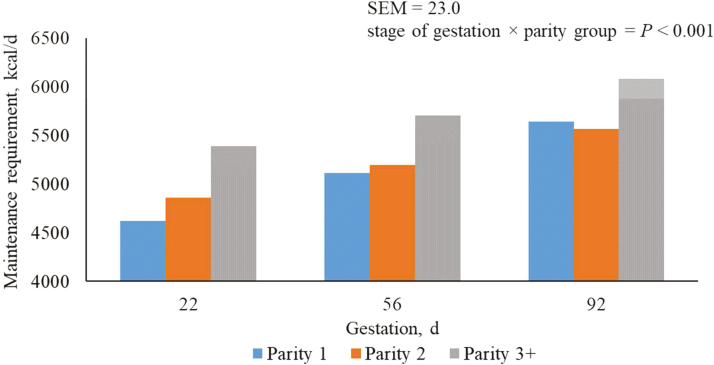
| Parity 1 | 4,620ax ± 20.0 | 5,114bx ± 20.0 | 5,640cx ± 20.0 |
| Parity 2 | 4,859ay ± 23.0 | 5,194by ± 23.0 | 5,563cy ± 23.0 |
| Parity 3+ | 5,387az ± 19.0 | 5,702bz ± 19.0 | 6,076cz ± 19.0 |
| Energy retention of conceptus, kcal3 | |||
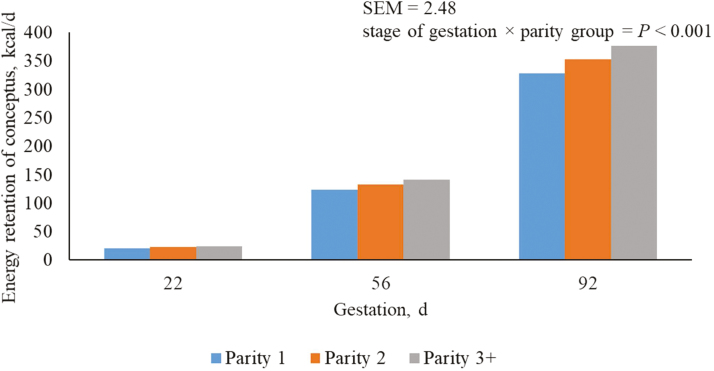
| Parity 1 | 20.5a ± 2.16 | 122.9bx± 2.16 | 328.3cx ±2.16 |
| Parity 2 | 22.4a ± 2.48 | 132.4by ± 2.48 | 352.9cy ± 2.48 |
| Parity 3+ | 23.7a ± 2.05 | 141.0bz ± 2.05 | 376.8cz ± 2.05 |
| Energy used for maternal protein deposition, kcal4 | |||
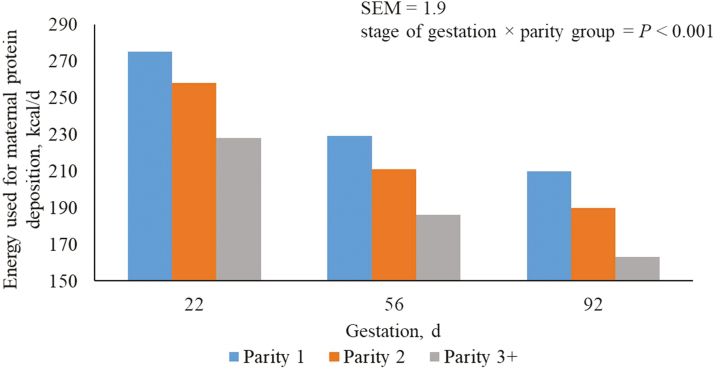
| Parity 1 | 275ax ± 1.6 | 229bx ± 1.6 | 210cx ±1.6 |
| Parity 2 | 258ay ± 1.9 | 211by ± 1.9 | 190cy ± 1.9 |
| Parity 3+ | 228az ± 1.6 | 186bz ± 1.6 | 163cz ± 1.6 |
| Maternal protein deposition, g5 | |||
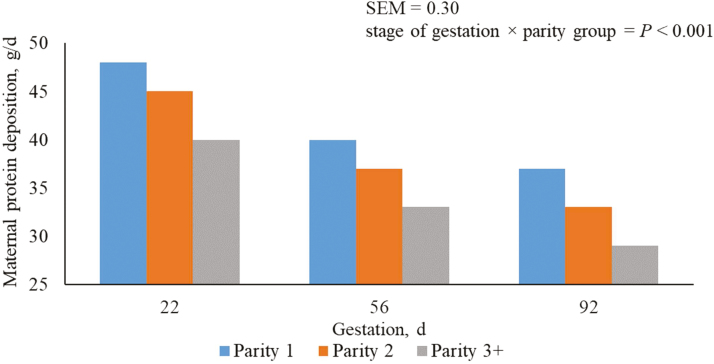
| Parity 1 | 48ax ± 0.3 | 40bx ± 0.3 | 37cx ± 0.3 |
| Parity 2 | 45ay ± 0.3 | 37by ± 0.3 | 33cy ± 0.3 |
| Parity 3+ | 40az ± 0.3 | 33bz ± 0.3 | 29cz ± 0.3 |
| Energy used for maternal lipid deposition, kcal6 | |||
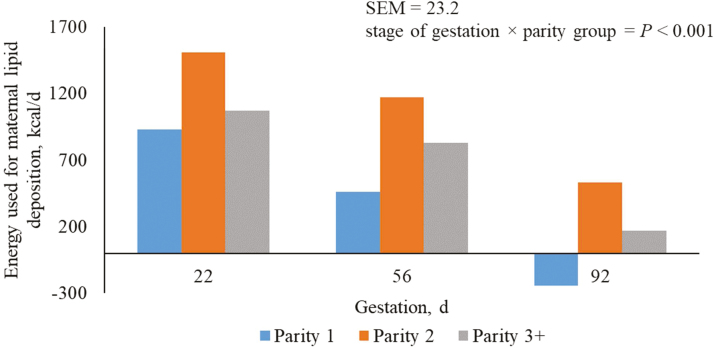
| Parity 1 | 928ax ± 20.2 | 463bx ± 20.2 | −244cx ± 20.2 |
| Parity 2 | 1,510ay ± 23.2 | 1,170by ± 23.2 | 531cy ± 23.2 |
| Parity 3+ | 1,070az ± 19.2 | 830bz ± 19.2 | 171cz ± 19.2 |
| Maternal lipid deposition, g7 | |||
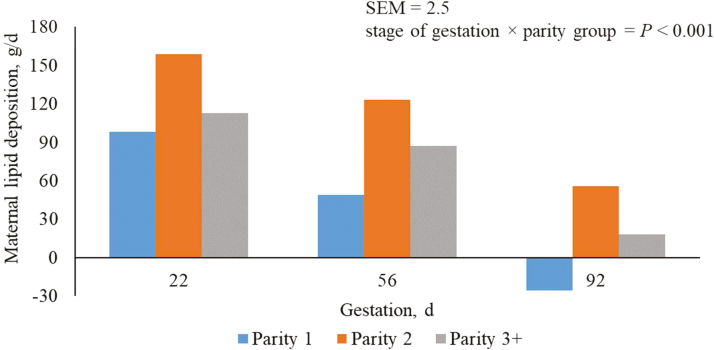
| Parity 1 | 98ay ± 2.1 | 49bx ± 2.1 | −26cx ± 2.1 |
| Parity 2 | 159ax ± 2.5 | 123by ± 2.5 | 56ay ± 2.5 |
| Parity 3+ | 113az ± 2.0 | 87by ± 2.0 | 18cx ± 2.0 |
A total of 712 females (Camborough, PIC, Hendersonville, TN) are used in a 108-d trial with 249, 188, and 275 females in parity groups 1, 2, and 3+. Values with different superscripts within a rowabcde or columnxyz differ, P < 0.05. The mean, per period of gestation, for each variable is reported.
1Weight of conceptus (kg/d) = Final conceptus weight at d 114 (kg) × % of final conceptus weight.
2Maintenance requirement (kcal/d) = (440 × BW0.75)/4.184.
3Energy retention of conceptus (kcal/d) = (Final energy content of conceptus at d 114 (kJ) × % of final energy content of conceptus)/4.184.
4Energy used for maternal protein deposition (kcal/d) = (23.8 × 6.25 × (NR – NRc))/4.184.
5Maternal protein deposition (g/d) = (ERmp/23.8).
6Energy used for maternal lipid deposition (kcal/d) = ((Intake, kJ/d – (MEm + ERc/kc + ERmp/kp)) × kf)/4.184.
7Maternal lipid deposition (g/d) = (ERmf/39.7).
Weight of conceptus is represented as a function of litter size, pig birth weight, and day of gestation. Fetal BW gain is low in early gestation, with nearly 60% of fetal growth occurring during the last 45 d of gestation (Noblet et al., 1990; Dourmad et al., 1999; Trottier and Johnston, 2001; Figure 2). The differences among parities for conceptus weights are likely attributed to differences in litter size and consequently litter weight. Average total born for parity 1, 2, and 3+ sows in this study is 14.8 ± 0.20, 14.2 ± 0.23, and 15.5 ± 0.19, respectively (Thomas et al., 2018). The average predicted litter weights in this study for parity 1, 2, and 3+ sows were 18.1 kg ± 2.50, 19.6 kg ± 3.24, and 20.74 kg ± 2.71, respectively. Research from the work of Smit et al. (2014) indicated that conceptus weight will increase as litter size increases not only due to fetal weight but due to an increase in placenta weight. Parity 3+ sows have the greatest total born and litter weight; thus, it is logical that conceptus weight is also greatest in comparison to other parity groups. Thomas et al. (2018) reported no evidence for differences between total born in parity groups 1 and 2; however, predicted litter birth weight is greater in parity 2 sows compared with parity 1 sows. Recall, the prediction equation used to estimate litter birth weight included 2 intercepts, one for parity 1 sows and another for parity 2+ sows, which is likely attributing to this discrepancy in litter birth weight and total born. In addition, difference in fetal and placenta weights may be causing these differences.
Figure 2.
Predicted weight of conceptus from days 5 to 112 of gestation for parity 1, 2, and 3+ sows. A total of 712 females (Camborough, PIC, Hendersonville, TN) were used in a 108-d trial with 249, 188, and 275 females in parity groups 1, 2, and 3+.
Predicted Maintenance Requirement
Regardless of parity, maintenance requirements increased (P < 0.05) in each sequential period of gestation (Table 3). Regardless of period of gestation, parity 3+ sows had the greatest (P < 0.05) maintenance requirement compared with parity 2 and 1 sows. The maintenance requirement for parity 2 sows was greater (P < 0.05) than parity 1 sows from days 5 to 74; however, from days 75 to 109 of gestation, parity 1 sows had a greater (P < 0.05) maintenance requirement.
Female maintenance requirement represents the amount of dietary energy and essential nutrients required to maintain BW and composition (de Lange et al., 2000). In this study, nutrient requirements for maintenance were determined based on sow BW. Older, heavier sows have increased nutrient needs and require more feed to maintain their body than younger, lighter sows. Thomas et al. (2018) reported parity 1 sows used in this study had greater BW following day 75 of gestation compared with parity 2 sows. This is reflective in sow maintenance requirements following day 75 of gestation when parity 1 sow requirements were greater than parity 2 sows (Figure 3).
Figure 3.
Predicted maintenance requirement per day of gestation from days 5 to 112 for parity 1, 2, and 3+ sows. A total of 712 females (Camborough, PIC, Hendersonville, TN) were used in a 108-d trial with 249, 188, and 275 females in parity groups 1, 2, and 3+.
Predicted Energy Retention of the Conceptus
Regardless of parity, energy retention of the conceptus increased (P < 0.05) in each sequential period of gestation (Table 3). There was evidence for differences among parity groups for the period between 40 and 74 d of gestation at which time parity 3+ sows had the greatest (P < 0.05) energy retention of the conceptus. From days 75 to 109 of gestation, energy retention of the conceptus was greatest (P < 0.05) for parity 3+ sows, followed by parity 2 and 1 sows (Figure 4).
Figure 4.
Predicted energy retention of conceptus (kcal/d) from days 5 to 112 of gestation for parity 1, 2, and 3+ sows. A total of 712 females (Camborough, PIC, Hendersonville, TN) were used in a 108-d trial with 249, 188, and 275 females in parity groups 1, 2, and 3+.
Similar to weight of conceptus, energy retention of the conceptus was determined as a function of litter size, birth weight, and day of gestation. Sows from this study were offered energy intakes ranging from 6,450 to 7,418 kcal ME daily which is within the range proposed by Noblet et al. (1990) for adequate energy intake to meet the demands of the conceptus. Previous research indicates that the growth of the products of conceptus and the associated nutrients needed for that growth are fairly resistant to nutritional manipulations with changes in fetal weight being very small if any (Noblet et al., 1985; Noblet et al., 1990; Dourmad et al., 1996). Only in cases of extreme reductions in nutrient intake in which 12% of backfat loss occurs will the performance of the offspring be affected.
Predicted Energy Used for Maternal Protein Deposition
Regardless of parity group, the predicted energy used for maternal protein deposition decreased (P < 0.05) in each subsequent period of gestation (Table 3). Regardless of period of gestation, parity 1 sows had the greatest (P < 0.05) energy use for maternal protein deposition followed by parity 2 and 3+ sows. Due to the method of calculation, conclusions for predictions for maternal protein deposition into maternal tissue are the same as those reported for energy used for protein deposition (Table 3).
As previously elucidated, the distribution of nutrients is not constant throughout gestation (Ji et al., 2005; Moehn and Ball, 2013). Nitrogen retention in early gestation is mainly of maternal origin because retention in the products of conceptus amounts to only a very small amount, but in mid to late gestation, the metabolic focus shifts to fetal growth which advances at a very rapid rate (Dourmad et al., 1996; McPherson et al., 2004; Dourmad et al., 2008). This explains the reduction in energy used for maternal protein deposition (Figure 5), and subsequently maternal protein deposition (Figure 6) through gestation and the increase observed in the energy retention of the conceptus.
Figure 5.
Predicted energy used for maternal protein deposition (kcal/d) from days 5 to 112 of gestation for parity 1, 2, and 3+ sows. A total of 712 females (Camborough, PIC, Hendersonville, TN) were used in a 108-d trial with 249, 188, and 275 females in parity groups 1, 2, and 3+.
Figure 6.
Predicted maternal protein deposition (g/d) from days 5 to 112 of gestation for parity 1, 2, and 3+ sows. A total of 712 females (Camborough, PIC, Hendersonville, TN) were used in a 108-d trial with 249, 188, and 275 females in parity groups 1, 2, and 3+.
Previous literature indicates that for a given energy supply, protein retention is generally greater in gilts than in multiparous sows which may be partly explained by the low energy requirement for maintenance in relation to their lower BW (Dourmad et al., 1999). In our study, parity 1 sows (gilts) had increased maternal protein deposition throughout gestation in comparison with multiparous sows despite being fed less than multiparous sows. Thomas et al. (2018) observed that from days 5 to 74 of gestation, parity 1 sows used in this study were lighter in comparison with parity 2 and 3+ sows, but at some point, from days 75 to 109 of gestation parity 1 sow, BW was greater than parity 2+ sows. This difference may be attributed to the method used to predict whole body N retention where coefficients were different for parity 1 and 2+ sows (0.571 vs. 0.366) as a result of parity 1 sows being more efficient at protein deposition in comparison to older parity sows.
Predicted Energy Used for Maternal Lipid Deposition
Regardless of parity, the amount of energy used for maternal lipid deposition decreased (P < 0.05) in each subsequent period of gestation (Table 3). Parity 2 sows had the greatest (P < 0.05) energy used for maternal lipid deposition in each period of gestation, followed by parity 3+ and 1 sows. Due to the method of calculation, conclusions for predictions for maternal lipid deposition into maternal tissue are the same as those reported for energy used for lipid deposition (Table 3).
The decrease in energy used for maternal lipid deposition (Figure 7), and the subsequent amount of maternal lipid deposition (Figure 8), as pregnancy increases may be attributed to the reduction in ME per unit metabolic BW as females from this production system were offered the same allowance of feed throughout the course of gestation. In parity 1 sows during late pregnancy (days 75 to 109 of gestation), feed intake was insufficient to prevent mobilization of body fat and maternal lipid reserves was reduced by 26 g/d.
Figure 7.
Predicted energy used for maternal lipid deposition (kcal/d) from days 5 to 112 of gestation for parity 1, 2, and 3+ sows. A total of 712 females (Camborough, PIC, Hendersonville, TN) were used in a 108-d trial with 249, 188, and 275 females in parity groups 1, 2, and 3+.
Figure 8.
Predicted maternal lipid deposition (g/d) from days 5 to 112 of gestation for parity 1, 2, and 3+ sows. A total of 712 females (Camborough, PIC, Hendersonville, TN) were used in a 108-d trial with 249, 188, and 275 females in parity groups 1, 2, and 3+.
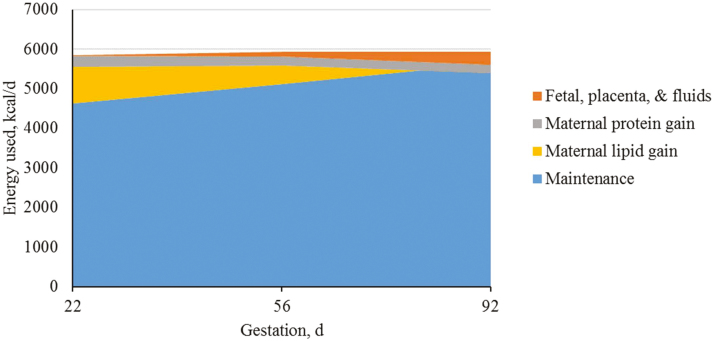
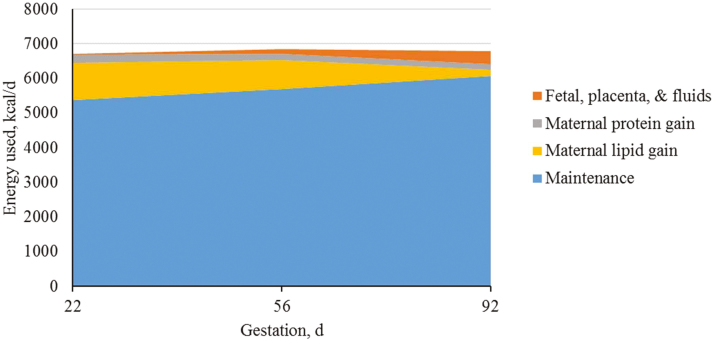
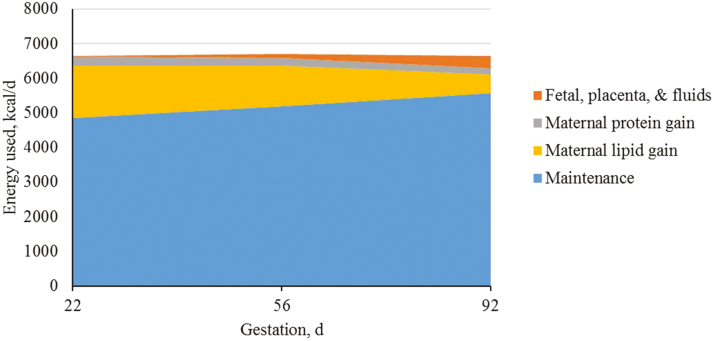
After dividing energy requirements into tissue pools for maintenance, growth (maternal protein and fat deposition), and products of conceptus (fetal, placenta, and fluids), it is clear that the greatest portion of the energy requirement is for maintenance and maternal growth (Figures 9–11). Each tissue pool is affected by differences throughout gestation and parity group as described above.
Figure 9.
Predicted energy use (kcal/d) for parity 1 sows (kcal/d) during gestation based on different body tissues. A total of 712 females (Camborough, PIC, Hendersonville, TN) were used in a 108-d trial with 249 females represented in parity group 1.
Figure 11.
Predicted energy use (kcal/d) for parity 3+ sows (kcal/d) during gestation based on different body tissues. A total of 712 females (Camborough, PIC, Hendersonville, TN) were used in a 108-d trial with 275 females represented in parity group 3+.
Figure 10.
Predicted energy use (kcal/d) for parity 2 sows during gestation based on different body tissues. A total of 712 females (Camborough, PIC, Hendersonville, TN) were used in a 108-d trial with 188 females represented in parity group 2.
Predicted Maternal Growth and Feed Efficiency
Regardless of parity group, the energy used for maternal protein and lipid deposition decreased (P < 0.05) in each subsequent period of gestation (Table 4). This reduction in energy used for maternal protein and lipid deposition as the female progresses through gestation can be attributed to increasing maintenance requirements and demands of the conceptus. Parity 2 sows had the greatest (P < 0.05) energy used for maternal protein and lipid deposition, regardless of period, followed by parity 3+ and 1 sows which can be attributed to feed intake levels.
Table 4.
Maternal growth and feed efficiency of gestating sows as influenced by parity and stage of gestation
| Day of gestation, d | |||
|---|---|---|---|
| 5 to 39 | 40 to 74 | 75 to 109 | |
| Energy used for maternal protein and lipid deposition, kcal1 | |||
| Parity 1 | 1,203ax ± 21.7 | 692bx ± 21.7 | −35cx ± 21.7 |
| Parity 2 | 1,767ay ± 24.9 | 1,380by ± 24.9 | 721cy ± 24.9 |
| Parity 3+ | 1,298az ± 20.6 | 1,016bz ± 20.6 | 334cz ± 20.6 |
| BW, kg1 | |||
| Parity 1 | 154.8ax ± 0.94 | 167.1bx ± 0.94 | 178.1cx ± 0.94 |
| Parity 2 | 165.5ay ± 1.09 | 170.1bx ± 1.09 | 172.8by ± 1.09 |
| Parity 3+ | 190.0az ± 0.90 | 193.2bz ± 0.90 | 195.3bz ± 0.90 |
| ADG, kg1 | |||
| Parity 1 | 0.47ax ± 0.011 | 0.27bx± 0.011 | 0.41cx ±0.011 |
| Parity 2 | 0.32ay ± 0.013 | 0.04by ± 0.013 | 0.15cy ± 0.013 |
| Parity 3+ | 0.23az ± 0.011 | −0.04bz ± 0.011 | 0.34cz ± 0.011 |
| G:F2 | |||
| Parity 1 | 1.12ax± 0.038 | 0.71bx ± 0.062 | −2.17cx ± 0.481 |
| Parity 2 | 0.67ay ± 0.030 | 0.04by ± 0.042 | 0.62ay ± 0.079 |
| Parity 3+ | 0.73ay ± 0.032 | −0.16bz ± 0.046 | 0.04bz ± 0.157 |
A total of 712 females (Camborough, PIC, Hendersonville, TN) are used in a 108-d trial with 249, 188, and 275 females in parity groups 1, 2, and 3+. Values with different superscripts within a rowabcde or columnxyz differ, P < 0.05.
1Values represent the mean, per period of gestation.
2Values represent the median per period of gestation.
Maternal BW increased (P < 0.05) in each sequential period of gestation for parity 1 sows (Table 4). In parity 2 and 3+ sows, maternal BW increased (P < 0.05) from days 40 to 74 of gestation; however, there was no evidence (P > 0.05) for differences in maternal BW from days 75 to 109 of gestation. Maternal BW was greatest (P < 0.05) for parity 3+ sows. From days 5 to 39 of gestation, parity 2 sow maternal BW was greater (P < 0.05) than parity 1 sows with no evidence for differences between the 2 parity groups from days 40 to 74 of gestation. From days 75 to 109 of gestation, parity 1 sow maternal BW was greater (P < 0.05) compared with parity 2 sows.
Regardless of parity group, maternal ADG decreased (P < 0.05) in the period from days 40 to 74 of gestation and increased (P < 0.05) from days 75 to 109 of gestation (Table 4). Maternal ADG was greater (P < 0.05) for parity 1 sows compared with parity 2 or 3+ sows in all gestation periods. Parity 2 sow maternal ADG was greater (P < 0.05) than parity 3+ sows from days 5 to 74 of gestation.
In early to mid-gestation, nutrients are used primarily to support maternal growth. Following day 70 of gestation, the metabolic focus shifts to the growing demands of the conceptus (McPherson et al., 2004, Ji et al., 2006). Our findings are similar but maternal ADG starts to decrease before day 70 of gestation. For parity 1 sows, maternal ADG was highest in early gestation and decreased following day 40 of gestation. Regardless of parity, maternal ADG increases in late gestation, when we would expect the rates of maternal deposition to be the lowest as fetal growth is greatest during this time. We hypothesize that mammary gland development may have resulted in this increase in maternal ADG from days 75 to 109 of gestation. Maternal ADG in parity 1 sows was greater than parity 2 and 3+ sows in all phases of gestation, but ADG of parity 2 sows was only greater than parity 3+ sows from days 5 to 74 of gestation.
In parity 1 sows, maternal G:F was reduced (P < 0.05) in each subsequent period of gestation, resulting in a negative value from days 75 to 109 of gestation (Table 4). Parity 1 sow maternal G:F was greater (P < 0.05) than parity 2 and 3+ sows from days 5 to 74 of gestation but lowest (P < 0.05) from days 75 to 109 of gestation. For parity 2 and 3+ sows, maternal G:F was reduced (P < 0.05) from days 40 to 74 of gestation but improved (P < 0.05) from days 75 to 109. Parity 2 sow maternal G:F was greater (P < 0.05) than parity 3+ sows from days 40 to 109 of gestation.
To the best of our knowledge, a G:F calculation in gestation has not been previously reported. Sow research is limited in the gestation barn as obtaining sow ADFI and ADG values can be a challenge. New gestation feeding systems (electronic sow feeders [ESF]) are allowing for numerous research opportunities that will allow researchers to collect data like that collected in this study. As provided herein, using female ADFI and ADG allowed us to partition nutrient requirements and acquire an understanding of female metabolic status upon entry into farrowing house. Determining maternal ADG and maternal G:F further our knowledge of the gestating female and the differences that exist among parity groups and how they change with stage of gestation.
CONCLUSION
From the existing data, it is apparent that sow gestation nutrient requirements are affected largely by requirements of the female for maintenance and maternal protein and lipid deposition, each of which is heavily influenced by parity and stage of gestation. Through the partitioning of each of these tissue pools, predictions indicate that even though parity 1 sows are in a negative energy balance late in pregnancy, maternal ADG and G:F are greater in most gestation periods compared with parity 2 and 3+ sows. Further research is needed to investigate these differences and if there is an impact on subsequent performance.
Footnotes
Contribution no. 18-250-J from the Kansas Agric. Exp. Stn., Manhattan, 66506-0210.
We would like to thank Thomas Livestock Company, Broken Bow, NE, for providing the animals and research facilities and to Tim Friedel, Steve Horton, and Jose Hernandez for technical assistance as well as Tim Kurbis, New Standard US, Inc. (Sioux Falls, SD).
LITERATURE CITED
- Close W. H., J. Noblet, and Heavens R. P.. 1985. Studies on the energy metabolism of the pregnant sow. 2. The partition and utilization of metabolizable energy intake in pregnant and non-pregnant animals. Br. J. Nutr. 53:267–279. doi: 10.1079.BJN19850034 [DOI] [PubMed] [Google Scholar]
- Dourmad J. Y., M. Etienne, and Noblet J.. 1996. Reconstitution of body reserves in multiparous sows during pregnancy: effect of energy intake during pregnancy and mobilization during the previous lactation. J. Anim. Sci. 74:2211–2219. doi: 10.2527/1996.7492211x [DOI] [PubMed] [Google Scholar]
- Dourmad J. Y., Etienne M., Valancogne A., Dubois S., van Milgen J., and Noblet J.. 2008. InraPorc: A model and decision support tool for the nutrition of sows. Anim. Feed Sci. Technol. 143:372–386. doi: 10.1016/j.anifeedsci.2007.05.019 [Google Scholar]
- Dourmad J. Y., Noblet J., Pere M. C., and Etienne M.. 1999. Mating, pregnancy and prenatal growth. In: I., Kyriazakis, editor, Quantitative biology of the pig. CABI Publishing, Wallingford, UK: p. 129–152. [Google Scholar]
- Everts H. 1994. Nitrogen and energy metabolism of sows during several reproductive cycles in relation to nitrogen intake. PhD thesis, Wageningen Agricultural Univ, The Netherlands. [Google Scholar]
- Everts H., and Dekker R. A.. 1994. Effect of nitrogen supply on the excretion of nitrogen and on energy metabolism of pregnant sows. Anim. Prod. 59:293–302. doi: 10.1017/S0003356100007972 [Google Scholar]
- Gonçalves M. A., K. M. Gourley S. S. Dritz M. D. Tokach N. M. Bello J. M. DeRouchey J. C. Woodworth, and Goodband R. D.. 2016. Effects of amino acids and energy intake during late gestation of high-performing gilts and sows on litter and reproductive performance under commercial conditions. J. Anim. Sci. 94:1993–2003. doi: 10.2527/jas.2015-0087 [DOI] [PubMed] [Google Scholar]
- Ji F., G. Wu J. R. Blanton Jr, and Kim S. W.. 2005. Changes in weight and composition in various tissues of pregnant gilts and their nutritional implications. J. Anim. Sci. 83:366–375. doi: 10.2527/2005.832366x [DOI] [PubMed] [Google Scholar]
- de Lange C. F. M., Birkett S. H., and Morel P. C. H.. 2000. Protein, fat, and bone tissue growth in swine. In: A. J., Lewis L. L., Southern, editors, Swine nutrition. CRC press, Boca Raton, Florida: p. 65–81. [Google Scholar]
- McPherson R. L., F. Ji G. Wu J. R. Blanton Jr, and Kim S. W.. 2004. Growth and compositional changes of fetal tissues in pigs. J. Anim. Sci. 82:2534–2540. doi: 10.2527/2004.8292534x [DOI] [PubMed] [Google Scholar]
- Moehn S., and Ball R. O.. 2013. Nutrition of pregnancy sows. In: Proc. of 2013 London Swine Conf, Managing for production, London, Ontario: p. 55–65. [Google Scholar]
- Noblet J., W. H. Close R. P. Heavens, and Brown D.. 1985. Studies on the energy metabolism of the pregnant sow. 1. Uterus and mammary tissue development. Br. J. Nutr. 53:251–265. doi: 10.1079/BJN19850034 [DOI] [PubMed] [Google Scholar]
- Noblet J., J. Y. Dourmad, and Etienne M.. 1990. Energy utilization in pregnant and lactating sows: modeling of energy requirements. J. Anim. Sci. 68:562–572. doi: 10.2527/1990.682562x [DOI] [PubMed] [Google Scholar]
- Noblet J., and Etienne M.. 1987b. Metabolic utilization of energy and maintenance requirements in pregnant sows. Livest. Prod. Sci. 16:243–257. doi: 10.1016/0301-6226(87)90042-X [DOI] [PubMed] [Google Scholar]
- NRC 2012. Nutrient requirements of swine. 11th ed Natl. Acad. Press, Washington, DC. [Google Scholar]
- Quiniou N. 2014. Feeding the high potential sow: implementation of some key concepts. IFIP Institut du Porc. Le Rheu cedex, France: 1:57–68. [Google Scholar]
- Smit M. N., Spencer J. D., Patterson J. L., Dyck M. K., Dixon W. T., and Foxcroft G. R.. 2014. Effects of dietary enrichment with marine oil-based n-3 LCPUFA supplement in sows with predicted birth weight phenotypes on birth litter quality and growth performance to weaning. Animal. 10.1017: 1–10. doi: 10.1017/S1751731114002390 [DOI] [PubMed] [Google Scholar]
- Stroup W. W. 2013. Treatment and explanatory variable structure. In: A. J., Lewis L. L, editors. Generalized Linear Mixed Models. CRC press, Boca Raton, Florida: p. 209. [Google Scholar]
- Thomas L. L., Goodband R. D., Tokach M. D., Woodworth J. C., DeRouchey J. M., and Dritz S. S.. 2018. Effect of parity and stage of gestation on growth and feed efficiency of gestating sows. J. Anim. Sci. 96:4327–4338. [DOI] [PMC free article] [PubMed] [Google Scholar]
- Trottier N. L., and Johnston L. J.. 2001. Feeding gilts during development and sows during gestation and lactation. In: A. J. Austin and L. L. Southern, editors, Swine nutrition. CRC Press, Washington, DC: p. 725–769. [Google Scholar]
- Verstegen M. W. A., Verhagen J. M. F., and den Hartog L. A.. 1987. Energy requirements of pigs during pregnancy: a review. Livest. Prod. Sci. 16:75–89. doi: 10.1016/ 0301-6226(87)90028-5 [Google Scholar]


