Abstract
Haematopoietic stem cells drive blood production, but their population size and lifetime dynamics have not been directly quantified in humans. We identified 129,582 spontaneous, genome-wide somatic mutations in 140 single-cell–derived haematopoietic stem and progenitor colonies from a normal 59 year-old man and applied population genetics approaches to reconstruct clonal dynamics. Cell divisions from early embryogenesis were evident in the phylogenetic tree, with all blood deriving from a common ancestor that preceded gastrulation. Stem cell population size grew steadily in early life, reaching a stable plateau by adolescence. We estimate numbers of haematopoietic stem cells actively making white blood cells at any one time to be in the range 50,000-200,000. We observed adult haematopoietic stem cell clones that generate multilineage output, including granulocytes and B lymphocytes. Harnessing naturally occurring mutations to report an organ’s clonal architecture provides high-resolution reconstruction of somatic cell dynamics in humans.
Introduction
Human haematopoiesis balances the production and destruction of hundreds of billions of specialised blood cells every day. This process relies upon a multi-layered hierarchy of progressively more differentiated and more populous cells, at the top of which sits the pool of stem cells. First described functionally in the 1960s1,2, haematopoietic stem cells are defined by their ability to establish long-term, stable contributions to multiple lineages of blood cells, including myeloid, T and B cells. The numbers and dynamics of stem cells in homeostatic human haematopoiesis remain poorly defined, despite their routine use in therapeutic transplantation for haematological disease.
Historical studies in animals quantified haematopoiesis either by labelling cells in vitro and transplanting them into a recipient animal3–6 or by modelling X chromosome inactivation patterns7. More recently, studies tracking the clonal contributions of cells labelled directly in vivo8–10 have suggested that long-term homeostatic haematopoiesis is driven by many thousands of cells that do not function as classical stem cells in transplantation assays11.
Approaches to measuring stem cell dynamics and potential in humans have been less direct. Studies of X-chromosome inactivation patterns in haematological malignancies demonstrated their clonal origin in stem cells that had multilineage potential12,13. In patients receiving gene therapy, hundreds to thousands of clones contribute to lymphoid and myeloid lineages more than a year after transplantation14,15. Studies of unperturbed haematopoiesis in humans have relied on ex vivo cellular assays16 or modelling of telomere lengths17 and X chromosome inactivation patterns18. These analyses have suggested that numbers of stem cells increase through childhood and adolescence, reaching a plateau in adulthood, with some shift in lineage potential.
Using spontaneous somatic mutations to reconstruct human haematopoiesis
Mutations accumulate in somatic cells throughout life19,20. A mutation arising in a cell is inherited by its descendant cells, a feature that has enabled reconstruction of clonal structures in cancer21 and normal development22,23. In normal blood stem cells, the burden of somatic mutations increases linearly with age20, suggesting that they represent an accurate molecular clock.
We hypothesised that spontaneous somatic mutations could act as clonal markers enabling quantification of the number, activity and longevity of human blood stem cells during normal haematopoiesis. Analogous to capture-recapture experiments in Ecology, our design followed two phases (Figure 1). First, in the ‘capture’ phase, we isolated single haematopoietic stem and progenitor cells24 from a bone marrow aspirate and peripheral blood draw from a 59 year-old male with normal blood counts and no past history of blood disorders (Extended Figure 1). These were expanded in single cell liquid cultures or colony-forming cell (CFC) assays. We performed whole genome sequencing on 198 colonies, each to ~15x depth (Table S1), and identified somatic mutations. Second, in the ‘recapture’ phase, we isolated bulk populations of mature peripheral blood cells from the same individual: granulocytes at three timepoints after the bone marrow aspirate, together with B and T lymphocytes, both from one timepoint. We performed deep targeted sequencing on these bulk populations for mutations discovered in the capture phase.
Figure 1. Experimental design.
The experiment proceeded in two phases: a ‘capture’ phase, in which single haematopoietic stem and progenitor cells were expanded in vitro and whole genome sequenced, and a ‘recapture’ phase, in which bulk populations of differentiated cells were deep sequenced for mutations identified in the capture phase. HSC, haematopoietic stem cell; HPC, haematopoietic progenitor cell; FACS, fluorescence activated cell sorting.
Bringing together stem cell biology and population genetics creates a risk of lexical confusion. We reserve the term ‘clone’ for the in vivo descendants of a single ancestral cell; and use ‘colony’ to describe the cells derived in vitro from a single stem or progenitor cell. We use ‘lineage’ to denote a specific functional group of blood cells, such as granulocytes; and ‘line-of-descent’ for the set of cells that are direct antecedents/descendants of the cell in question (glossary in Technical Supplement).
Mutation burden and spectrum
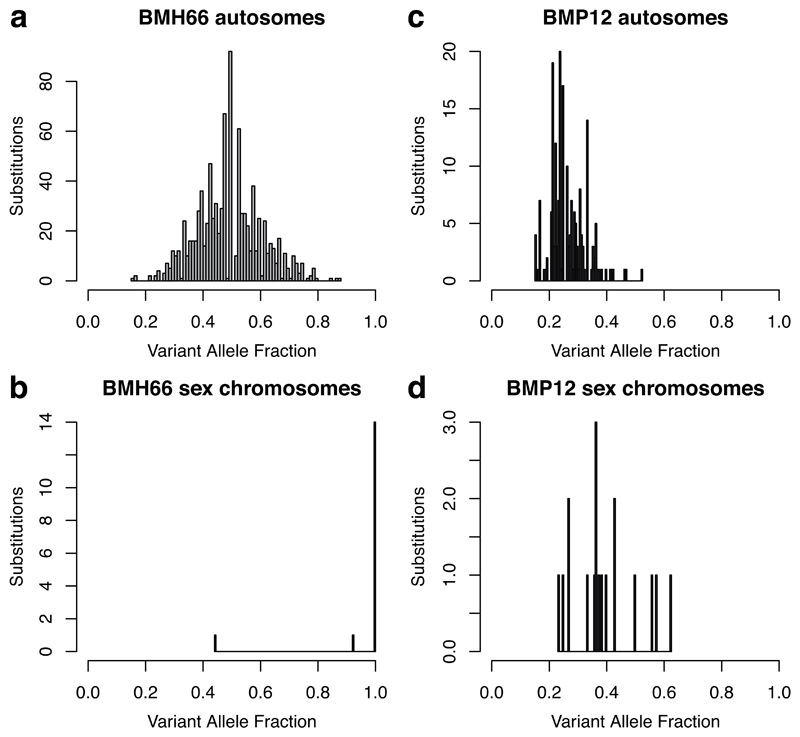
140 colonies had variant allele fractions (VAFs) distributed around 50%, confirming they did in fact derive from a single cell, but 58 of the colonies had lower allele fractions (Extended Figure 2, Table S1), most likely due to colonies growing into each other in methylcellulose. These polyclonal colonies were excluded from further analyses. It proved more difficult to derive clonal colonies from some progenitor types than others, such that our final set of 140 colonies was composed of 89 immunophenotypic haematopoietic stem cells, 38 megakaryocyte-erythrocyte progenitors, eight granulocyte-macrophage progenitors, and five common myeloid progenitors.
We assessed whether variants were acquired during in vitro expansion. Any mutation on the X chromosome in the original colony-forming cell should be present at allele fractions near 100%. Reassuringly, the mean percentage of X chromosome mutations found on <50% reads was only 5.6% per colony, suggesting that variants acquired in vitro were infrequent.
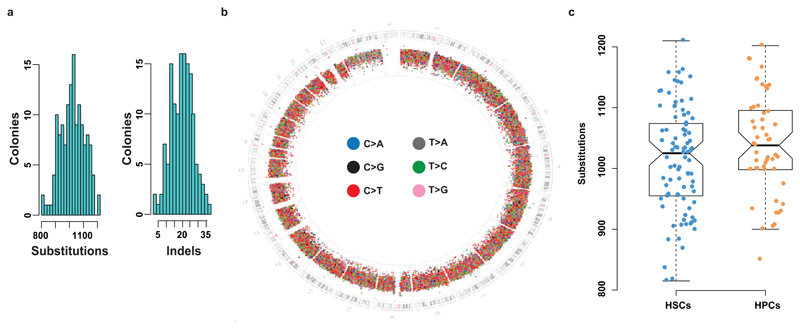
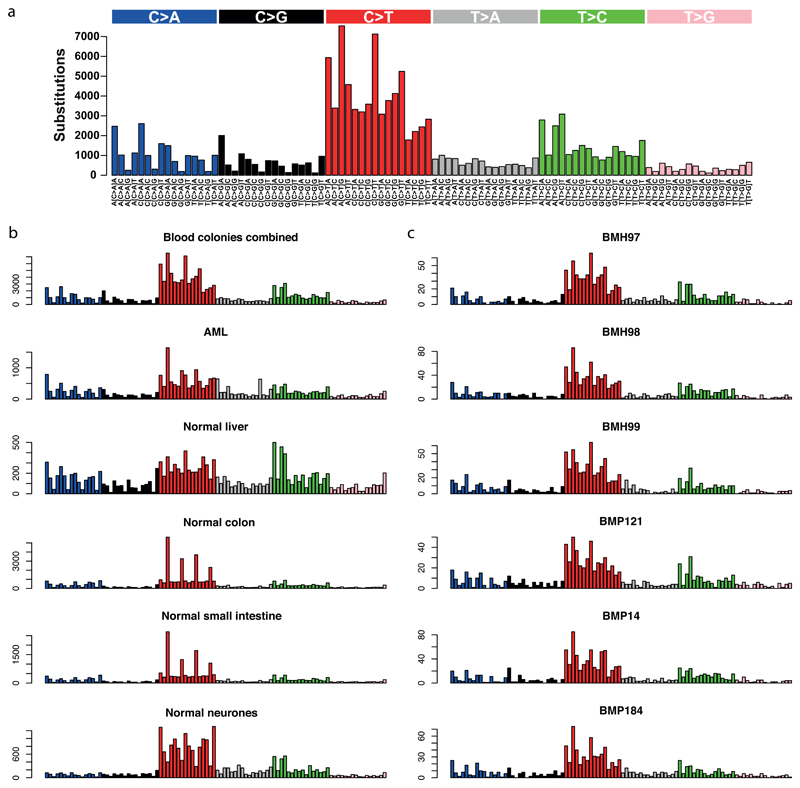
Mutation burden was consistent across colonies, with a mean of 1023 substitutions (range, 815-1210) and 20 small insertion/deletion events (range 2-37) (Extended Figure 3). No somatically acquired structural variants were identified. The spectrum of mutations was dominated by C>T and T>C transitions, as described in myeloid cancers20 and age-related clonal haematopoiesis25 (Extended Figure 4).
Driver mutations in myeloid cancer genes occur in some older individuals with normal blood counts26–28. In our subject’s colonies, we found no known myeloid driver mutations. Furthermore, the ratio of non-synonymous to synonymous mutations, a metric that can detect positive or negative clonal selection across genes29, was exactly that expected for the background mutation spectrum (dN/dS 1.001; CI95% 0.889-1.127; with dN/dS=1 representing neutrality). Finally, driver mutation hotspots were included in the bait-set for the recapture phase (Table S2), and no such drivers were detected. Thus, haematopoietic cells in this subject have undergone selectively neutral accumulation of somatic mutations.
Somatic mutations acquired during embryonic development
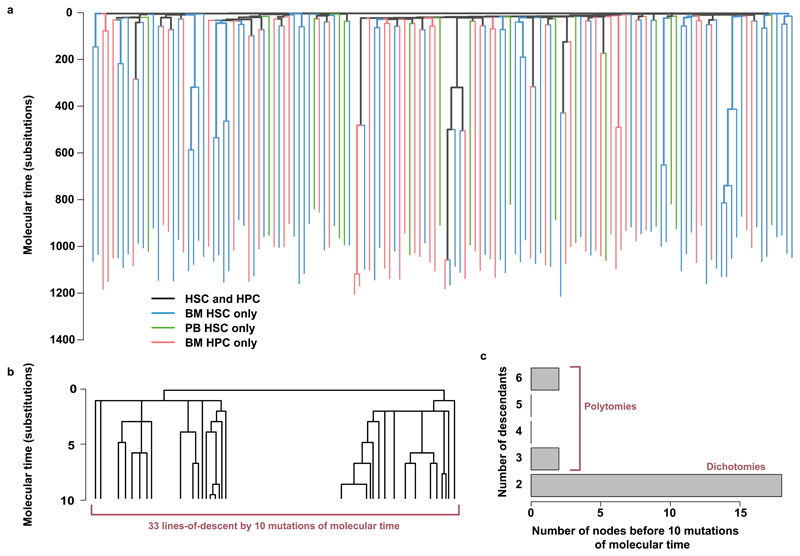
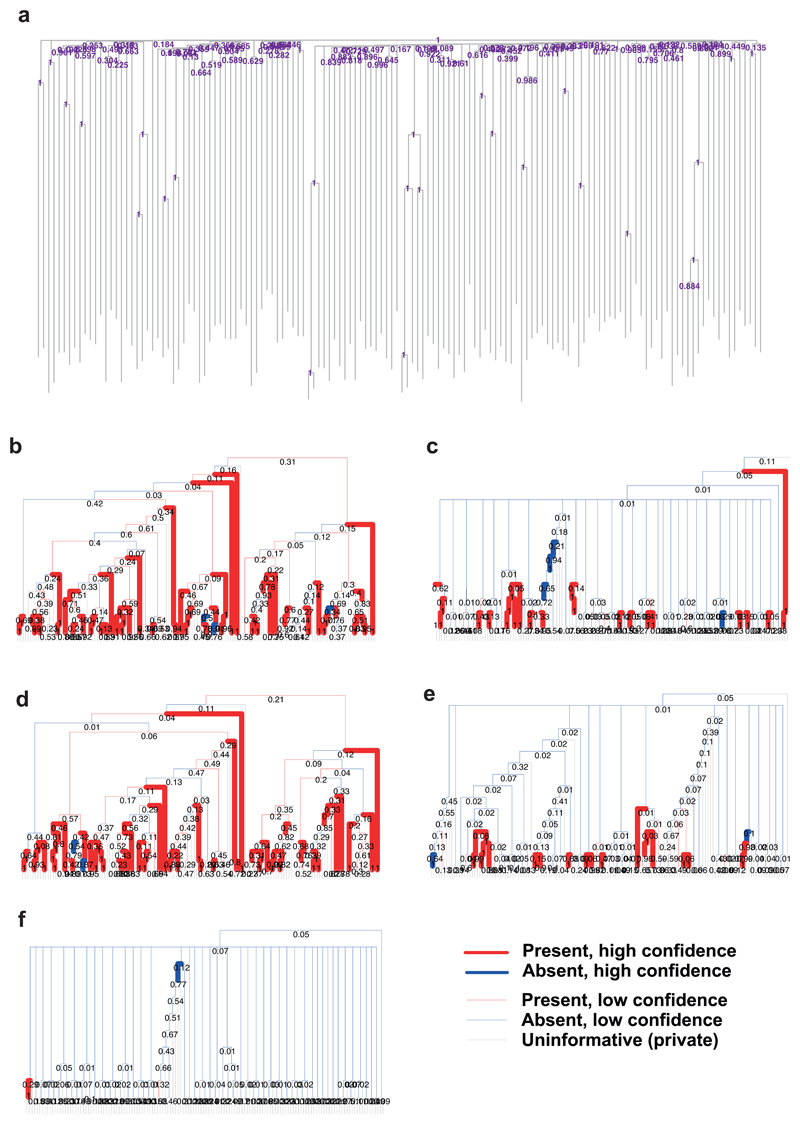
To explore clonal relationships among the 140 colonies, we constructed a phylogenetic tree (Figure 2; Extended Figures 5-6). Of the 129,582 somatic substitutions placed on the tree, 8,676 were seen in more than one colony. At the top of the tree, two mutations completely partitioned the colonies, one found in 52 and the other in 88 colonies, with every colony possessing one or other mutation, and no colony possessing both (Figure 2B). These same two mutations were found in a buccal swab taken from the patient, and at clonal contributions that suggested the same two thirds to one third split. This indicates that the most recent common ancestor of all blood cells in this subject was also the most recent common ancestor of buccal epithelial cells. Since blood derives from mesoderm and buccal epithelium from ectoderm, this common ancestor must have predated gastrulation. It is likely that this most recent common ancestor of both blood and buccal epithelium was in fact the fertilised egg: the two observed mutations would have occurred during its first cell division, one to each daughter cell. These two daughter cells then contributed unequally to adult somatic tissues, as previously observed22,30,31.
Figure 2. The phylogeny of cells, showing the relationship between cell types, and embryological cell divisions.
(a), phylogeny of 140 single haematopoietic stem and progenitor cells showing the relationship between cell types. At each tip of the tree is a colony. Branches connect colonies to each other to form a family tree. Branch lengths are proportional to the number of somatic mutations. Branches are coloured according to the phenotype of their descendants. Branches ancestral to haematopoietic progenitor cells (HPCs) are coloured red, branches ancestral to bone marrow-derived haematopoietic stem cells (BM HSCs) blue, and branches ancestral to peripheral blood-derived haematopoietic stem cells (PB HSCs) green. Branches ancestral to both stem and progenitor cells are coloured black. (b) the same phylogeny as in figure 2a, but showing only the first 10 mutations of molecular time. (c) the number of descendants of each node for the first 10 mutations of molecular time, used to estimate the embryonic mutation rate.
Beneath the first division, a cascade of further mutations provides ever finer partitions of the colonies (Figure 2B), consistent with data in mice that adult haematopoiesis is a mosaic of embryonic clones32. By 10 mutations of molecular time, 33 lines-of-descent were created, which required at least 5 generations of cell doublings. Embryonic lineages that are lost or unobserved would imply more than 5 generations, so average mutation rates in early embryogenesis could be ~2/division at most. Of the 32 cell divisions by 10 mutations in molecular time, at least 10 were associated with no mutations (Figure 2C), noting that unobserved embryonic lineages can convert polytomies (multi-way splits) to dichotomies. This provides an estimate of mutation rate of 1.2/division (Methods). Thus, mutation rates in embryonic cells that ultimately contribute to somatogenesis fall in the range 1-2 per cell division, similar to estimates from human neural progenitor clones23 and de novo germline mutations33.
Clonal relationships of haematopoietic stem and progenitor cells
Clonal relationships among the 140 colonies were evident beyond the early embryonic mutations as a series of branch-points scattered down the vertical axis of the phylogenetic tree (Figure 2A). Mutations shared between two colonies imply they derive from a common ancestor, with the ratio of shared to unique mutations a measure of the age at which the two lines-of-descent split. Long lines-of-descent with few branches implies that we have sequenced only a small fraction of the stem cell pool.
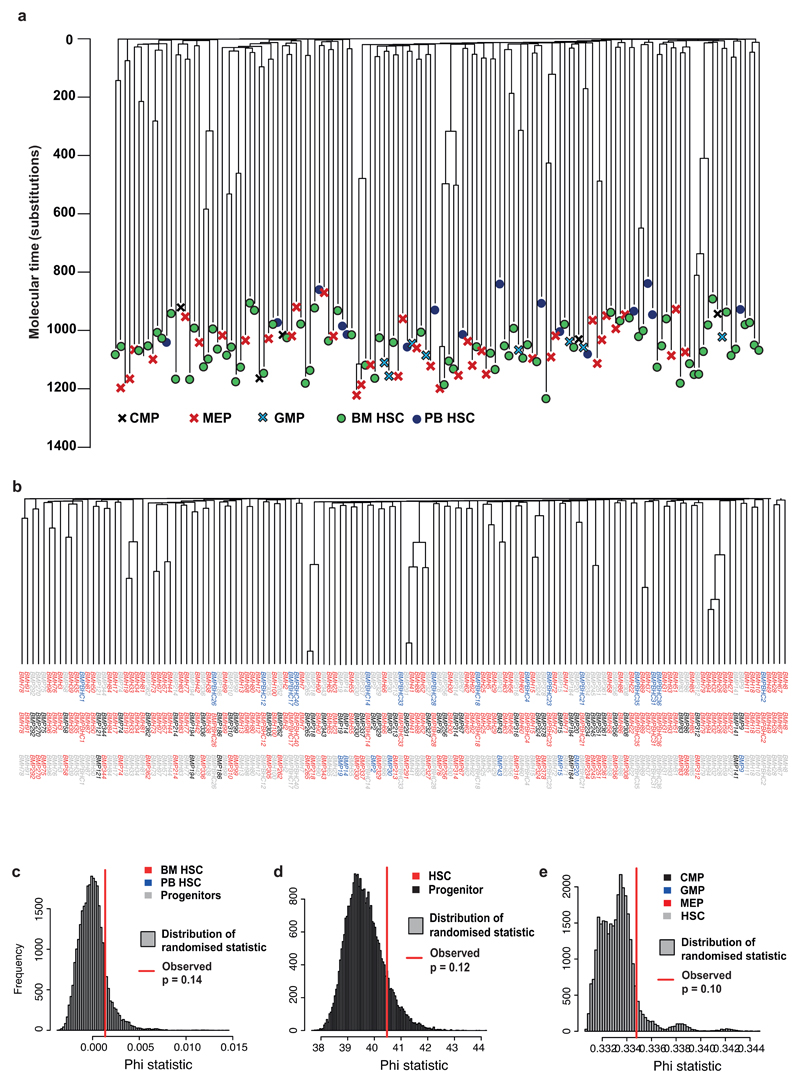
The distribution of different cell types across the tree provides information on population stratification among haematopoietic stem and progenitor cells. Stem cells from the marrow aspirate, taken from the right iliac crest, were no more clustered together on the phylogenetic tree than those derived from peripheral blood (p=0.14; Figure 2; Extended Figure 3A). This suggests that stem cells recirculate and redistribute sufficiently often that the population in the iliac crest is a random sample of the whole-body stem cell pool. Similarly, progenitors were not more clustered on the tree than stem cells (p=0.12; Extended Figure 3B-C), suggesting the progenitors we sequenced are not drawn from a more restricted set of historic lines-of-descent than the stem cells.
The interspersed distribution of stem and progenitor cells on the tree and relative paucity of recent branch-points implies that the phylogeny is dominated by events that occurred in stem cells. As a progenitor is short-lived, only the most recent mutations in its line-of-descent will have occurred while it was a progenitor. Therefore, a branch-point hundreds of mutations ago represents an ancient symmetrical division in which one stem cell gave rise to two stem cells, since descendants of both daughters persist decades later as haematopoietic cells. In traditional experimental models, long-term self-renewal of haematopoietic stem cells is established prospectively (through serial transplantation assays) whereas here we infer it retrospectively, through the decades-long persistence of lines-of-descent from an ancestral stem cell division. For the analyses that follow, therefore, which rely on mutations distributed across the tree, we need not distinguish whether the colony sequenced derived from a stem or progenitor cell.
Lifetime trajectory of stem cell population size
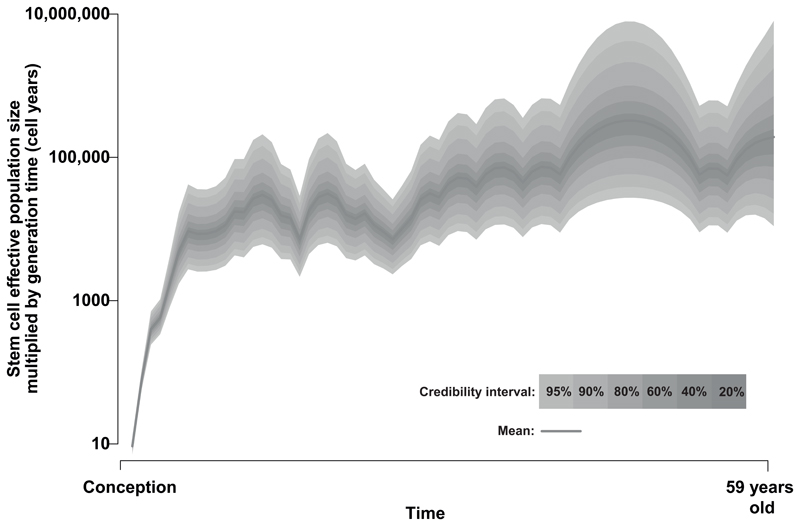
The relative timings of branch-points, or more formally ‘coalescences’, in the phylogenetic tree inform on historical population dynamics. Briefly, under neutral drift, the rate at which lines-of-descent coalesce is related to both the effective population size and the generation time (here, time between symmetric stem cell divisions). Methods to infer historic population dynamics from coalescences34 were applied to the tree built from our subject’s blood cells. This revealed a rapid population expansion of haematopoietic stem cells during early life, reaching a relatively stable plateau by late childhood/early adolescence (Figure 3), consistent with previous inferences17,18. The stable population size during adulthood suggests that symmetric self-renewal divisions, where one stem cell divides into two stem cells, are balanced by stem cell death, senescence and symmetric divisions into committed progenitors.
Figure 3. Population size trajectory of stem cell pool.
Phylodynamic methods reveal changes in the effective population size of stem cells over life based on the timing of coalescences (branch-points) in our observed phylogeny. Shading illustrates different credibility intervals. The y axis is shown in units of ‘population size multiplied by generation time’ (cell-years) because the same distribution of coalescences can be generated from a population of 10 times the size with 10 times as many generations.
The same broad coalescence structure of the phylogenetic tree that arises with a given population size and number of generations can be generated by a population ten times larger going through ten times as many generations. Therefore, from the structure of the tree alone, without knowing how many generations the cells have been through, we cannot directly estimate the absolute number of stem cells. We therefore performed deep sequencing of blood cells in the ‘recapture’ phase of our study.
Estimates of stem cell number and generation time from deep sequencing
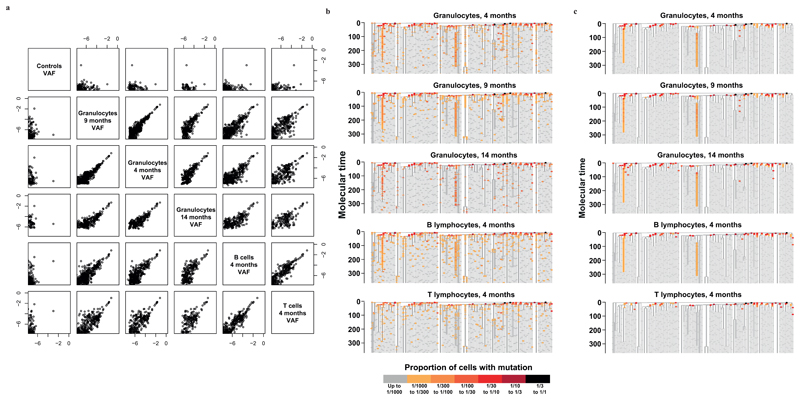
We designed a hybridisation bait-set for 7116 mutations identified in the colonies and assigned to the phylogenetic tree, choosing 6317 mutations shared by more than one colony and 799 unique to single colonies. We performed targeted sequencing of three peripheral blood granulocyte samples taken 4 months (mean coverage 776x), 9 months (mean coverage 4669x), and 14 months (mean coverage 268x) after the bone marrow aspirate, together with control cord blood from two individuals (mean coverage 5305x) (Table S3). We used Bayesian generalised linear mixed models to estimate the fraction of reads derived from true mutant alleles versus sequencing errors. Reassuringly, estimated allele fractions were stable across the three time-points and steadily decreased down individual lines-of-descent (Extended Figure 8).
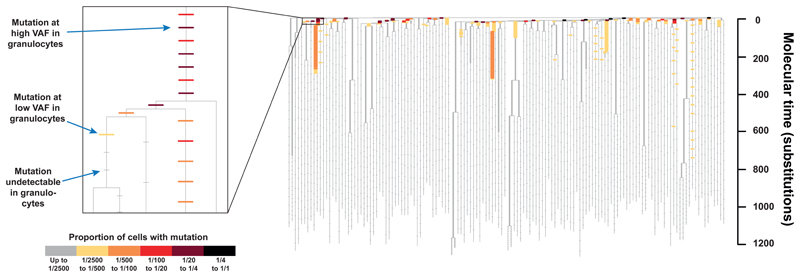
Three observations emerge (Figure 4). First, the majority of mutations in the bait-set were not detectable (horizontal grey ticks in Figure 4). This suggests that the number of active stem cells in our subject must be much higher than a few thousand, since our detection threshold was typically down to ~1/2000. Second, most branches at the top of the phylogenetic tree have mutations that can be detected in granulocytes. This implies that many stem cells not closely related to each other actively contribute to haematopoiesis in the investigated time period. If only one or a few stem cells produce granulocytes, replaced over time as they exhaust, we would expect only the branches of the currently active stem cells to be detectable in granulocytes. Third, some branches contribute more to haematopoiesis than most, evidenced as a handful of branches with mutations detectable much further down the tree than average (although still representing a relatively small proportion: <0.6% of granulocytes). Assuming that no undiscovered driver mutations are present, this would be a consequence of genetic drift.
Figure 4. ‘Recapture’ of mutations by targeted sequencing.
The phylogenetic tree of cells is shown as in Figure 2, but information from targeted sequencing of peripheral blood granulocytes from the 9 month time-point is overlaid. This is shown more clearly in the inset, which zooms in on a portion of the tree. The underlying structure of the tree is shown in grey. On top are placed horizontal bars, one for every mutation in the bait-set for targeted sequencing. Bars are coloured according the proportion of cells in the sample that carry the mutations (obtained by multiplying the variant allele fraction for autosomal mutations by two), indicated in the colour scale. Undetectable mutations are coloured grey and shown as smaller bars. Mutations have been spaced evenly along a branch according to their mean variant allele fraction from targeted sequencing of all granulocyte and lymphocyte time-points combined. A higher density of baits were designed for branches shared by more than one colony. On these branches the mutations are so close together that they can appear as one continuous bar.
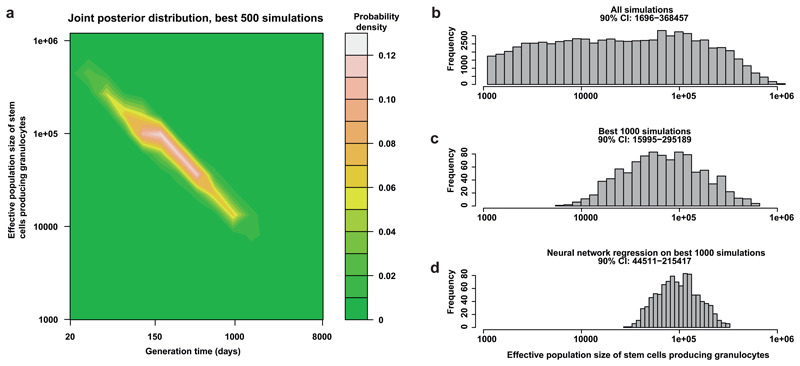
We developed an approximate Bayesian computation framework to quantify key properties of the stem cell compartment (Methods; Technical Supplement). Briefly, we generated 200,000 simulations of neutral haematopoiesis in adulthood (Figure 5), varying the number of stem cells and the time between successive stem cell renewal divisions. Assumptions were: all active stem cells have equal probability of dividing per unit time; size of this pool is constant over adulthood; all active stem cells produce similar numbers of granulocytes; and stem cells accumulate somatic mutations stochastically. We then recapitulated our experimental design on each simulation in silico. Using informative summary statistics, we compared the properties of the simulations to the observed data, looking for the combinations of stem cell numbers and symmetrical cell division rate that could most closely replicate the observed data.
Figure 5. Approximate Bayesian computation (ABC) of the number of stem cells and their replication rate.
(a) A contour plot of the most likely values for stem cell numbers and time between symmetrical stem cell divisions over the sample space that was simulated. It shows the stem cell number and generation times of the 500 simulations that produced summary statistics that were most similar to the summary statistics extracted from the observed data. (b) The prior distribution for the number of stem cells contributing to granulocytes for the second ABC (i.e. the stem cell numbers for all 80,000 simulations). (c) The distribution of stem cell numbers for the 1000 simulations that produced summary statistics most similar to the observed summary statistics. (d) The posterior distribution of a neural network regression run on these 1000 simulations. The 90% credibility interval is quoted for the stem cell population in each of (b)-(d).
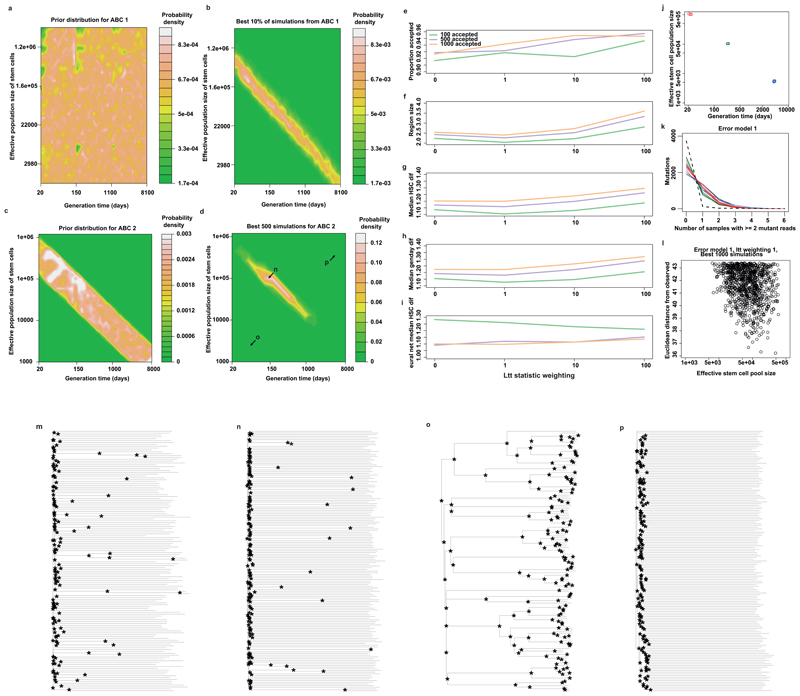
Under our model, the 90% credibility interval for the number of stem cells actively contributing to circulating granulocytes at one time was 44,000-215,000 (Figure 5; Extended Figure 7). Furthermore, the estimated time between successive self-renewal stem cell divisions is most credibly in the range of 2-20 months. Simulations within this range (Extended Figure 7n) most closely resembled our observed data (Extended figure 7m), whereas simulations from outside the plausible ridge showed marked differences (Extended Figure 7o-p). We note the uncertainties in these estimates, which could be improved by investigating more subjects; more stratified sampling (cells from spleen, thymus and other regions of bone marrow); sequencing more colonies in the ‘capture’ phase (we now know that our 140 colonies represent only one thousandth of the active stem cell pool); and increasing the sensitivity of mutation detection in the ‘recapture’ phase.
Clonal contributions to granulocytes and lymphocytes
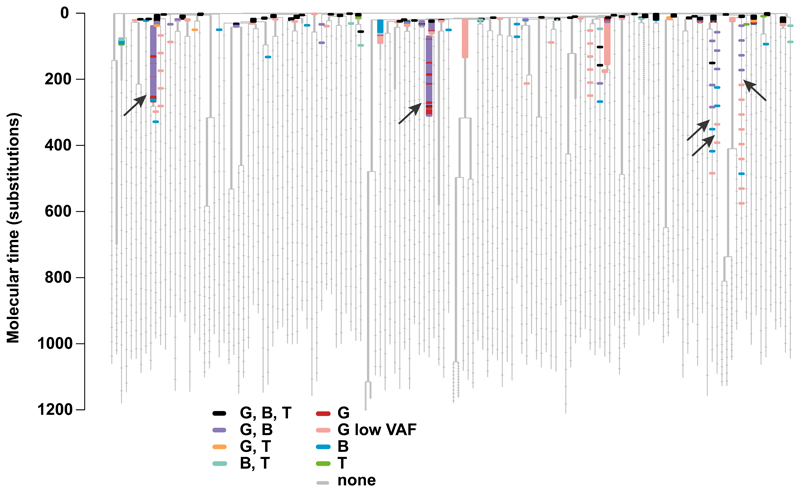
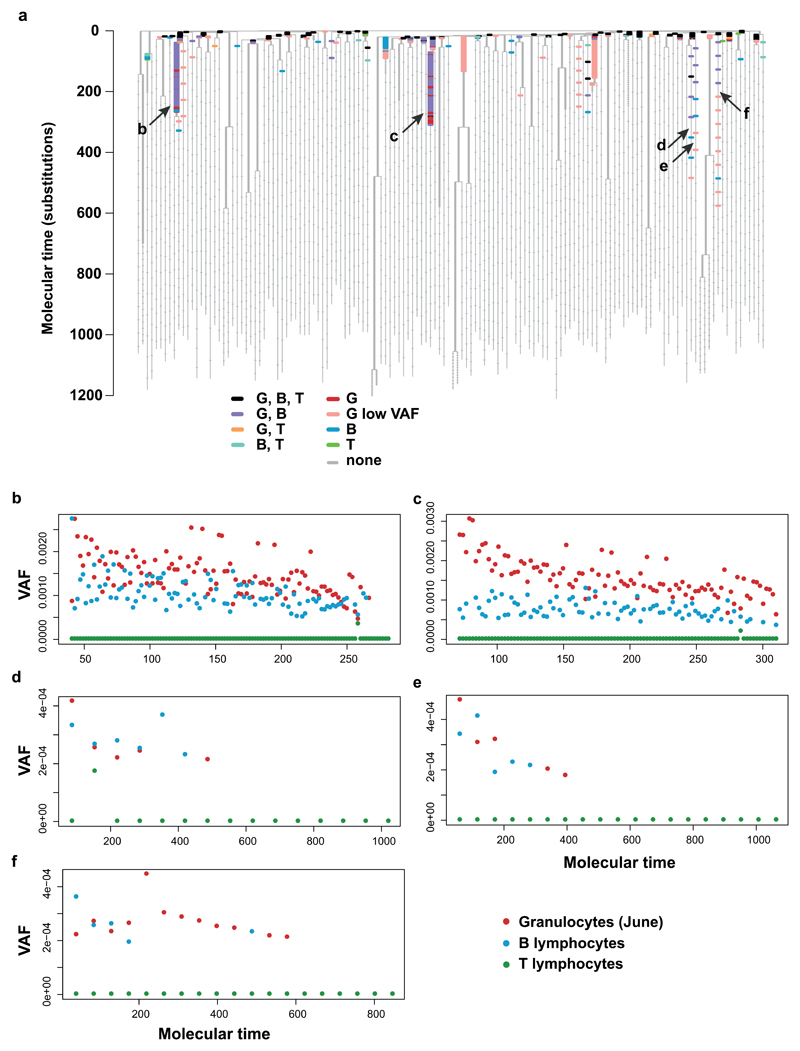
One of the defining features of a stem cell is its contribution to multiple cell types. Alongside granulocytes, we deep-sequenced samples of peripheral blood B and T lymphocytes (Figure 6, Extended Figure 9). Most of the early mutations, at the top of the phylogenetic tree, were detectable in all cell types investigated (black branches in Figure 6), implying a shared common ancestry of lymphocytes and granulocytes during development. Beyond 100 mutations in molecular time, when population size reached a plateau (Figure 3), 464 mutations distributed across 39 branches could be detected, of which 217 on 12 branches were detected in more than one cell type.
Figure 6. Targeted sequencing of granulocyte and lymphocyte samples.
The phylogeny is depicted as in Figure 4, with the underlying structure of the tree shown in grey, and horizontal bars drawn to represent every mutation in the bait-set. Here the colouring of mutations reflects which peripheral blood cell fractions they could be detected in, as indicated by the colour key. Two colours are used for granulocytes: red for mutations only detected in granulocytes that were are at a sufficiently high allele fraction to have been found in the shallower lymphocyte sequencing data and pink for mutations that were only detected in granulocytes, but at such a low allele fraction (<1/2000 reads) that if they had been present in lymphocytes at this allele fraction they would not have been detected. Arrows indicate adult clones with multilineage output. G, granulocytes; B, B lymphocytes; T, T lymphocytes.
Some adult stem cell clones contributed to detectable numbers of granulocytes and B lymphocytes, but their mutations were not detectable in T lymphocytes (Extended Figure 9b-f). We had equivalent sequencing coverage in B and T lymphocytes, so the discrepancy is not technical. This finding implies that descendants of these particular stem cell lines contribute a higher fraction of currently produced granulocytes and B cells than T cells. Due to the low fraction of stem cells sequenced in the ‘capture’ phase, we cannot exclude the existence of stem cell lines that currently contribute to all three cell types, as found in age-related clonal haematopoiesis35.
Conclusions
The mosaic contribution of many embryonic clones to haematopoiesis and the large number of clones active in adulthood accords well with lineage-marking studies in mice8,9,32. We estimate that the number of stem cells contributing to unperturbed human haematopoiesis at any given time is most likely in the hundreds of thousands and the time between symmetric stem cell divisions to fall in the range of 2-20 months, very similar to previous inferences18.
We demonstrate the existence of adult human stem cell clones with multilineage output in vivo. Branches with mutations detectable in granulocytes and B lymphocytes exist beyond 300 mutations of molecular time, which would represent our subject’s late teens or early twenties. The similar allele fractions in B cells and granulocytes suggest on-going contribution of these stem cell lines to the two cell types. The key principle here is that under neutral dynamics, the drift of these branches to an appreciable proportion of granulopoiesis would have been gradual. If myeloid and B lymphocyte lineages separated early in life and underwent genetic drift independently, then we would not expect the exact same lines-of-descent to become enriched in both populations. Instead, the parsimonious explanation is that the pool of haematopoietic stem cells contributes to myeloid and B lymphocyte populations throughout life, such that the same genetic drift emerges in both lineages.
In contrast, we do not observe shared mutations between granulocytes and T lymphocytes much beyond 100 mutations of molecular time. Several possible explanations for this include a deeper separation between myeloid and T cell production36 than between myeloid and B cells; a large and long-lived pool of T lymphocytes that dilute any on-going contribution to T lymphopoiesis from recent stem cells; or a lower number of stem cells actively contributing to T lymphopoiesis, requiring more than the 140 colonies sequenced here to uncover their contribution.
The 40 trillion cells in the human body all trace their ancestry back through a series of cell divisions to the fertilised egg. All of these cells can be visualised on a single phylogenetic tree with the fertilised egg at its root. Establishing the exact position of any given cell on this tree requires a unique and permanent mark stamped on each cell with each division. Somatic mutations provide such a mark. Layering phenotypic information, be it transcriptional state, lineage output or functional resilience, on the phylogeny will enable estimation of the heritability from mother cell to daughter cell of germane somatic phenotypes. Humans can be directly researched, the ubiquity and permanence of somatic mutations enabling studies through youth and old age, in steady state and after perturbation, across blood and other organs, in health and disease.
Extended Data
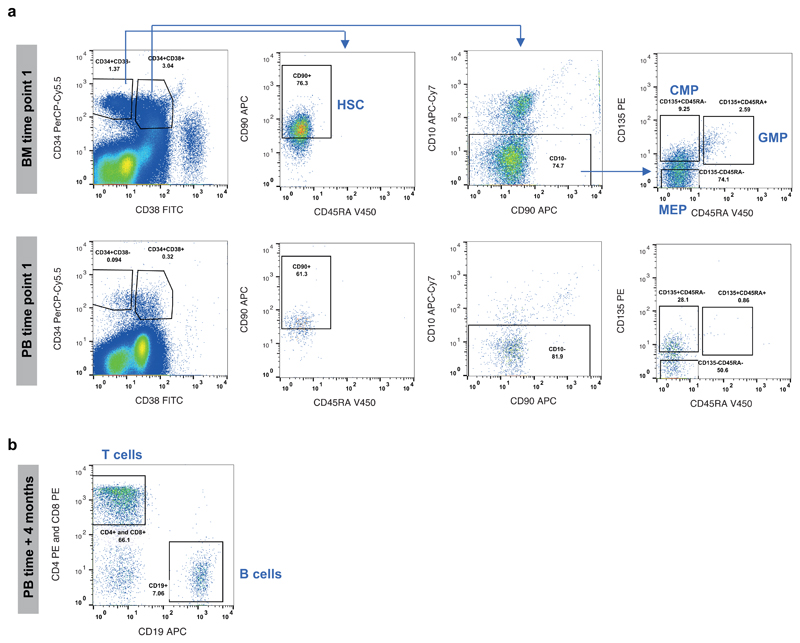
Extended Figure 1. Cell sorting strategy.
(a) Sorting of stem and progenitor cells. Human bone marrow (BM) and peripheral blood (PB) mononuclear cells (time point 1) were stained with anti-CD34, anti-CD38, anti-CD45RA, anti-CD90, anti-CD10 and anti-CD135 antibodies. After exclusion of debris and doublets, gating on CD34, CD38 and CD90 were used to separate CD34+CD38-CD90+CD45RA-‘HSCs’. The CD34+CD38+ compartment was gated for CD10- cells before gating on CD135 (Flt3) and CD45RA to separate progenitor compartments: CD135+CD45RA ‘CMPs’, CD135+CD45RA+ ‘GMPs’ and CD135-CD45RA- ‘MEPs’. (b) sorting of B and T lymphocytes. PB mononuclear cells (time point +4 months) were stained with anti-CD4, anti-CD8 and anti-CD19 antibodies. After exclusion of debris and doublets, the CD4+CD8+CD19- gate was used to isolate T cells, while CD4-CD8-CD19+ gate was used to isolate B cells. (20,000 events shown). MEP: Megakaryocyte Erythrocyte Progenitor; CMP: Common Myeloid Progenitor; GMP: Granulocyte Macrophage Progenitor; HSC: Haematopoietic Stem Cell.
Extended Figure 2. Quality control of colonies as single-cell derived.
Example histograms of the variant allele fraction (VAF – the proportion of sequencing reads that report the mutation) of mutations in single colonies. (a) The VAF of all mutations on autosomes in a typical clonal colony. As there are two copies of each autosome, and each mutation occurs on only one of them, in a clonal sample the VAF of autosomal mutations is binomially distributed with mean 0.5. (b) The VAF of all mutations on the X chromosome in the same clonal colony. As our subject is male, there is only one copy of the X chromosome, and so true mutations here must have a VAF of 1. Occasionally, lower VAFs are seen due to the failure to detect a mutation on a read, or a read from another locus being aberrantly mapped to the locus in question and lowering the apparent coverage, or a mutation acquired in vitro. (c) and (d) show the VAF of autosomal and X chromosome mutations, respectively, in a typical colony seeded by more than one cell. As not all the reads come from the same cell, and most mutations are private to a given cell, a lower proportion of DNA molecules carry the mutation in a polyclonal colony than in a clonal colony, resulting in a leftward shift of the peak of the VAF histogram. These histograms suggest that the number of mutations acquired by the colonies in a few weeks of in vitro expansion is a small fraction of those acquired in vivo over 60 years of life.
Extended Figure 3. Mutation burden of colonies.
(a) A histogram of substitution (left hand panel) and indel (right hand panel) burden per colony. (b) The location around the genome of substitutions from all clones combined is shown as a circos plot. The outermost ring of the circos plot depicts the karyotypic ideogram. Moving inwards, base substitutions are shown as rainfall plots where the height of the dot in the substitution ring is proportional to log10 of the distance to the next mutation and with the colour of the dot illustrating the base change, as shown in the key. (c) a comparison of the substitution burden between stem cells (HSCs) and progenitor cells (HPCs). There were not significantly more mutations in progenitors than stem cells (p=0.14, Wilcoxon Rank Sum test).
Extended Figure 4. Trinucleotide context of mutations in normal blood colonies.
(a) The trinucleotide context of substitutions from all colonies combined. Substitutions can be classed according to the base change (referred to by the pyrimidine of the mutated base pair), and the bases 5’ and 3’ of the mutated one, into 96 categories. The counts in each of these categories is shown. (b) comparison with pooled acute myeloid leukaemia genomes, excluding genomes with >1500 mutations, and publicly available data on normal tissues that have been whole genome sequenced so far. The ordering of bars is the same as in panel a, and the same figure as in panel a is provided again at the same resolution for ease of comparison. Please note that these samples have been sequenced on different platforms using different systems, which is likely to result in small differences. Normal liver, normal colon, and normal small intestine were whole genome sequencing of single-cell derived organoids19, whereas normal neurones were derived from single cells that had undergone whole genome amplification37. (c) Example trinucleotide substitution plots for a selection of individual colonies derived from either stem cells (which have the prefix “BMH”) or progenitor cells (which have the prefix “BMP”). The ordering of bars is the same as in panel a.
Extended Figure 5. Construction of the phylogeny using different methods.
(a) The phylogeny of cells as presented in figures 2, 4, and 6, but with the addition of p values next to every node, derived by bootstrapping the substitution matrix 1000 times, building a tree using SCITE for each replicate, and counting the proportion of the bootstrapped trees that support each node. (b)-(f) Phylogenies constructed using different datasets and methods. In each case the phylogeny was constructed using 100 bootstraps of the data, and the p value for each node shown underneath it. Branches are coloured by whether a branch ancestral to exactly the same descendants is also present in the SCITE tree, and are drawn with a thicker line if the branch is recovered in >=70% of bootstrap replicates. (b) Substitution and indel datasets combined, building the tree by maximum parsimony. (c) Substitution, indel, and neighbour joining datsets combined, building the tree by neighbour joining. (d) Substitutions, tree build by maximum parsimony. (e) Indels, tree built by maximum parsimony. (f) Short tandem repeats, tree built by neighbour joining.
Extended Figure 6. Relationship between cell types in phylogeny.
(a) The phylogeny showing different stem and progenitor cell types. (b) The phylogeny is shown as in part (a), but with the labels underneath coloured by which cell types are being compared. The first row of labels has stem cells from bone marrow in red, progenitor cells from bone marrow in grey and stem cells from peripheral blood in black. The second row of labels has stem cells in red and bone marrow progenitors in black. The third row of labels has MEPs in red, CMPs in black, GMPs in blue and stem cells in grey. (c)-(e) Analysis of molecular variance (AMOVA) is used to test for clustering on the phylogeny for each of stem cells derived from peripheral blood vs bone marrow (c), stem cells vs progenitors (d), and different progenitor types (e). In each panel is shown the histogram of the null distribution of the statistic used to detect clustering, obtained by randomly permuting which cells are assigned to which category. Comparisons are only between cell types not shown in grey in panel (b). The observed value of the statistic is shown as a red vertical line. BM: bone marrow-derived; PB: peripheral blood-derived; HSC: haematopoietic stem cell; CMP: common myeloid progenitor; GMP: granulocyte macrophage progenitor; MEP: megakaryocyte erythrocyte progenitor.
Extended Figure 7. Approximate Bayesian Computations (ABC).
(a) The joint prior distribution for stem cell numbers (HSCs) and the generation time for the first ABC. (b) The location in sample space of the 10% of simulations that produced summary statistics (using only the ltt summary statistics – see methods and technical supplement) most similar to the observed summary statistics. (c) The joint prior distribution for the second ABC, in the area of sample space indicated to be plausible by the first set of simulations. (d) The joint posterior distribution of the best 500 simulations from the second ABC, as shown in figure 5 for ease of reference. Letters n, o, and p on the plot indicate the position in sample space from which panels (n), (o), and (p) were drawn, respectively. (e)-(i) Cross-validation of the model to choose the number of accepted simulations and the weighting applied to the ltt summary statistics (methods and technical supplement). (j) For illustrative purposes, five simulations were sampled for each of three population sizes along the plausible diagonal of sample space indicated in panel (b). One set of summary statistics are shown for these simulations in (k). Here, a red line indicates a simulation coming from the area of sample space indicated by a red point in (j); idem for blue and green lines. The black dotted line indicates the observed values for these summary statistics. This set of summary statistics counts, for different numbers of samples (x axis), how many of the 3952 mutations considered (y axis) are in this many samples with two or more reads, using error model 1 (which simulates errors according to the error rate in control DNA (supplementary methods)). The same summary statistics were calculated for different mutant read number cutoffs. (l) For each of the 1000 simulations that produce summary statistics most similar to the observed, the Euclidean distance from the observed (y axis) is plotted against the number of stem cells in that simulation (x axis). This information is used by the neural network regression step to define the most likely value for the number of stem cells. It can be seen that the most similar values are seen at around 100,000 stem cells, which was the location of the median of the posterior distribution from neural network regression. (m) The observed phylogeny, with branch points indicated by asterisks. (n)-(p) Phylogenies drawn from simulations that occur at the points in sample space indicated in panel (d). (n) represents a relatively plausible simulation, since the pattern of branch points is not dissimilar from that seen in the observed phylogeny (m). Simulations with smaller stem cell populations and faster stem cell turnover rates resulted in phylogenies where the stem cells are very closely related to each other (p), whereas those with larger populations and slower turnover result in phylogenies where the stem cells only share an embryonic common ancestor, and no branches are seen through the tree (p).
Extended Figure 8. Targeted sequencing data.
(a) Correlations between the variant allele fractions (VAFs) of all sequenced samples, shown on a log scale. Note that samples that were sequenced to lower depth cannot have VAFs as small as samples sequenced to higher depths. (b) Targeted sequencing information with no error correction. The data are shown as in figure 4 for all the samples interrogated, but just focusing on the first 350 mutations of molecular time. To allow a better comparison between samples sequenced at different depths, a higher detection threshold and different detection threshold are used relative to figure 4. (c) Targeted sequencing information after using cord blood controls for sequencing error correction with the Bayesian generalised poisson mixed effects model. The colour scale is the same as in panel b. The granulocytes 9 month timepoint is the same data as in figure 4 (provided again for ease of comparison), but plotted with a different colour scale.
Extended Figure 9. Multilineage clonal output.
(a) The phylogeny with targeted sequencing information in different blood fractions overlaid as in Figure 6, shown again here for ease of reference. The colouring of mutations reflects which peripheral blood cell fractions they could be detected in, as indicated by the colour key. Arrows indicate adult clones with multilineage output, with letters corresponding to the panels below. G, granulocytes; G low VAF, granulocytes, allele fraction too low to be detected in lymphocytes; B, B lymphocytes; T, T lymphocytes. (b)-(f) Variant allele fractions of all mutations on branches (indicated by arrows in (a)) with mutations beyond molecular time 100 that are detectable in granulocytes and B lymphocytes but not T lymphocytes.
Supplementary Material
Acknowledgements
This work was supported by the Leukemia Lymphoma Society, the WBH Foundation and the Wellcome Trust. PJC is a Wellcome Trust Senior Clinical Fellow (WT088340MA). HLS is a recipient of a Wellcome Trust PhD studentship. NFO is the recipient of a Danish Lundbeck Fellowship (2016-17) and MSS is the recipient of a BBSRC CASE Industrial PhD Studentship. Work in the DGK lab is supported by a Bloodwise Bennett Fellowship (#15008), a European Research Council Starting Grant (ERC-2016-STG–715371) and a European Hematology Association Non-Clinical Advanced Research Fellowship. Work in the ARG Lab is supported by the Wellcome Trust, Bloodwise, Cancer Research UK, the Kay Kendall Leukaemia Fund, and the Leukemia and Lymphoma Society of America. Work in EL lab is supported by a Wellcome Trust Sir Henry Dale Fellowship, BBSRC and a European Haematology Association Non-Clinical Advanced Research Fellowship. The DGK, EL and ARG labs are supported by a core support grant from the Wellcome Trust and Medical Research Council to the Cambridge Stem Cell Institute. We acknowledge further assistance from the National Institute for Health Research Cambridge Biomedical Research Centre and the Cambridge Experimental Cancer Medicine Centre.
The authors would like to thank Richard Grenfell and Mateusz Strzelecki in the Flow Cytometry Facility of the Cancer Research UK Cambridge Institute for technical assistance and suggestions; Connie Eaves and Philip Beer for discussions about the experimental design; Peggy Goodell for discussions about the results; Jacob Grinfeld and Carlos Gonzalez-Arias for drawing peripheral blood; and Grace Collord for providing negative control samples for targeted sequencing.
Footnotes
Author Contributions
PJC, DGK, ARG and HLS designed the experiment. BJPH performed the bone marrow aspirate. DGK, NFO, MSS and MB cultured HSPCs, with advice and reagents from EL, and isolated cells from subsequent blood draws. EA and LO’N oversaw DNA extraction and library preparation. HLS performed most of the data curation and statistical analysis. SG helped call mutations and construct the phylogeny. IM tested for positive selection. MRS oversaw mutational signatures analysis. RO and PJC separated signal from noise in targeted sequencing analysis. KD helped design the approximate Bayesian computation along with PJC and HLS and co-wrote the supplementary results on inference of population size. HLS, PJC, DGK and ARG wrote the manuscript, with contributions from all the authors. PJC, DGK and ARG jointly supervised the project.
Author Information
Reprints and permissions information is available at www.nature.com/reprints. Correspondence and request for materials should be addressed to pc8@sanger.ac.uk.
The authors declare no competing interests.
References
- 1.Till JE, McCulloch EA. A direct measurement of the radiation sensitivity of normal mouse bone marrow cells. Radiat Res. 1961;14:213–22. [PubMed] [Google Scholar]
- 2.Becker AJ, McCulloch EA, Till JE. Cytological demonstration of the clonal nature of spleen colonies derived from transplanted mouse marrow cells. Nature. 1963;197:452–4. doi: 10.1038/197452a0. [DOI] [PubMed] [Google Scholar]
- 3.Lemischka IR, Raulet DH, Mulligan RC. Developmental potential and dynamic behavior of hematopoietic stem cells. Cell. 1986;45:917–27. doi: 10.1016/0092-8674(86)90566-0. [DOI] [PubMed] [Google Scholar]
- 4.Antoniou AC, et al. Breast-Cancer Risk in Families with Mutations in PALB2. N Engl J Med. 2014;371:497–506. doi: 10.1056/NEJMoa1400382. [DOI] [PMC free article] [PubMed] [Google Scholar]
- 5.Naik SH, et al. Diverse and heritable lineage imprinting of early haematopoietic progenitors. Nature. 2013;496:229–32. doi: 10.1038/nature12013. [DOI] [PubMed] [Google Scholar]
- 6.Koelle SJ, et al. Quantitative stability of hematopoietic stem and progenitor cell clonal output in rhesus macaques receiving transplants. Blood. 2017;129:1448–1457. doi: 10.1182/blood-2016-07-728691. [DOI] [PMC free article] [PubMed] [Google Scholar]
- 7.Abkowitz JL, Catlin SN, Guttorp P. Evidence that hematopoiesis may be a stochastic process in vivo. Nat Med. 1996;2:190–7. doi: 10.1038/nm0296-190. [DOI] [PubMed] [Google Scholar]
- 8.Sun J, et al. Clonal dynamics of native haematopoiesis. Nature. 2014;514:322–327. doi: 10.1038/nature13824. [DOI] [PMC free article] [PubMed] [Google Scholar]
- 9.Busch K, et al. Fundamental properties of unperturbed haematopoiesis from stem cells in vivo. Nature. 2015;518:542–546. doi: 10.1038/nature14242. [DOI] [PubMed] [Google Scholar]
- 10.Sawai CM, et al. Hematopoietic Stem Cells Are the Major Source of Multilineage Hematopoiesis in Adult Animals. Immunity. 2016;45:597–609. doi: 10.1016/j.immuni.2016.08.007. [DOI] [PMC free article] [PubMed] [Google Scholar]
- 11.Bystrykh LV, Verovskaya E, Zwart E, Broekhuis M, de Haan G. Counting stem cells: methodological constraints. Nat Methods. 2012;9:567–574. doi: 10.1038/nmeth.2043. [DOI] [PubMed] [Google Scholar]
- 12.Fialkow PJ, Gartler SM, Yoshida A. Clonal origin of chronic myelocytic leukemia in man. Proc Natl Acad Sci U S A. 1967;58:1468–71. doi: 10.1073/pnas.58.4.1468. [DOI] [PMC free article] [PubMed] [Google Scholar]
- 13.Fialkow PJ, Jacobson RJ, Papayannopoulou T. Chronic myelocytic leukemia: clonal origin in a stem cell common to the granulocyte, erythrocyte, platelet and monocyte/macrophage. Am J Med. 1977;63:125–30. doi: 10.1016/0002-9343(77)90124-3. [DOI] [PubMed] [Google Scholar]
- 14.Cartier N, et al. Hematopoietic stem cell gene therapy with a lentiviral vector in X-linked adrenoleukodystrophy. Science (80-. ) 2009;326:818–823. doi: 10.1126/science.1171242. [DOI] [PubMed] [Google Scholar]
- 15.Biasco L, et al. In Vivo Tracking of Human Hematopoiesis Reveals Patterns of Clonal Dynamics during Early and Steady-State Reconstitution Phases. Cell Stem Cell. 2015;19:107–119. doi: 10.1016/j.stem.2016.04.016. [DOI] [PMC free article] [PubMed] [Google Scholar]
- 16.Notta F, et al. Distinct routes of lineage development reshape the human blood hierarchy across ontogeny. Science. 2015;351:1–16. doi: 10.1126/science.aab2116. [DOI] [PMC free article] [PubMed] [Google Scholar]
- 17.Werner B, et al. Reconstructing the in vivo dynamics of hematopoietic stem cells from telomere length distributions. Elife. 2015;4:1–23. doi: 10.7554/eLife.08687. [DOI] [PMC free article] [PubMed] [Google Scholar]
- 18.Catlin SN, Busque L, Gale RE, Guttorp P, Abkowitz JL. The replication rate of human hematopoietic stem cells in vivo. Blood. 2011;117:4460–4466. doi: 10.1182/blood-2010-08-303537. [DOI] [PMC free article] [PubMed] [Google Scholar]
- 19.Blokzijl F, et al. Tissue-specific mutation accumulation in human adult stem cells during life. Nature. 2016;538:260–264. doi: 10.1038/nature19768. [DOI] [PMC free article] [PubMed] [Google Scholar]
- 20.Welch JS, et al. The Origin and Evolution of Mutations in Acute Myeloid Leukemia. Cell. 2012;150:264–278. doi: 10.1016/j.cell.2012.06.023. [DOI] [PMC free article] [PubMed] [Google Scholar]
- 21.Nik-Zainal S, et al. The life history of 21 breast cancers. Cell. 2012;149:994–1007. doi: 10.1016/j.cell.2012.04.023. [DOI] [PMC free article] [PubMed] [Google Scholar]
- 22.Behjati S, et al. Genome sequencing of normal cells reveals developmental lineages and mutational processes. Nature. 2014;513:422–425. doi: 10.1038/nature13448. [DOI] [PMC free article] [PubMed] [Google Scholar]
- 23.Bae T, et al. Different mutational rates and mechanisms in human cells at pregastrulation and neurogenesis. Science (80-. ) 2017;555:1–10. doi: 10.1126/science.aan8690. [DOI] [PMC free article] [PubMed] [Google Scholar]
- 24.Notta F, et al. Isolation of single human hematopoietic stem cells capable of long-term multilineage engraftment. Science. 2011;333:218–21. doi: 10.1126/science.1201219. [DOI] [PubMed] [Google Scholar]
- 25.Zink F, et al. Clonal hematopoiesis, with and without candidate driver mutations, is common in the elderly. Blood. 2017;130:742–752. doi: 10.1182/blood-2017-02-769869. [DOI] [PMC free article] [PubMed] [Google Scholar]
- 26.Jaiswal S, et al. Age-related clonal hematopoiesis associated with adverse outcomes. N Engl J Med. 2014;371:2488–98. doi: 10.1056/NEJMoa1408617. [DOI] [PMC free article] [PubMed] [Google Scholar]
- 27.Xie M, et al. Age-related mutations associated with clonal hematopoietic expansion and malignancies. Nat Med. 2014;20:1472–8. doi: 10.1038/nm.3733. [DOI] [PMC free article] [PubMed] [Google Scholar]
- 28.Mckerrell T, et al. Leukemia-Associated Somatic Mutations Drive Distinct Patterns of Age-Related Clonal Hemopoiesis. Cell Rep. 2015;10:1239–1245. doi: 10.1016/j.celrep.2015.02.005. [DOI] [PMC free article] [PubMed] [Google Scholar]
- 29.Martincorena I, et al. Universal Patterns of Selection in Cancer and Somatic Tissues. Cell. 2017;171:1029–1041. doi: 10.1016/j.cell.2017.09.042. [DOI] [PMC free article] [PubMed] [Google Scholar]
- 30.Plusa B, et al. The first cleavage of the mouse zygote predicts the blastocyst axis. Nature. 2005;434:391–395. doi: 10.1038/nature03388. [DOI] [PubMed] [Google Scholar]
- 31.Ju YS, et al. Somatic mutations reveal asymmetric cellular dynamics in the early human embryo. Nature. 2017;543:714–718. doi: 10.1038/nature21703. [DOI] [PMC free article] [PubMed] [Google Scholar]
- 32.Pei W, et al. Polylox barcoding reveals haematopoietic stem cell fates realized in vivo. Nature. 2017;548:456–460. doi: 10.1038/nature23653. [DOI] [PMC free article] [PubMed] [Google Scholar]
- 33.Rahbari R, et al. Timing, rates and spectra of human germline mutation. Nat Genet. 2016;48:126–133. doi: 10.1038/ng.3469. [DOI] [PMC free article] [PubMed] [Google Scholar]
- 34.Lan S, Palacios JA, Karcher M, Minin VN, Shahbaba B. An efficient Bayesian inference framework for coalescent-based nonparametric phylodynamics. Bioinformatics. 2015;31:3282–3289. doi: 10.1093/bioinformatics/btv378. [DOI] [PMC free article] [PubMed] [Google Scholar]
- 35.Young AL, Challen GA, Birmann BM, Druley TE. Clonal haematopoiesis harbouring AML-associated mutations is ubiquitous in healthy adults. Nat Commun. 2016;7:1–7. doi: 10.1038/ncomms12484. [DOI] [PMC free article] [PubMed] [Google Scholar]
- 36.Schlenner SM, et al. Fate Mapping Reveals Separate Origins of T Cells and Myeloid Lineages in the Thymus. Immunity. 2010;32:426–436. doi: 10.1016/j.immuni.2010.03.005. [DOI] [PubMed] [Google Scholar]
- 37.Lodato MA, et al. Aging and neurodegeneration are associated with increased mutations in single human neurons. Science (80-. ) 2017;559:1–8. doi: 10.1126/science.aao4426. [DOI] [PMC free article] [PubMed] [Google Scholar]
Associated Data
This section collects any data citations, data availability statements, or supplementary materials included in this article.


