

Abstract
Automated data acquisition is used widely for single-particle reconstruction of three-dimensional (3D) volumes of biological complexes preserved in vitreous ice and imaged in a transmission electron microscope. Automation has become integral to this method because of the very large number of particle images required in order to overcome the typically low signal-to-noise ratio of these images.
For optimal efficiency, automated data acquisition software packages typically employ some beam-image shift targeting as this method is both fast and accurate (+/− 0.1 μm). In contrast, using only stage movement, relocation to a targeted area under low-dose conditions can only be achieved in combination with multiple iterations or long relaxation times, both reducing efficiency. Nevertheless it is well known that applying beam-image shift induces beam-tilt and with it a potential structure phase error; with π/4 phase error considered as the worst that can be accepted. This theory has been used as an argument against beam-image shift for high resolution data collection. Nevertheless, in practice many small beam-image shift datasets have resulted in 3D reconstructions beyond the π/4 phase error limit.
To address this apparent contradiction, we performed cryo-EM single-particle reconstructions on a T20S proteasome sample using applied beam-image shifts corresponding to beam tilts from 0 to 10 mrad. To evaluate the results we compared the FSC values, and examined the water density peaks in the 3D map. We conclude that the phase error does not limit the validity of the 3D reconstruction from single-particle averaging beyond the π/4 resolution limit.
Keywords: Cryo-EM, automation, coma free alignment, phase error
Introduction
The single particle averaging approach to reconstruct three-dimensional (3D) volumes of biological complexes preserved in vitreous ice and imaged by cryo electron microscopy (cryo-EM) is a powerful technique with increasing numbers of structures reconstructed to a resolution range of 3 Å or better (Crowther, 2016). There were 25 sub-3 Å maps (arising from 10 published papers) deposited in the EMDB in the last six months. Due to the radiation sensitivity of biological samples preserved in vitreous ice, to achieve high resolutions, very large numbers of particle images have to be acquired, each at a previously unexposed area. This makes the acquisition process slow, and, before automated data acquisition was developed (Tan et al., 2016), it was also very labor intensive.
Automated data acquisition is typically performed with a series of targeting and imaging steps at progressively higher magnifications. This workflow improves targeting accuracy while practicing low-dose methods, which is critical for high resolution cryo-EM. Automated eucentric height adjustment and object lens focusing are inserted between some of the steps. To image at the targets selected at lower magnifications, either a stage movement or image deflector with a compensated beam shift is used to center the targeted image on the detector.
All popular automated data acquisition software packages used today (Leginon (Suloway et al., 2005), SerialEM (Mastronarde, 2005) and EPU) have this capability and often employ some degree of beam-image shift (as opposed to stage shift) to optimize the efficiency of the workflow for high magnification targeting. This is because even the best mechanical stages on the most commonly used electron microscopes can only achieve a reproducibility of +/− 1 μm when requested to move to a target some distance away (e.g. 20 μm) (Cheng et al., 2016). Alternatively, the high precision obtained by some mechanical or piezo-driven stages requires long relaxation times to reduce residual stage drift. We have observed, over numerous projects, that for final high magnification targeting, a moderate beam-image shift (~2 μm) can be used and will produce a map of very high quality (even as high at 2.5 Å) in half the time required when using stage shift.
Despite this success, using beam-image shift is against the conventional wisdom that this approach will induce beam tilt, and produce distortion in the image by changing the phase of the structure factor. Here we present a series of experiments exploring the limits of the resolution that can be achieved for single particle averaging reconstruction when beam-image shifts corresponding to beam tilts from 0–10mrad are used for targeting. The results are much better than might be expected and we provide a possible explanation for why this may be so.
Theory
Lens aberrations distort the electron wave. As we seek higher resolution, more of these aberrations have to be considered. Defocus, and 2-fold astigmatism are commonly corrected for cryo-EM images of biological molecules. A further important aberration that needs to be considered, at least when the spherical aberration constant, Cs, is non-zero, is the coma effect produced from beam tilt, θ (Glaeser et al., 2011; Uhlemann and Haider, 1998).
The mapping of beam tilt at the objective lens of a parallel illumination can be divided into axial, isotropic off-axial, and azimuthal off-axial components. Whatever the source, these create coma effects which can be corrected with an applied beam tilt creating equivalent coma in the opposite direction. In this manuscript, θ is not used to identify any single component but describes the value that needs to be corrected to return to a coma-free state at that position of the lens.
The coma effect causes both a defocus change in the direction of the beam tilt as well as an azimuthally varying and predictable phase error of the structure factor, Δϕ:
| (1) |
where λ is the electron wavelength, s the spatial frequency, is a unit vector indicating the direction of the beam tilt and is a unit vector indicating the direction of the spatial frequency vector. This structure factor phase error creates a distortion of the image that is not correctable without knowing the magnitude and direction of the beam tilt. As discussed in Glaeser et al. (2011), the “worst that one could accept” phase error is defined as π/4. Applying that value in Equation 1, for a known beam tilt, the π/4 resolution limit is:
| (2) |
Table 1 lists a few beam tilts relevant to this manuscript and their π/4 and π/2 resolution limits.
Table 1:
Phase error resolution limit at 300kV and microscope with 2.7 mm Cs in comparison to the experimental (Expt) FSC0.143
| Beam Tilt (mrad) | 0.25 | 0.33 | 0.5 | 1.00 | 1.30 | 10.0 |
| π/4 resolution limit (Å) | 2.75 | 3.0 | 3.47 | 4.36 | 4.77 | 9.41 |
| +tilt expt FSC0.143 resolution (Å) | 3.05 | 3.39 | 5.37 | |||
| +/−tilt expt FSC0.143 resolution (Å) | 2.89 | 2.92 | 3.16 |
According to this calculation, even though a single image taken at a given beam tilt may appear to have features resolved beyond the π/4 resolution limit, the distortion of the feature will be considered as not representing the structure.
Figure 1 illustrates this distortion on a phantom images consisting of two white squares separated by their length (Figure 1A). If the center of the object is determined by an algorithm, the positions of these centers will be found half way between the squares, as indicated by the black line throughout Fig 1. If a severe simulated coma effect is applied according to Equation 1, the objects are no longer symmetrical around their original centers (Figure 1B, 1C).
Figure 1:
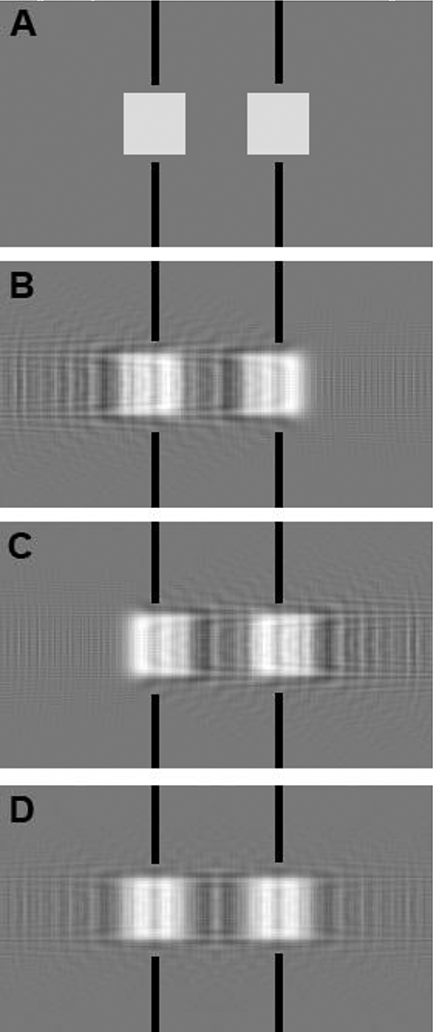
Simulation of coma effect on image structure. (A) phantom image; (B) and (C) simulated beam tilt in the horizontal plane toward right and left, respectively; (D) averaging of (B) and (C) produces an image centered at the same position as the input.
Adding Opposite Coma Effect Decreases Structure Factor Amplitude but Restores its Phase
We observe that Δϕ becomes -Δϕ if changes sign. This situation may happen either because the beam is tilted to –θ, or the object is rotated so that points in the opposite direction. While the distortion of the features are not the same, the vector addition of the structure factor imposed during the averaging process cancels the phase errors but also reduces the amplitudes. This effect means that the accuracy of the feature location is not affected by the coma at any resolution when we combine data from two opposite tilts, represented as +/−θ throughout this manuscript or when combining data from two particles that orientate the Friedel pair of structure factors to project to, respectively (See Figure 1S for a 3D illustration). This canceling effect on coma phase error is illustrated in Figure 1. Figure 1B and1C show the effects of coma in opposite directions, leading to different distortions. When the two images are averaged, the objects are again centered as shown in Figure 1D. The averaged image has blurred edges since the higher resolution structure factors are weighted down by a factor of cos Δϕ.
Single-particle averaging collects large numbers of projection images of the same structure in random orientations and then computationally aligns and averages them to reconstruct the 3D map. Considering these large numbers of input images, it is reasonable to assume that there are always pairs of particle images that are at the same 3D orientation with one producing + while the other –. Therefore, until the single-sideband phase error is π/2, the combined coma-effect is an s dependent amplitude reduction to the factor of cos(Δϕ) of the structure factor without phase errors. Beyond this point the amplitude becomes negative or a π/2 phase error for the combined data. In either range, feature locations in the 3D map reconstruction should not move as shown in Figure 1D.
Coma phase error is directionally deteriorated
In additional to the phase error canceling of the opposite coma, Eq. 2 describes the case when the structure factor is aligned with the direction of the beam tilt. As inclusion of in Eq. 1 implies, there is no phase error from the beam tilt when is perpendicular to . Therefore, the averaged side-band phase error is (2/π) = 63% smaller. This combined phase error should, however, still have a phase error resolution limit proportional to θ 1/3.
Material and Methods
Four experiments using different estimated beam tilts were analyzed in this study: (1) Typical +/−0.33 mrad; (2) 0, +/−0.5, +/−1.33 mrad; (3) 5 mrad; (4) 10 mrad. Data for each of the four experiments was acquired on different grids. Supplemental Table 1S summaries the experiment design.
Sample:
Thermoplasma acidophilum 20S proteasome was a gift from Yifan Cheng, Zanlin Yu, and Kiyoshi Egami. The received stock was separated into small aliquots and stored at −80 °C.
Grid Preparation:
3μl of freshly thawed protein was applied to plasma-cleaned C-flat 1.2/1/3 400 mesh Cu holey carbon grids (Protochips, Raleigh, North Carolina), blotted for 2.5 s after a 30 s wait time, and then plunge frozen in liquid ethane, cooled by liquid nitrogen, using the Cryoplunge 3 (Gatan) at 75% relative humidity.
Microcopy:
Thermo Fisher Scientific Titan Krios operated at 300 kV and Gatan K2 Summit camera in counting mode were used in all experiments described. The Cs value is 2.7 mm. The experiments shown are from two different microscopes differing only in that that one has a Gatan BioQuantum energy filter; we did not observe any trends associated with energy filtering. Pixel size was either 1.06 or 1.10 Å. A 100 μm objective aperture was used except in the 5 and 10 mrad beam tilt experiment (Experiment 3 and 4).
Imaging:
Movies in the four experiments were collected in counting mode using Leginon (Suloway et al., 2005) at a dose rate of 8.0 e-/Å2/s with a total exposure time of 5–7 seconds, for an accumulated dose of 35 – 42 e−/Å2. Intermediate frames were recorded every 0.1 or 0.2 seconds for a total of 25 – 60 frames per micrograph. Defocus values range from approximately 1.0 – 3.0 μm.
Beam tilt measurement
For a well-aligned microscope the only beam tilt that needs to be considered using beam-image shift conditions is the off-axis beam tilt. This beam tilt measurement was performed according to the procedure previously described (Cheng et al., 2016). For experiments using an intentionally misaligned beam (Experiment 2, 3, and 4), beam tilt was estimated from observing the movement of the diffraction ring from a grating replica gold-palladium cluster relative to the 70 μm objective aperture. The (111) and (200) diffraction ring scatters at 8.52 and 9.84 mrad at 300 kV high-tension. The radius difference between these two rings in the diffraction image therefore provides the scale calibration. In these experiments the off-axis beam tilt cannot be measured, and may contribute to the spread of the results, most evidently in Experiment 2 (see Supplemental Material Table S2).
Experiment 1; Typical +/−0.33 mrad beam tilt imaging:
The typical imaging condition we use with a well-aligned scope introduces up to 0.33 mrad when 4 targets are selected in the lower-magnification overview image requiring an image shift distance of ~1.7 μm to center the target at the high magnification setting (Figure 2A). Axial-coma was minimized with the help of Zemlin tableau. This observed beam tilt is thus mainly from off-axis beam tilt.
Figure 2.
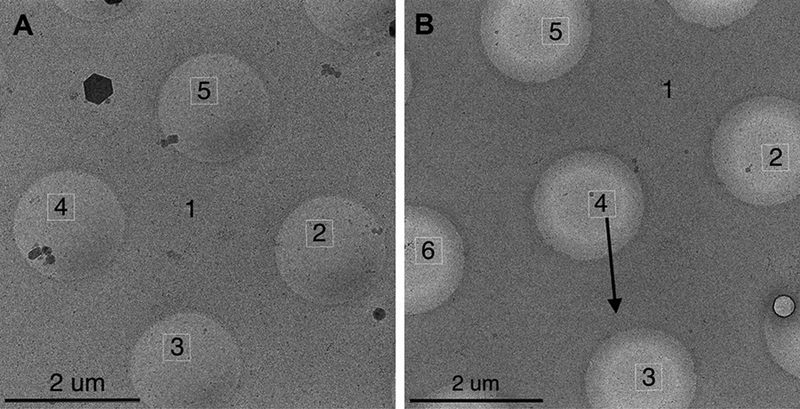
Targeting scheme. The numbers represent the order of target processing, Target 1 is where autofocusing is performed. (A) Standard 1.7 μm beam-image shift targeting used in all Experiments except 2. Targets are determined automatically to adjust with the hole location variation from stage movement inaccuracy. (B) 2.6 μm beam-image shift targeting used in Experiment 2 for up to 1.3 mrad beam tilt imaging. A fixed pattern of targets was used for all imaging. The black arrow is roughly aligned to the image shift x direction and was the direction along which the beam-shift and beam-tilt pivot points were misaligned. Target 4 was chosen to require no beam-image shift. Target 3 and 5 have the maximal beam tilt at this orientation while target 2 and 6 have minimal beam tilt.
Experiment 2; 0, +/−0.5 and +/−1.3 mrad beam tilt imaging:
To induce larger than normal beam tilts at given beam-image shifts, we modified the beam shift and beam tilt pivot point x in the registry as well as beam-image calibrations. Beam shift and beam tilt pivot points are generally aligned around zero beam-tilt so that applied beam shift receives balanced deflector currents to minimize the change of beam tilt from zero. We changed the scale of the correction the deflectors make so that it loses the balance in the x direction. Beam-image calibration calibrates the scale and direction of beam shift required to keep the beam stationary on the detector at a given change of image shift deflector current. The modification of the pivot point makes the original calibration invalid. Therefore a round of beam-image calibration was performed. The amount of beam tilt induced in beam-image shift of 2.6 μm, the distance of our imaging targets from the center, was then estimated as described above. Leginon was set up with 5 targets in the lower-magnification overview image as shown in Figure 2B. The center target acquires a high-magnification image with no beam image shift applied. Beam-image shifts were required to image the surrounding more distant targets. Two of these targets have maximal beam tilt and the other two have minimal beam tilt as indicated in Figure 2B.
Experiment 3 and 4; 5 and 10 mrad beam tilt imaging, respectively:
It was not possible to induce beam tilts larger than 1.3 mrad without significant targeting error in the beam-image shift. The 5 mrad beam tilt was induced by applying a constant beam tilt value in a custom Leginon node only during final high-magnification image acquisition. The four target beam-imaging shift protocol described in Figure 2A was used. The objective aperture was removed to minimize side-band effects at these large beam tilts. The 10 mrad beam tilt imaging was performed with the same protocol.
Image Processing:
Movies recorded on the K2 were aligned using MotionCor2 with dose weighting (Zheng et al., 2017) and CTF estimation was performed with CTFFIND4 (Rohou and Grigorieff, 2015). For the first 50 images particles were picked automatically using the Appion DoG Picker (Voss et al., 2009), extracted, and subjected to 2D classification in RELION (Scheres, 2012) to create templates for another round of particle picking using FindEM (Roseman, 2004). The picked particles were extracted and subjected to 2D classification and the best classes was subjected to ab initio reconstruction to create an initial model in cryoSPARC (Punjani et al., 2017). This model was used for 3D classification in RELION or heterogeneous refinement in cryoSPARC. For the final reconstruction, particles corresponding to the best two 3D classes were selected and subjected to 3D refinement in cryoSPARC using a box size of 256×256 pixels. An earlier experiment (Experiment 1) with its micrographs aligned using MotionCorr (Li et al., 2013) also underwent particle polishing in RELION.
3D reconstructions were soft masked and sharpened with auto-B-factor determination using cryoSPARC or RELION. The program applied (2*FSC/(FSC+1))1/2 weighting as in (Rosenthal and Henderson, 2003) and fitting of a straight line through the Guinier plot to find the B-factor.
Results
We collected and analyzed particle images taken at various beam tilts. Figure 3 summarizes the FSC0.143 resolution of each of the resulting 3D maps defined in RELION (Scheres, 2012) and cryoSPARC (Punjani et al., 2017). More statistics can be found in Supplementary Materials. FSC0.143 resolution, B-factor (Rosenthal and Henderson, 2003), and Reslog plot slopes (Stagg et al., 2014) all worsen at higher beam tilts. However, all beam-tilted data sets achieved resolutions higher than the π/4 limit and those tilted more than 1.0 mrad even exceeded the π/2 limit. It is thus clear that the coma effect phase error does not limit the FSC0.143 resolution according to these expectations.
Figure 3:
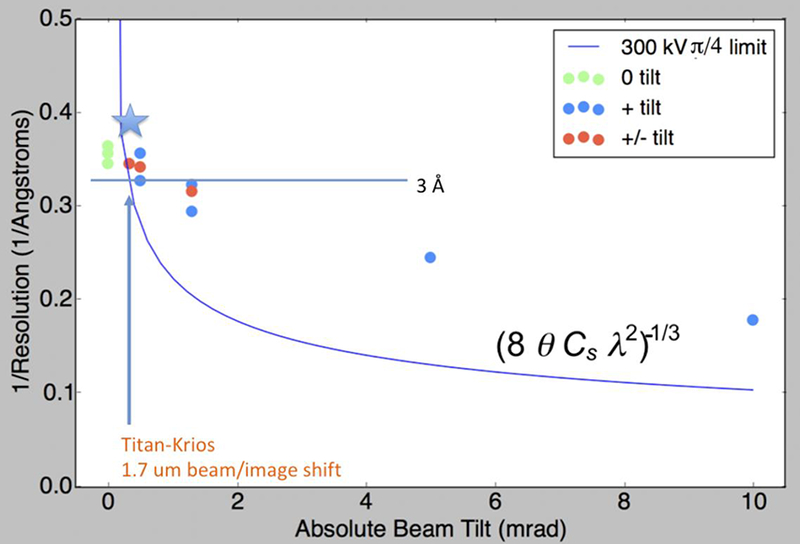
The FSC0.143 resolution achieved from maps reconstructed using images with defined beam tilt applied. The phase error resolution limits at π/4 is shown as theoretical references. The star marks the highest resolution proteasome structure obtained with 1.7 μm beam/image shift protocol, although at a smaller pixel size.
We also examined water density peaks identified in the 2.8 Å structure (EMD-6287 and deposited in PDB as 6BDF) to validate both the existence and the position of these features since they are only separable at better than 3 Å resolution and are more sensitive to phase error of the structure factor at higher resolution. Figure 4 shows one such region. The two water peaks we tracked in various maps weaken as the reported FSC0.143 resolution decreased while the center of the peak is well-preserved. More water density tracking is presented in Supplementary Material.
Figure 4:
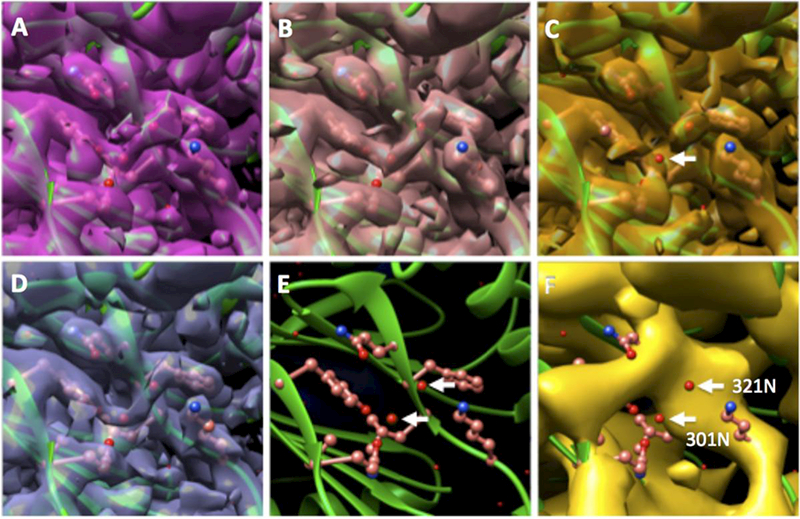
Water density as validation of the correct phase of the density maps. Panels A,B,C are from the same EM grid and same experimental session with different beam tilts (Experiment 2). (D) is from EMD-6287, (E) shows the PDB modeled from (D) that is placed in all maps. The estimated beam tilts are 0, +/− 0.5, +/−1.33, 0, +10 mrad for panel A, B, C, D, F, respectively. The white arrows in (E) and (F) shows the water molecule we track in the various maps. The arrow in (C) points to the 301N water that was not represented by density at the contour level. Maps were aligned against EMD-6287 with fit-in-map function in UCSF Chimera (Pettersen et al., 2004). Surface contours were thresholded such that 1% of voxels lie above the threshold level.
Discussion
The capital equipment and operational cost of high-end cryo-EM microscopes and the competitiveness of the structural biology field demands that these instruments are used as efficiently as possible. Given that mechanical movement of the microscope stages are not more accurate than 1 μm, some beam-image shift is unavoidable. We have found through numerous imaging sessions that with properly aligned beam shift and beam tilt pivot points, maps with FSC0.143 resolution better than 3 Å can be routinely obtained.
We show here experimentally that FSC0.143 resolution from images taken at significant beam tilts are worse than untilted images as expected, but the effect was much smaller than predicted from the theory of a single image. Even the positions of the weaker water peaks were well preserved in this protocol. The phase error limit described by Eq. 2 and similar limits for various lens aberrations describes the unrecoverable image distortion without knowing the value of the aberration, but only for a single image. The single particle averaged resolution does not display the same θ 1/3 dependency. The results of Experiment 2 roughly fit (r=0.75) to a line of
| (3) |
This means that a specimen with ultimate resolution of 2.75 Å can tolerate 0.76 mrad of beam tilt before its resolution is dropped below 3 Å. For a reasonably aligned microscope similar to ours, such beam tilt covers a beam-image shift of +/− 3 to 4.5 μm!
Once a sub-3 Å resolution structure is obtained, beam tilt correction on the individual cluster of beam-image shift values can be made according to microscope-specific calibrations or be refined, further improving the resolution (Scheres, n.d.), making this data collection method even more attractive.
Our results also suggest that the non-parallel illumination does not impose as strong a limitation to single particle cryo-EM as previously believed. Other factors such as image drift, particle number, ice thickness and lack of modern image processing tools may contribute more to the lower resolution of early single particle reconstructions in the field.
One assumption made in our explanation is that the coma-distorted particle images must align properly before averaging. The phase error is proportional to the cube of the spatial frequency. It means that distortions are very small for the low resolution component that contributes heavily to alignment. In addition, the scattering power of proteins or other macromolecules is weaker at high resolution. The square wave form represented in Figure 1A is useful for highlighting the coma effect since its structure Fourier components are equally strong across all resolution. It does not, however, represent the real world protein density that will always have some extent of information dampening at high resolution. There is further dampening at high resolution in the Fourier transform of the protein particle images that we align with single-particle refinement programs: counting camera MTF, and microscope optics envelope, to name a few. Taken together, the phase error coma effect should therefore not impact particle alignment very strongly. We did not observe visual differences in the quality of the 2D class averages between the low and high beam-tilt data set.
Our highest resolution reconstruction of the T20S proteasome was a 2.6 Å map taken at ~1 Å/pixel using standard processing protocols as described in the methods section but using more particles in the average, By further reducing the pixel size, we recently obtained a 2.5 Å proteasome reconstruction using the same imaging methods. This is likely because 2.5Å is at 85% of Nyquist for 1.06 Å pixel and the signal filtered through the detector quantum efficiency is too low.
Our usual advice to users seeking higher resolution is to switch to smaller pixel size albeit at the cost of time.
We also would like to advise users who plan to use the beam-image shift method to first check the amount of beam tilt induced by beam-image shift on their microscope. We measured a variation from 0.17 to 0.25 mrad/μm beam-image shift across three standard Krios Titan columns. One Thermo Fisher Scientific Talos Artica column was measured at 0.47 mrad/μm (personal communication, Gabriel Lander). This value, in combination with stronger coma phase error effects at 200 kV electron voltage, made it necessary to use stage shift alone for pursuing better than 3 Å resolution single particle averaging reconstruction on the Talos Arctica (Herzik et al., 2017).
We so far have no physical explanation for the beam tilt dependency of the achieved single particle averaging resolution, which appears to roughly follow a straight line. Integration of particles of all in-plane directions suggests that the cos Δϕ dampening of a given structure factor follows a sinc function but FSC does not directly reflect this. A full explanation will have to await more experiments or a better theory.
Conclusions
We show that single particle averaging resolution, judged either by FSC0.143 or the presence of water density peaks, contains accurate high resolution information at moderate beam tilt. The π/4 coma phase error limit describes the map distortion of a single image but not the collective resolution of the averaged single particles. We present two theoretical effects that may contribute to our observation., Based on our results, we can safely use beam-image shifts as a targeting protocol when pursuing maps in the 3 Å resolution range on high-end 300 kV scopes, resulting in typically 2–3 times improvement in the data collection efficiency. Higher resolution results are also possible but would require a better specimen, better grid preparation, and a smaller pixel size than that used in this study.
Supplementary Material
Acknowledgement
Some of this work was performed at the Simons Electron Microscopy Center and National Resource for Automated Molecular Microscopy located at the New York Structural Biology Center, supported by grants from the Simons Foundation (SF349247), NYSTAR, and the NIH National Institute of General Medical Sciences (GM103310, OD019994) with additional support from the Agouron Institute (F00316).
Footnotes
Publisher's Disclaimer: This is a PDF file of an unedited manuscript that has been accepted for publication. As a service to our customers we are providing this early version of the manuscript. The manuscript will undergo copyediting, typesetting, and review of the resulting proof before it is published in its final citable form. Please note that during the production process errors may be discovered which could affect the content, and all legal disclaimers that apply to the journal pertain.
References
- Cheng A, Tan YZ, Dandey VP, Potter CS, Carragher B, 2016. Strategies for Automated CryoEM Data Collection Using Direct Detectors. Methods Enzym. 579, 87–102. 10.1016/bs.mie.2016.04.008 [DOI] [PubMed] [Google Scholar]
- Crowther RA, 2016. The Resolution Revolution: Recent Advances In cryoEM, Methods in Enzymology. Elsevier Science. [Google Scholar]
- Glaeser RM, Typke D, Tiemeijer PC, Pulokas J, Cheng A, 2011. Precise beam-tilt alignment and collimation are required to minimize the phase error associated with coma in high-resolution cryo-EM. J Struct Biol 174, 1–10. 10.1016/j.jsb.2010.12.005 [DOI] [PMC free article] [PubMed] [Google Scholar]
- Herzik MAJ, Wu M, Lander GC, 2017. Achieving better-than-3-A resolution by single-particle cryo-EM at 200 keV. Nat. Methods 14, 1075–1078. 10.1038/nmeth.4461 [DOI] [PMC free article] [PubMed] [Google Scholar]
- Li X, Mooney P, Zheng S, Booth CR, Braunfeld MB, Gubbens S, Agard DA, Cheng Y, 2013. Electron counting and beam-induced motion correction enable near-atomic-resolution single-particle cryo-EM. Nat. Methods 10, 584. [DOI] [PMC free article] [PubMed] [Google Scholar]
- Mastronarde DN, 2005. Automated electron microscope tomography using robust prediction of specimen movements. J. Struct. Biol 152, 36–51. 10.1016/j.jsb.2005.07.007 [DOI] [PubMed] [Google Scholar]
- Pettersen EF, Goddard TD, Huang CC, Couch GS, Greenblatt DM, Meng EC, Ferrin TE, 2004. UCSF Chimera--a visualization system for exploratory research and analysis. J. Comput. Chem 25, 1605–1612. 10.1002/jcc.20084 [DOI] [PubMed] [Google Scholar]
- Punjani A, Rubinstein JL, Fleet DJ, Brubaker MA, 2017. cryoSPARC: algorithms for rapid unsupervised cryo-EM structure determination. Nat. Methods 14, 290. [DOI] [PubMed] [Google Scholar]
- Rohou A, Grigorieff N, 2015. CTFFIND4: Fast and accurate defocus estimation from electron micrographs. J. Struct. Biol 192, 216–221. 10.1016/j.jsb.2015.08.008 [DOI] [PMC free article] [PubMed] [Google Scholar]
- Roseman AM, 2004. FindEM--a fast, efficient program for automatic selection of particles from electron micrographs. J Struct Biol 145, 91–99. [DOI] [PubMed] [Google Scholar]
- Rosenthal PB, Henderson R, 2003. Optimal Determination of Particle Orientation, Absolute Hand, and Contrast Loss in Single-particle Electron Cryomicroscopy. J. Mol. Biol 333, 721–745. 10.1016/J.JMB.2003.07.013 [DOI] [PubMed] [Google Scholar]
- Scheres SHW, 2012. RELION: Implementation of a Bayesian approach to cryo-EM structure determination. J. Struct. Biol 180, 519–530. 10.1016/j.jsb.2012.09.006 [DOI] [PMC free article] [PubMed] [Google Scholar]
- Scheres SHW, n.d. Relion 3.0. In preparation
- Stagg SM, Noble AJ, Spilman M, Chapman MS, 2014. ResLog plots as an empirical metric of the quality of cryo-EM reconstructions. J. Struct. Biol 185, 418–426. 10.1016/J.JSB.2013.12.010 [DOI] [PMC free article] [PubMed] [Google Scholar]
- Suloway C, Pulokas J, Fellmann D, Cheng A, Guerra F, Quispe J, Stagg S, Potter CS, Carragher B, 2005. Automated molecular microscopy: the new Leginon system. J Struct Biol 151, 41–60. 10.1016/j.jsb.2005.03.010 [DOI] [PubMed] [Google Scholar]
- Tan YZ, Cheng A, Potter CS, Carragher B, 2016. Automated data collection in single particle electron microscopy. Microsc. 65, 43–56. 10.1093/jmicro/dfv369 [DOI] [PMC free article] [PubMed] [Google Scholar]
- Uhlemann S, Haider M, 1998. Residual wave aberrations in the first spherical aberration corrected transmission electron microscope. Ultramicroscopy 72, 109–119. 10.1016/S0304-3991(97)00102-2 [DOI] [Google Scholar]
- Voss NR, Yoshioka CK, Radermacher M, Potter CS, Carragher B, 2009. DoG Picker and TiltPicker: software tools to facilitate particle selection in single particle electron microscopy. J Struct Biol 166, 205–213. [DOI] [PMC free article] [PubMed] [Google Scholar]
- Zheng SQ, Palovcak E, Armache J-P, Verba KA, Cheng Y, Agard DA, 2017. MotionCor2: anisotropic correction of beam-induced motion for improved cryo-electron microscopy. Nat. Methods 14, 331. [DOI] [PMC free article] [PubMed] [Google Scholar]
Associated Data
This section collects any data citations, data availability statements, or supplementary materials included in this article.