Abstract
Lung ultrasound surface wave elastography (LUSWE) is a novel technique to measure the superficial lung tissue stiffness. A phantom study was carried out in the current research to evaluate the application of LUSWE on assessing lung water for pulmonary edema. A lung phantom model with cellulose sponge was used; various amount of water was injected into the sponge to model lung water. Shaker generated surface wave propagation on the sponge surface was recorded by a 10 MHz ultrasound probe and taken at three shaker frequencies: 100, 150 and 200 Hz. The surface wave speeds were calculated but showed no dependence on the amount of the injected water. However, the shear viscosity of the sponge increased with the water content and the shear elasticity also showed subtle increase. This study suggests that the sponge viscoelasticity might change with the water content, which can be detected by LUSWE.
Keywords: LUSWE, surface wave speed, pulmonary edema, lung phantom, viscoelasticity
Introduction
Pulmonary edema is a fundamental feature of congestive heart failure and inflammatory conditions such as acute respiratory distress syndrome (Picano and Pellikka 2016). A high extravascular lung water (EVLW) level predicts severe prognosis in critically ill patients (Sakka, et al. 2002) and increased risk of death or rate of heart failure readmission (Coiro, et al. 2015). Assessment of EVLW, however, is challenging. Chest x-ray or chest computed tomography (CT) have been the historical standards to assess EVLW, but these imaging studies require ionizing radiation, radiology facilities and pose a significant logistic burden. Due to the large x-ray absorptions by bones, the image quality from chest x-ray is also mediocre. Researchers are actively searching for other methods.
Ultrasound is not traditionally used to evaluate the lung. In normal aerated lungs, most of the ultrasound energies are reflected from the lung surface because of the large acoustic impedance difference between the pleural lining of the lung and the air within the lung. In the presence of EVLW, however, the ultrasound beam finds subpleural interlobular septa thickened by edema (Gargani 2011). The reflection of the ultrasound beam produces reverberation artifacts, called “B-lines” in wet lungs These B-lines start from the plural line and extend to the edge of the screen looking like comet tails. The location and amount of B-line artifacts in ultrasound images (Corradi, et al. 2016, Lichtenstein and Mezière 1998) are used to evaluate pulmonary edema (Picano, et al. 2006) and congestive heart failure (Cardinale, et al. 2014). A recent multicenter trial demonstrated that lung ultrasound (LUS) was more sensitive than chest x-ray for the diagnosis of cardiogenic pulmonary edema (Pivetta, et al. 2015). However, analysis of B-line artifacts is qualitative and relies on visual interpretation which subjects to inter-operator variability (Corradi, et al. 2016).
We have developed a novel technique, lung ultrasound surface wave elastography (LUSWE), to measure superficial lung tissue elastic properties (Zhang, et al. 2016, Zhang, et al. 2017, Zhang, et al. 2011, Zhang, et al. 2018). LUSWE measures the lung surface wave by recording thousands of lung ultrasound images. In addition to lung ultrasound’s qualitative evaluations, LUSWE can also quantitatively characterize the lung. In LUSWE, a 0.1 second harmonic vibration at a given frequency is generated by the indenter of a handheld vibrator on the chest wall of a subject. The ultrasound probe is positioned about 5 mm away from the indenter in the same intercostal space to measure the generated surface wave propagation on the lung in that intercostal space. The surface wave speed of lung is determined from the change in wave phase with distance and is not dependent on the location of wave excitation. LUSWE has been shown to successfully differentiate the lung elastic properties of patients with interstitial lung disease (ILD) and healthy controls (Zhang, et al. 2017). The objective of this research was to evaluate preliminarily whether LUSWE could be used to measure the EVLW level for pulmonary edema through a lung phantom model study.
Materials and Methods
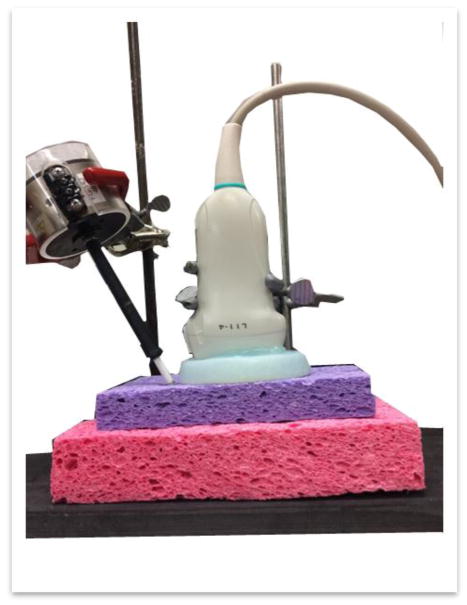
Sponges have been used as a lung phantom in a few past research (Molinari, et al. 2014, Soldati, et al. 2011). Blüthgen et al. (Bluthgen, et al. 2017) have demonstrated especially that sponges can reproduce nicely the commonly observed lung ultrasound A- and B-line artifacts, and can be used for relevant lung study. We used in our experiment a rectangular cellulose sponge for our lung phantom model. Tap water was injected by a syringe at three locations approximately 2 cm apart in the middle of the sponge surface. The experiment setup is shown in Fig. 1. The purple sponge (Ocelo utility sponge, 3M, St. Paul, MN, USA), with a labeled size of 15.2 cm × 9.1 cm × 2.2 cm, is the lung phantom sponge for measurement. Diameters of the pores on this sponge vary from sub-millimeter to a few millimeters. Tiny sub-millimeter pores are distributed all over the walls of larger pores. Underneath the purple sponge, a large pink sponge and a piece of black rubber were added as cushions to reduce the strength of the wave reflected from the boundaries. This setup can help generate the surface wave propagation and avoid other type of waves such as the Lamb wave in a contained structure. We previously proposed a concept of start frequency for generating the surface waves in a finite phantom structure (Zhang 2016). It was shown that different standing wave modes were generated below the start frequency because of wave reflection. However, the pure symmetric surface waves were generated from the excitation above the start frequency. Using the wave speed dispersion above the start frequency, the viscoelasticity of the phantom can be correctly estimated. By reducing the wave reflection and measuring the surface wave speed above the start frequency, the surface wave propagation can be generated in a finite structure. A shaker (Model: FG-142, Labworks Inc., Costa Mesa, CA, USA) was put in contact with the sponge to generate harmonic vibrations on the sponge surface. Three vibration frequencies 100, 150 and 200 Hz were used and the duration for each was 0.1 s. An ultrasound probe (Verasonics linear transducer L11-4V, Verasonics Inc., Kirkland, WA, USA) with a frequency of 10 MHz was placed about 0.5 cm away from the shaker to detect the waves propagated on the sponge surface. An Aquaflex ultrasound gel pad (04-02, Parker Laboratories, Inc. Fairfield, NJ, USA) was put in between the ultrasound probe and the purple sponge to create a separation for wave detection, because ultrasound locates object by multiplying the speed of sound with the length of time that it travels to the object. The ultrasound measurement and the shaker vibrations were synchronized by a vantage ultrasound system (Vantage 256, Verasonics Inc., Kirkland, WA, USA) and the generated B-mode images were collected for further analysis.
Fig. 1.
Experiment setup photo. An ultrasound probe was put atop an ultrasound gel pad to measure the surface wave speed of the lung phantom—the purple sponge. The pink sponge and the black rubber were put under the purple sponge to reduce the reflection of the sound wave from harder surfaces. A shaker was in contact with the purple sponge surface to generate harmonic vibrations on the sponge surface. The bars behind the shaker and the ultrasound probe are the holder frames used to keep the equipment in place.
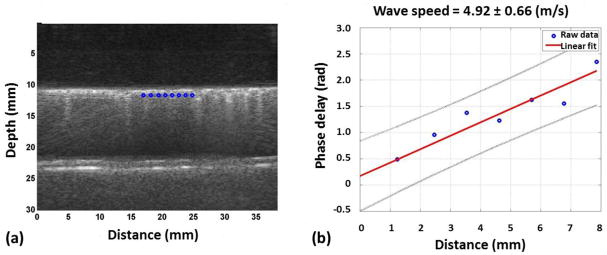
The waves generated by the shaker will travel at the shaker frequency. Through analyzing the phase change Δϕ over a distance Δr at the sponge surface, the surface wave speed Cs can be determined with the known angular shaker frequency ω: Cs = ω| Δr/Δϕ| (Zhang, et al. 2016). By incorporating multiple locations, the calculation accuracy can be greatly improved. Fig. 2a showed the ultrasound image for sponge injected with 6 ml water. The upmost bright horizontal line is the top surface of the purple sponge. The gel pad appeared dark above the purple sponge. The lower bright horizontal lines are the bottom surface of purple sponge and the top surface of the pink sponge. The vertical lines starting at the purple sponge surface and extended all the way below until blurry are the B-line artifacts observed frequently for pulmonary edema patients. These B-line artifacts were observed for all wet sponge cases but not for the dry sponge. Eight locations were selected and marked in blue along the purple sponge top surface for surface wave speed calculation. A linear regression model was used to better estimate the Δr/Δϕ ratio among these locations, for which is the linear regression of Δϕ, α and β are the regression coefficients. Fig. 2b illustrates the regression process. The x and y axes are the distance and phase delay for each location relative to the first selected location. A linear curve was used to fit the data. The slope coefficient α from the best fit line is the best estimation for the rate at which the phases increase with distance. The surface wave speed can therefore be simplified as Cs = ω/α. Fig. 2b shows that the surface wave speed here is 4.92 m/s with an uncertainty of 0.66 m/s.
Fig. 2.
(a) A typical B mode image collected from our experiment. Eight locations were selected on the sponge surface for further analysis and are marked in blue. (b) Regression process illustration. The x and y axes are the distance and the phase delay of each location relative to the first location. The best fit slope of the graph is thus the rate at which the phase changes with distance. The blue dots are the data points read from Fig. 2(a). The red line is the best linear fit for the graph. The surface wave speed was calculated by dividing the angular shaker frequency by the rate the phase changes with distance.
With the surface wave speeds measured at several frequencies, the material viscoelasticity can be estimated (Zhang, et al. 2016):
| (1) |
where μ1 is the shear elasticity, μ2 is the shear viscosity, ω is the angular frequency 2πf, and ρ is the material density. The total weight of the sponge after each water injection were measured by a scale (Mettler Toledo PB302 precision balance, Mettler-Toledo GmbH, Laboratory & Weighing Technologies, Greifensee, Switzerland) with a reading accuracy of 0.1 g. The sponge volume was measured when the sponge was completely dry and when it was injected with 15 ml of water. The volumes for the sponge with water content less than 15ml were estimated based on these two end volumes. The sponge densities were therefore the division of the total weight over the estimated volumes. Using known wave speeds and material densities, we were able to estimate the viscosity and elasticity of the sponge with different water content by fitting equation (1) to the experimental data.
Results and Discussion
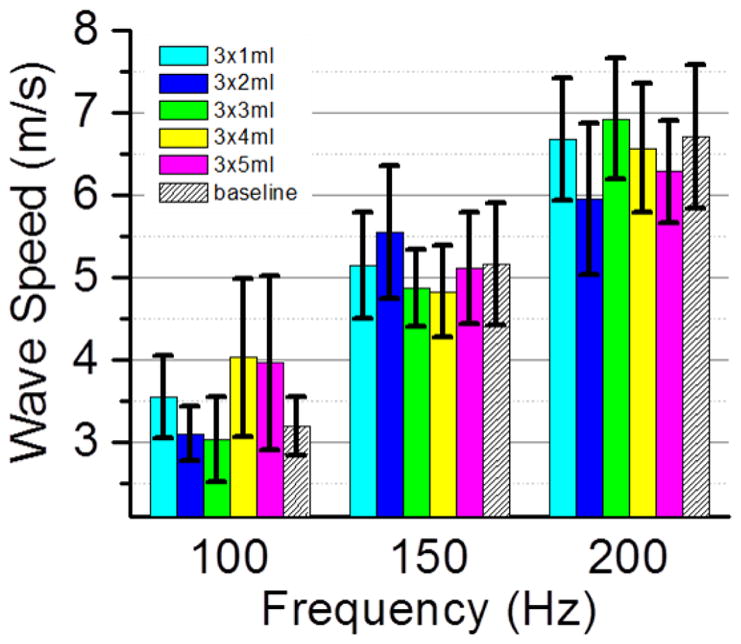
The purple sponge was measured when it was dry and added with water. The water was added with a syringe. For each additional measurement, 1 ml of water was propelled from the syringe to each of the three locations in the middle of the sponge surface. We added water five times and six sets of measurement were made. Fig. 3 plots the calculated surface wave speeds for the six cases at three shaker frequencies. The baseline data, marked with slanted lines, are for the dry sponge. Each colored pillar stands for a sponge condition with different amount of water. The exact water amount for each measurement was listed in the figure legend after corresponding color code. Since each measurement was repeated three times, the final surface wave speeds were the averages of three repeated measurements; the uncertainties, similarly, were the averages of the three uncertainties from individual analysis of the repeated measurements. These uncertainties are marked by black vertical error bars at the top of the colored pillars. As it is shown in the graph, the surface wave speed increased with the shaker frequency, which resembles the patient study results done with LUSWE (Zhang, et al. 2017). But the surface wave speeds for sponge with different water content shows no dependence on the water level; instead, they fluctuated around similar values for each shaker frequency. This indicates that the differences induced by the water content do not change the surface wave speeds.
Fig. 3.

Sponge surface wave speeds obtained for six sponge conditions at three shaker frequencies 100, 150 and 200 Hz. The baseline was measured when the sponge was dry and is shown with slanted lines in the graph. Water was added in an increment of 1 ml at three locations in the middle of the purple sponge surface. The total amount of the added water was listed in the figure legend after each color code. The uncertainties are represented by black vertical bars. While surface wave speed increased with shaker frequency, the data among different sponge conditions were similar at each shaker frequency.
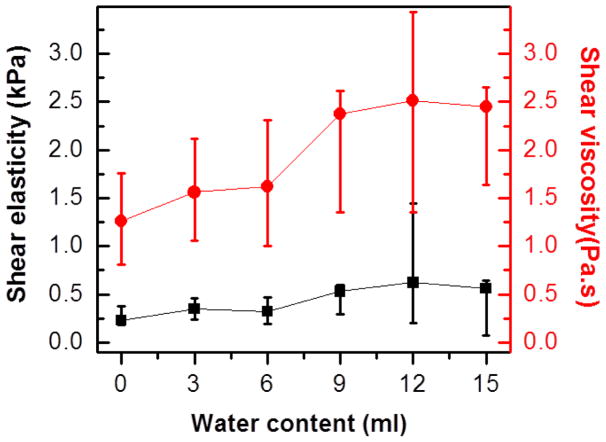
Table 1 summarizes the total weight and densities of the sponge with varied water content. Because of the light weight of the sponge, the overall sponge density was doubled when 15 ml water was injected. With the material densities and known surface wave speeds, the shear viscosity and elasticity were estimated using Equation (1). Started with initial guesses, the shear viscosity and elasticity were adjusted until the differences between the calculated surface wave speeds and experimental values were minimized. The obtained best fit shear viscosity and elasticity for the averaged surface wave speeds are plotted in red dots and black squares in Fig. 4 for sponges with different water content. The uncertainties of these values were estimated by the fitted results for the highest and lowest surface wave speeds for each measurement. Due to the nonlinear dependence of the surface wave speeds on the viscoelasticity, the error bars were not symmetric around the fitted results for the averaged surface wave speeds. As it is shown in the figure, the shear viscosity of the sponge increased with the increase of the water content while the increase of shear elasticity was subtle. Because the weight of the sponge is light, we believe the drastic change in the sponge density enable us to find the increase of viscoelasticity with the water content using LUSWE.
Table 1.
The total weight and average densities of the sponge with different amount of water injected.
| water injected (ml) | Total weight (g) | Sponge density (kg/m3) |
|---|---|---|
| 0 | 14.04 | 74.3 |
| 3 | 17.17 | 89.4 |
| 6 | 20.31 | 104.0 |
| 9 | 23.4 | 117.9 |
| 12 | 26.18 | 129.8 |
| 15 | 29.23 | 142.7 |
Fig. 4.
Viscoelasticity for the purple sponge with different water content. The bottom black data points are shear elasticity. The top red data points are shear viscosity. The black squares and red dots represent the fitted results from the averaged surface wave speeds. The ranges of the uncertainties are defined by the fitted results for the highest and lowest possible surface wave speeds for each measurement. Due to the non-linear dependence of the surface wave speeds on the viscoelasticity, the error bars of viscoelasticity were not symmetric.
Summary
A lung phantom study was carried out to test the feasibility of applying LUSWE on water contents. Measurements were taken at six stages of the lung phantom: completely dry, filled with 3, 6, 9, 12, and 15 ml of water. The B-line artifacts were not present in the dry sponge images but appeared once the water was added, which reproduced the cases for a normal lung and a diseased lung with pulmonary edema. The calculated sponge surface wave speeds were generally larger at higher shaker frequencies, which mimicked the LUSWE measurements on human lung. The surface wave speeds for the six stages of the lung phantom, however, appear to be similar. By fitting the measured surface wave speeds to a theoretical model (equation (1)) of the surface wave speed dependence on viscoelasticity, the shear elasticity and viscosity of the sponge were estimated. While the shear viscosity of the sponge increased with the water content, the increase of the shear elasticity was subtle. Due to the limited data set included in this paper, further studies will be performed on a wide range of sponge stages and at more shaker frequencies. Experiments on ex vivo swine lungs will also be performed to confirm the results.
Acknowledgments
This work is funded by NIH R01HL 125234. The authors would like to thank Boran Zhou for assisting the experiments.
Footnotes
Publisher's Disclaimer: This is a PDF file of an unedited manuscript that has been accepted for publication. As a service to our customers we are providing this early version of the manuscript. The manuscript will undergo copyediting, typesetting, and review of the resulting proof before it is published in its final citable form. Please note that during the production process errors may be discovered which could affect the content, and all legal disclaimers that apply to the journal pertain.
References
- Bluthgen C, Sanabria S, Frauenfelder T, Klingmuller V, Rominger M. Economical Sponge Phantom for Teaching, Understanding, and Researching A- and B-Line Reverberation Artifacts in Lung Ultrasound. J Ultrasound Med. 2017;36:2133–42. doi: 10.1002/jum.14266. [DOI] [PubMed] [Google Scholar]
- Cardinale L, Priola AM, Moretti F, Volpicelli G. Effectiveness of chest radiography, lung ultrasound and thoracic computed tomography in the diagnosis of congestive heart failure. World J Radiol. 2014;6:230–7. doi: 10.4329/wjr.v6.i6.230. [DOI] [PMC free article] [PubMed] [Google Scholar]
- Coiro S, Rossignol P, Ambrosio G, Carluccio E, Alunni G, Murrone A, Tritto I, Zannad F, Girerd N. Prognostic value of residual pulmonary congestion at discharge assessed by lung ultrasound imaging in heart failure. Eur J Heart Fail. 2015;17:1172–81. doi: 10.1002/ejhf.344. [DOI] [PubMed] [Google Scholar]
- Corradi F, Brusasco C, Vezzani A, Santori G, Manca T, Ball L, Nicolini F, Gherli T, Brusasco V. Computer-Aided Quantitative Ultrasonography for Detection of Pulmonary Edema in Mechanically Ventilated Cardiac Surgery Patients. Chest. 2016;150:640–51. doi: 10.1016/j.chest.2016.04.013. [DOI] [PubMed] [Google Scholar]
- Gargani L. Lung ultrasound: a new tool for the cardiologist. Cardiovasc Ultrasound. 2011;9:6. doi: 10.1186/1476-7120-9-6. [DOI] [PMC free article] [PubMed] [Google Scholar]
- Molinari F, Madhuranthakam AJ, Lenkinski R, Bankier AA. Ultrashort echo time MRI of pulmonary water content: assessment in a sponge phantom at 1.5 and 3. 0 Tesla. Diagn Interv Radiol. 2014;20:34–41. doi: 10.5152/dir.2013.13232. [DOI] [PMC free article] [PubMed] [Google Scholar]
- Picano E, Frassi F, Agricola E, Gligorova S, Gargani L, Mottola G. Ultrasound lung comets: a clinically useful sign of extravascular lung water. J Am Soc Echocardiogr. 2006;19:356–63. doi: 10.1016/j.echo.2005.05.019. [DOI] [PubMed] [Google Scholar]
- Picano E, Pellikka PA. Ultrasound of extravascular lung water: a new standard for pulmonary congestion. Eur Heart J. 2016;37:2097–104. doi: 10.1093/eurheartj/ehw164. [DOI] [PMC free article] [PubMed] [Google Scholar]
- Pivetta E, Goffi A, Lupia E, Tizzani M, Porrino G, Ferreri E, Volpicelli G, Balzaretti P, Banderali A, Iacobucci A, Locatelli S, Casoli G, Stone MB, Maule MM, Baldi I, Merletti F, Cibinel GA, Baron P, Battista S, Buonafede G, Busso V, Conterno A, Del Rizzo P, Ferrera P, Pecetto PF, Moiraghi C, Morello F, Steri F, Ciccone G, Calasso C, Caserta MA, Civita M, Condo C, D’Alessandro V, Del Colle S, Ferrero S, Griot G, Laurita E, Lazzero A, Lo Curto F, Michelazzo M, Nicosia V, Palmari N, Ricchiardi A, Rolfo A, Rostagno R, Bar F, Boero E, Frascisco M, Micossi I, Mussa A, Stefanone V, Agricola R, Cordero G, Corradi F, Runzo C, Soragna A, Sciullo D, Vercillo D, Allione A, Artana N, Corsini F, Dutto L, Lauria G, Morgillo T, Tartaglino B, Bergandi D, Cassetta I, Masera C, Garrone M, Ghiselli G, Ausiello L, Barutta L, Bernardi E, Bono A, Forno D, Lamorte A, Lison D, Lorenzati B, Maggio E, Masi I, Maggiorotto M, Novelli G, Panero F, Perotto M, Ravazzoli M, Saglio E, Soardo F, Tizzani A, Tizzani P, Tullio M, Ulla M, Romagnoli E. Lung Ultrasound-Implemented Diagnosis of Acute Decompensated Heart Failure in the ED: A SIMEU Multicenter Study. Chest. 2015;148:202–10. doi: 10.1378/chest.14-2608. [DOI] [PubMed] [Google Scholar]
- Sakka SG, Klein M, Reinhart K, Meier-Hellmann A. Prognostic value of extravascular lung water in critically ill patients. Chest. 2002;122:2080–6. doi: 10.1378/chest.122.6.2080. [DOI] [PubMed] [Google Scholar]
- Soldati G, Giunta V, Sher S, Melosi F, Dini C. “Synthetic” comets: a new look at lung sonography. Ultrasound Med Biol. 2011;37:1762–70. doi: 10.1016/j.ultrasmedbio.2011.05.024. [DOI] [PubMed] [Google Scholar]
- Zhang X. Identification of the Rayleigh surface waves for estimation of viscoelasticity using the surface wave elastography technique. J Acoust Soc Am. 2016;140:3619. doi: 10.1121/1.4966673. [DOI] [PMC free article] [PubMed] [Google Scholar]
- Zhang X, Osborn T, Kalra S. A noninvasive ultrasound elastography technique for measuring surface waves on the lung. Ultrasonics. 2016;71:183–88. doi: 10.1016/j.ultras.2016.06.012. [DOI] [PMC free article] [PubMed] [Google Scholar]
- Zhang X, Osborn T, Zhou B, Meixner D, Kinnick RR, Bartholmai B, Greenleaf JF, Kalra S. Lung Ultrasound Surface Wave Elastography: A Pilot Clinical Study. IEEE Trans Ultrason Ferroelectr Freq Control. 2017;64:1298–304. doi: 10.1109/TUFFC.2017.2707981. [DOI] [PMC free article] [PubMed] [Google Scholar]
- Zhang X, Qiang B, Hubmayr RD, Urban MW, Kinnick R, Greenleaf JF. Noninvasive ultrasound image guided surface wave method for measuring the wave speed and estimating the elasticity of lungs: A feasibility study. Ultrasonics. 2011;51:289–95. doi: 10.1016/j.ultras.2010.09.005. [DOI] [PubMed] [Google Scholar]
- Zhang X, Zhou B, Kalra S, Bartholmai B, Greenleaf J, Osborn T. An Ultrasound Surface Wave Technique for Assessing Skin and Lung Diseases. Ultrasound Med Biol. 2018;44:321–31. doi: 10.1016/j.ultrasmedbio.2017.10.010. [DOI] [PMC free article] [PubMed] [Google Scholar]


