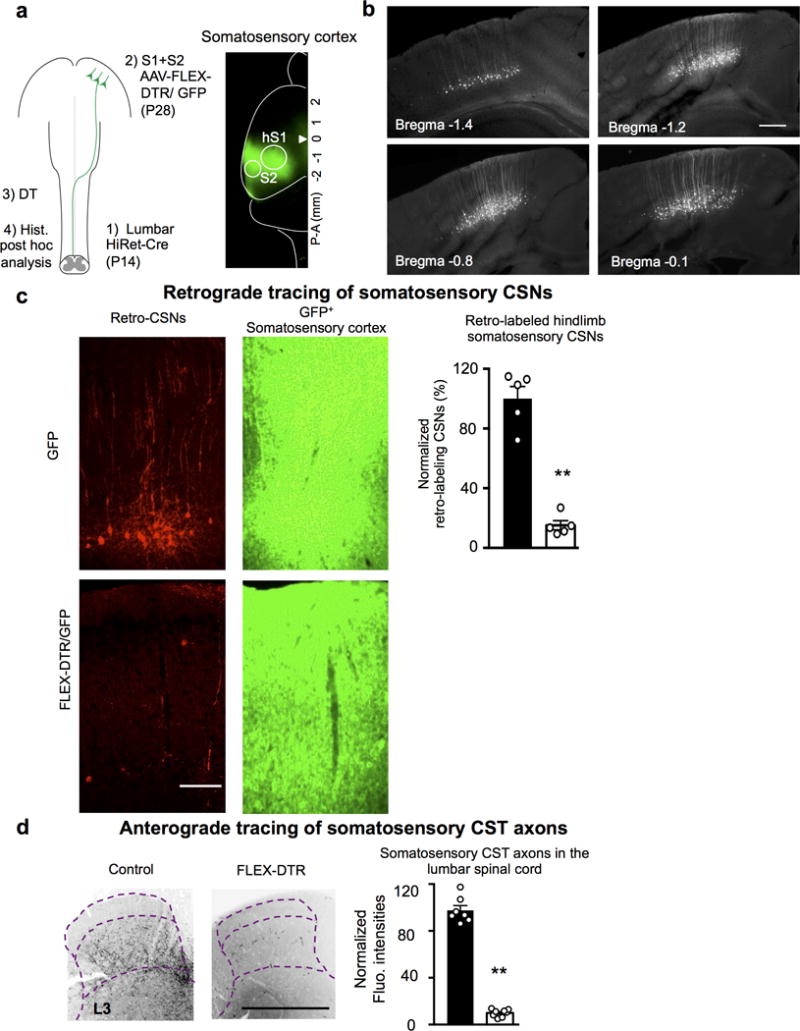
Extended Data Figure 3. Evaluation of ablation efficiency for somatosensory CSNs by P14 intraspinal injection.

a, Left: Schematic of regional CSN ablation by P14 lumbar (T13-L6) intraspinal injection. Right: Representative image (n=8 animals with similar results) of the cortex with GFP+ areas covering hindlimb S1/S2. b, Representative images (n=6 animals with similar results) of cortical sections showing retrogradely labeled hindlimb CSNs by a lumbar (T13-L6) intraspinal HiRet-GFP injection at P14. Scale bar: 100 μm. c, To assess ablation efficiency, at the end point, retrograde-targeting rAAV-mCherry was injected into the lumbar spinal cord in some animals. Representative images of cortical sections showing retrogradely labeled mCherry+ CSNs (left) within the GFP+ cortical areas (right) (S1/S2) in control or AAV-FLEX-DTR injected animals with quantification (normalized to those in controls as 100). **, P < 0.01 (P<0.0001), two-sided student’s t-test. n=5, 5 for control or AAV-FLEX-DTR injected mice, respectively. Scale bar: 100 μm. d, Representative images of transverse lumbar spinal cord sections showing residual CST axons labeled by GFP (from AAV-GFP co-injected to S1/S2 with AAV-FLEX-DTR) in control or S1/S2 CSN ablated animals with quantification. **, P < 0.01 (P<0.0001), two sided student’s t-test. n= 7,8 for control or AAV-FLEX-DTR injected mice, respectively. Scale bar: 500 μm. Data are presented as mean ± SEM.
