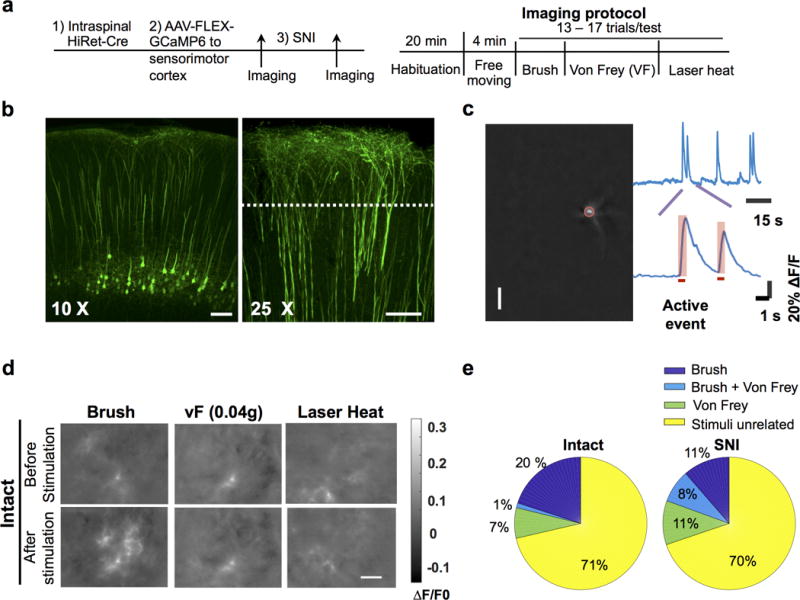
Extended Data Figure 5. Calcium imaging of CSN activity in intact and SNI mice.

a, Schematic of experimental procedures. b, Confocal fluorescence images of coronal brain sections showing specific expression of GCaMP6s in CSNs. Left, a 10X image showing labeled CSN soma and dendrites; Right, a 25X image showing the magnified view of apical dendritic trunks. Dotted line: the expected focal plane of head-mounted microscope. Scale bar: 100 μm. c, Procedures for identifying the active events of CSN dendrites. Left: an example of dendrites identified from a calcium movie by ICA analysis. The brightest spot in a dendritic tree, corresponding to the trunk (highlighted by a red circle), is used as region of interest for temporal signal analysis. The upper trace: the temporal signal of the dendrite. The bottom trace: magnified calcium events. The horizontal bar indicates the rising phase of the calcium event, which is associated with neuronal activation and used in subsequent analysis. d, Example calcium movie frames showing dendritic activities of hindlimb S1 CSNs upon different sensory stimuli in intact mice. In these examples, brush stimuli activated CSNs, whereas von Frey (0.04g) and laser heat did not. Calcium signals are expressed as ΔF/F0 (F0 is the time average of the whole movie). For b, d, the experiments were repeated independently 4 times with similar results. e, Pie charts showing the proportions of neurons responded to brush, Von Frey or both brush and Von Frey in pre-SNI and post-SNI conditions. Few neurons responded to both stimuli pre-SNI, but this overlapping proportion increased post-SNI, potentially reflecting disinhibited sensory pathways after SNI.
