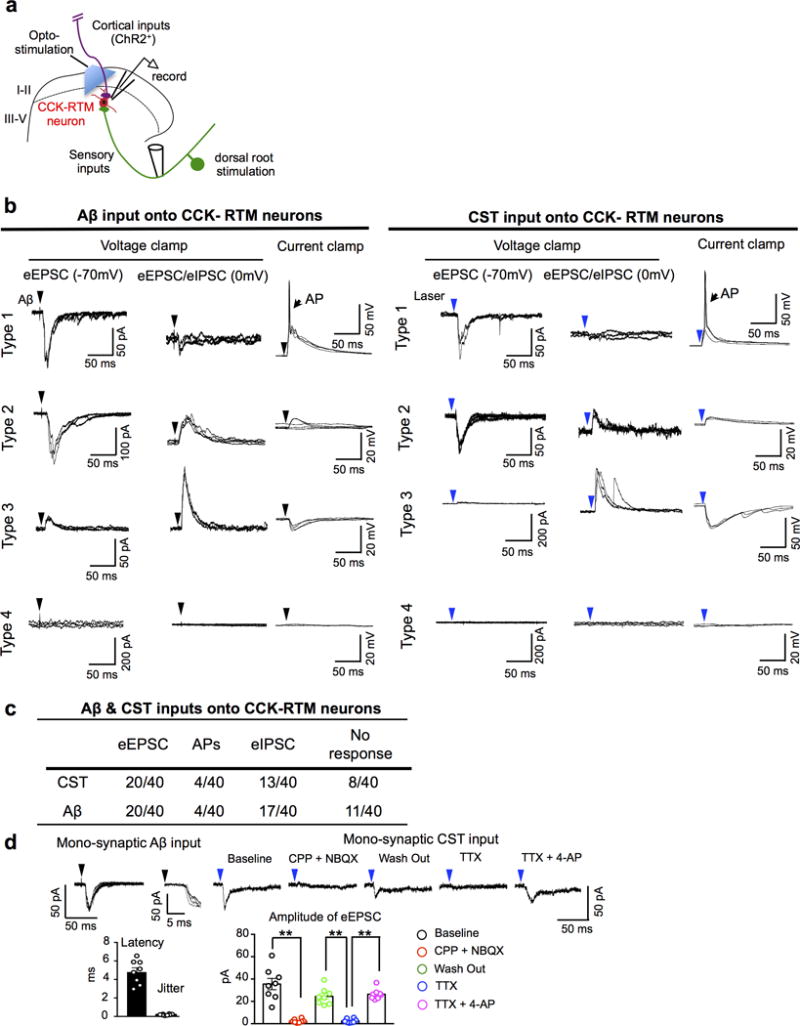
Extended Data Figure 9. Characterization Aβ and CST inputs onto CCK-RTM neurons.

a, Schematic of the stimulation–whole cell patch recording set-up for RTM-labeled CCK-RTM interneurons. CST axons labeled by AAV-ChR2-YFP were stimulated with a 473nm laser. A single dorsal root (L4-L6) was stimulated with a glass suction electrode. b, c, Representative consecutive traces (n=3) of Aβ (left) and opto-CST (right) stimulation evoked responses (b) and summarization (c) of whole cell patch clamping recordings on CCK-RTM interneurons. Three recording conditions were used: First, to detect evoked excitatory post-synaptic currents (eEPSCs), we held the membrane potential at −70 mV, which is the equilibrium potential of Cl− and thereby minimizes the flow of inhibitory post-synaptic currents (eIPSCs). Second, by holding the membrane potential at 0 mV, we examined the polysynaptic, inhibitory inputs (eIPSCs) on CCK- RTM interneurons. Third, we used current clamp mode to examine whether the stimulation drives action potential (AP) firing at the resting membrane potential. Type 1: CCK-RTM neurons only receive excitatory inputs, few of them generated AP output when Aβ or CST inputs were respectively stimulated; Type 2: CCK-RTM neurons receive both excitatory inputs and feed forward, inhibitory inputs, with no AP output; Type 3: CCK-RTM neurons only receive feed forward inhibition, with no AP output; Type 4: CCK-RTM neurons show no response at either voltage or current clamp recording. d, Left: Representative recording of an Ab (25 mA) dorsal root evoked EPSC at −70mV. Latency and jitter properties (magnified in inset) with quantifications (n=8 neurons) are consistent with mono-synaptic sensory connectivity. Right: Opto-stimulation evoked EPSC (averaged traces) at −70mV in the same cell shown on the left. The evoked EPSC was blocked by AMPA/NMDA antagonist [NBQX (5 mM)/CPP (20 mM)]. In addition, such opto-stimulation evoked EPSC was eliminated by TTX (0.5 mM), and reinstated by 4-AP (2 mM), indicating the monosynaptic connection between CST and CCK-RTM interneurons. Bar graph: Quantification of eEPSCs amplitude with drug administration. **, P < 0.0001 for all comparisons with **, One-way ANOVA followed by Bonferroni correction. n=8 neurons. Data are presented as means ± SEM.
