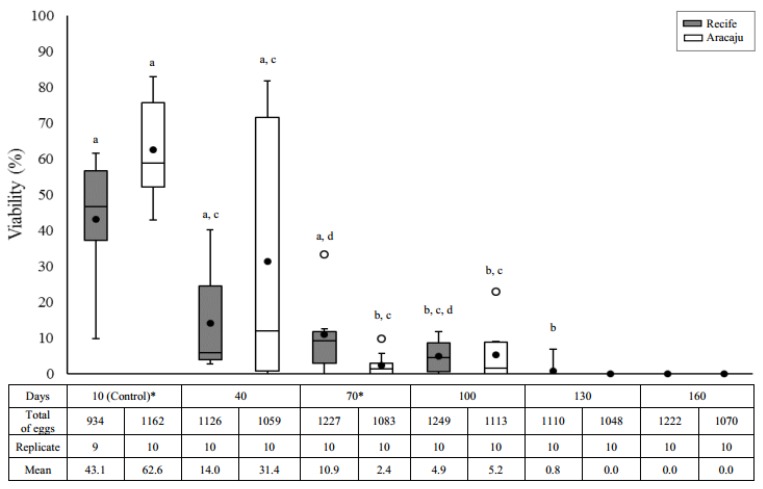
Figure 1.
Eclosion rate (%) as a function of the quiescent period in two populations of Aedes aegypti—Recife (Gray) and Aracaju (White). Replicates consist of approximately 100 eggs. The size of the boxes indicates the distance between the first (lower) and third (upper) quartiles, the central mark among them shows the median and the closed circle the mean; the bars indicates variability outside quartiles and outliers are plotted as empty circles. The letters indicate comparisons between the different quiescent periods within each population (Kruskal–Wallis with Student–Newman–Keuls test a posteriori). Different letters indicate significant differences at p ≤ 0.05. Asterisks indicate significative difference interpopulation in the same period of quiescence (Mann–Whitney U-test, p ≤ 0.05).

