Abstract
Gas exhaust emissions in vehicles are increasingly restrictive in EU and USA. Diesel engines are particularly affected by limitation in hydrocarbons and NOx concentrations. This work presents a screening of working electrode materials to develop a potentiometric sensor, with the most promising material to detect being C2H4 at 550 °C. The device consists of a dense 8YSZ (8 mol% Y2O3 stabilized ZrO2) disk as oxide-ion conducting electrolyte, whereas platinum is screen-printed in the back face as reference electrode. As working electrode, several materials such as Fe0.7Cr1.3O3, ZnCr2O4, Fe2NiO4, La0.8Sr0.2CrO3−δ (LSC), La0.8Sr0.2MnO3 (LSM), and NiO+5%wt Au were tested to detect C2H4. Sensor voltage was measured for several concentrations of C2H4 and CO as these are two of the major oxidizable compounds in a diesel exhaust gas. Fe0.7Cr1.3O3 was selected as the most promising material because of its response to C2H4 and CO. Not only is the response to the individual analytes important, but the C2H4 cross-sensitivity toward CO is also important. Fe0.7Cr1.3O3 showed a good performance to C2H4, with low cross-sensitivity to CO. In addition, when 0.16 ppm of phenanthrene is added, the sensor still has a slightly better response to C2H4 than to CO. Nevertheless, the sensor exposure to high concentrations (>85 ppm) of polycyclic aromatic hydrocarbons led to signal saturation. On the other hand, the operation in wet conditions induces lower sensor sensitivity to C2H4 and higher cross-sensitivity toward CO increase, i.e., the sensor response becomes similar for C2H4 and CO.
Keywords: hydrocarbon, ethylene, potentiometric, sensor, YSZ, electrochemical cell
1. Introduction
In the recent past years, the detection of hydrocarbons in exhaust gas of diesel cars has been increasing in importance because hydrocarbons, as well as other pollutants, are related to health issue problems in humans [1]. Then, both American and European legislators are reducing the permitted emissions limits of these pollutants [2,3,4]. Nowadays, there are restrictions because of the impossibility to detect HCs at lower concentrations. As a health issue, more restrictive legislations will be enforced if sensors able to detect HCs at this lower concentration level are technically and commercially available.
Potentiometric hydrocarbon sensors are the most appropriate candidates because of the high temperature of the exhaust gases and the gas composition and its simplicity and low cost. This type of sensor works as a solid-state electrochemical cell, where oxygen is reduced on the reference electrode and the oxygen ions generated diffuse through the solid electrolyte, e.g., 8YSZ (8 mol% Y2O3-stabilized ZrO2) and CGO (cerium gadolinium oxides), to oxidize the target gas (analyte) on the working electrode. Both electrodes—working and reference—are typically exposed to the same atmosphere, thus it is expected to behave as a mixed potential sensor. In fact, several reactions take place in each electrode and equilibrium is achieved. The reaction with the fastest kinetics rate will determine the electrochemical behavior of the sensor. On the other hand, the reference electrode could be exposed to another chamber where only oxygen in air is present.
Mixed potential sensors are preferred because both reference and working electrodes can be exposed to the same gas during operation. This makes the sensor suitable for exhaust automotive detection, e.g., detection of CO, NOx, HCs, NH3 [5,6,7]. In this sensor, the working electrode should have catalytic and sensing activity towards hydrocarbons, and low cross-sensitivity towards other gas components. On the other hand, the reference electrode should have catalytic activity toward oxygen reduction but must not convert other gas molecules (analytes). A proper selection of selective materials for the working and reference electrode is essential.
In the present work, several materials were screened to reach materials suitable for C2H4 detection with limited cross-sensitivity toward CO. The sensor device consists of a disk-shaped working solid 8YSZ membrane electrolyte [8,9,10] with a reference and a working electrode deposited on each face of the disk. Both electrodes are highly porous and were deposited by screen-printing. In literature, materials such as LaCoO3 [11], Nb2O5 [12], Au/8YSZ [8], SnO2 [13], Cr2O3 [13], La2CuO4 [14], TiO2(+Pd) [15], La1−xSrxCr1−yGayO3−δ [16], Pt/YSZ, MgAl2O4 [17], and NiO/Au [18]. Thus, as working electrodes, several perovskites and metal oxides are studied in this work, similar to those aforementioned. The cell voltage is measured in atmospheres containing C2H4 and CO, as they are the most abundant partially oxidized compounds in diesel exhaust gas. A 6% fixed O2 concentration is employed, while the influence of water and aromatics is also studied. The most promising material is selected for a full characterization for ethylene detection purposes. One novel approach of the present work is the study of the cross-sensitivity: The sensor is exposed to a fixed concentration of one analyte while concentration pulses of a second analyte are performed. In literature, the cross-sensitivity is usually evaluated comparing the sensitivity of each element individually. Taking into account that competitive reactions can take place simultaneously in each electrode, single-gas measurements could not be adequate to evaluate the cross-sensitivity. Porous platinum is usually employed as reference electrode due to its high catalytic activity, thermal stability, and common use in sensor electrodes [19].
2. Materials and Methods
2.1. Synthesis of Electrode Materials
The starting precursors for the synthesis of working electrode materials were commercial nitrates from Sigma Aldrich. A sol-gel chemical route was followed to obtain single-phase perovskites and spinels. First, stoichiometric quantities of nitrate precursors were fully dissolved in water. After that, citric acid (Sigma Aldrich, St. Louis, MO, USA) was added as a chelating agent to prevent partial segregation or precipitation of the metal components, and then ethylene glycol was added to promote the polymerization of the chelating agent and produce an organometallic polymer resin (in a molar ratio 1:2:4 with respect to nitrates solution, citric acid, and ethylene glycol, respectively). This complexation step is followed by dehydration at low temperature (up to 200 °C) and, finally, thermal decomposition in air of the precursors at 600 °C led to the formation of nanosized crystalline phases.
The obtained powders were sintered at 1350 °C for 10 h and milled to produce the target crystalline phase and a homogenous particle size. Then, the material was mixed with an organic binder (terpineol with a 6%wt ethylcellulose) in a 1:2 weight ratio and passed through a three-roller mill to produce screen-printing inks. As reference electrode, a commercial platinum powder (particle size 0.2 to 1.8 µm, from Mateck (Jülich, Germany)) is employed and the same procedure is followed to obtain the ink. Several materials, such as Fe0.7Cr1.3O3, ZnCr2O4, Fe2NiO4, La0.8Sr0.2CrO3−δ (LSC), La0.8Sr0.2MnO3−δ (LSM), and NiO+5%wt Au, are employed as working electrodes. The aim was to find a material that provides a good response to ethylene. Once the most promising material was selected, further analyses were carried out with this configuration.
Only in the case of the Fe0.7Cr1.3O3, as the material alone did not attach properly to the 8YSZ electrolyte, was the powder was mixed with 8YSZ powder (Tosoh, Tokyo, Japan) to ensure a good electrode attachment. For this purpose, both powders in a 1:1 volume ratio were ball-milled for 24 h. Furthermore, this leads to an increase of the triple phase boundary length, i.e., the reaction sites for the electrochemical hydrocarbon oxidation.
2.2. Fabrication of the Sensor Device
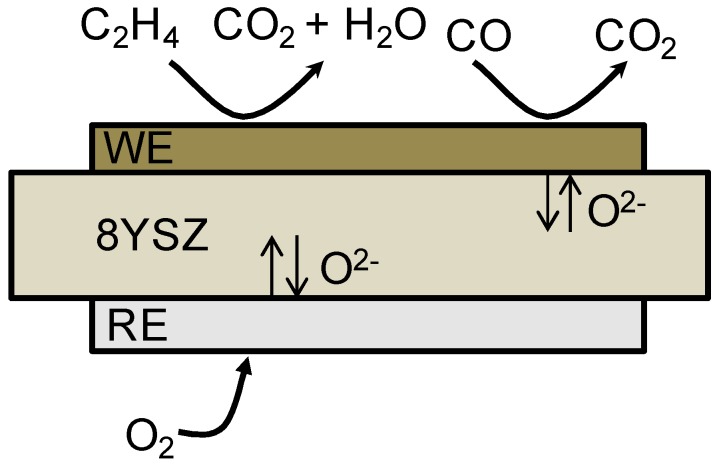
Individual 8YSZ disks of 20 mm of diameter were employed as electrolyte for the sensor assembly. The 8YSZ powder was uniaxially pressed at 50 kN into disks and then sintered at 1350 °C for 10 h. The device (Figure 1) is completed by screen-printing both circular electrodes (9 mm in diameter). First, the working electrode is printed and sintered at 1150 °C, and then platinum reference electrode is printed in the back face at the same conditions. Finally, a porous gold layer (mesh pattern) acting as current collector is screen-printed on top of the sintered working electrode, and sintered at 900 °C for 2 h. Gold is not expected to affect the sensor response as its catalytic activity depends critically on particle size. Bulk gold is chemically inert and is well known to be a very poor catalyst. It only has activity when employed as nanoparticle and at low temperatures [20,21]. Silver ink is employed to ensure contact between electrode and gold lead wires.
Figure 1.
Scheme of the sensor. The device consists of a dense 8YSZ electrolyte with platinum reference electrode (bottom) and distinct materials as working electrode (top).
2.3. Characterization of Materials and Sensor Device
A PANalytical Cubix fast diffractometer, using CuKα1 radiation (λ = 1.5406 Å) and an X′Celerator detector in Bragg–Brentano geometry was used for the identification of the crystalline phases. XRD patterns recorded in the 2θ° range from 10° to 90° were analyzed using X’Pert Highscore Plus software (Malvern Panalytical, Malvern, UK). SEM and energy-dispersive X-ray spectroscopy (EDS) using a ZEISS Ultra55 field emission scanning electron microscope (ZEISS, Oberkochen, Germany) was used to analyze fracture cross-sections of the sintered material before and after the permeation test. SEM backscattered electrons detector (BSD) was used to provide images with compositional contrast that differentiate grains and element distribution.
The voltage was determined by measuring the potential difference between the working and reference electrode when a zero-ampere current is applied. Gold wires and silver ink were used for contacting electrodes. The measurements were carried out at 550 °C and several concentrations of C2H4 and/or CO were measured (Figure S1). The cell voltage between both electrodes was detected by a multimeter, Keithley 3706 (Keithley Instrument, Cleveland, OH, USA). The response of the sensor (Vcell, mV) was defined as:
| Vcell = Va − Vb | (1) |
where Va and Vb are the voltage of the sensor exposed to (a) analytes with the background gas of 6% O2 (in Ar balance), and (b) background gas alone (6% O2 in Ar balance), respectively.
Mass flow controllers were used to obtain different gas mixtures. The total gas flow rate was 550 mL/min with a 6% of oxygen, varying C2H4 and CO concentrations and Ar as balance. Once the sample is stabilized at 550 °C, C2H4 or CO concentration was varied from 50 ppm (used as base gas) to 100, 150, and 200 ppm. The same test was performed for each gas with 200 ppm of the other gas as background in order to check cross-sensitivity. The same tests are performed with a background of water (3%) and polyaromatics: Toluene (28,947 ppm), methylnaphtalene (88 ppm), and phenanthrene (0.16 ppm). The gas flow is saturated in these elements at room temperature and then the selection of polyaromatics is limited to (1) their vapor pressure, and (2) the fact that polyaromatics concentration in exhaust gases is usually in the range from 0 to 10 ppm [22,23,24]. The aromatics are selected according to its vapor pressure to provide a concentration close to the desired range: One compound with a much higher concentration than expected in an exhaust gas (toluene), as it could be interesting to check the performance under extreme conditions, and two compounds closer to the range in exhaust gases (methylnaphthalene and phenanthrene).
Electrochemical impedance spectroscopy analysis was carried for each analyte at 200 ppm using an Autolab PGSTAT204 (Metrohm Autolab, Utrecht, The Netherlands) with a FRA32M module. The frequency was changed from 0.03 Hz to 1 MHz. Prior to the EIS measurement, open circuit voltage (OCV) is measured and this bias voltage is applied for the EIS measurement. The polarization resistance is measured as the difference between the high frequency and low frequency intercepts with the real axis of the impedance (Z’).
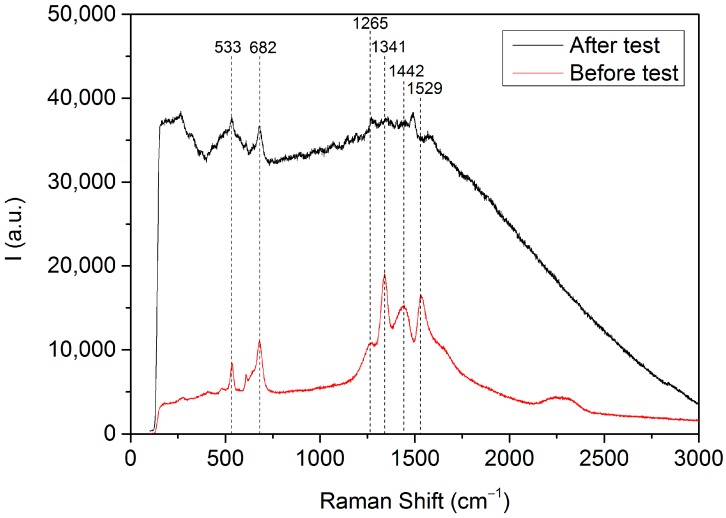
Coke formation on the surface of the electrode was studied by Raman spectroscopy. Raman spectrometer is equipped with a Leica DMLM microscope (Leica Microsystems, Wetzlar, Germany) and a 785-nm Ar+ ion laser as an excitation source. A 50× objective of 8-mm optical length was used to focus the depolarized laser beam on a spot of 3 μm in diameter. A charged coupled device (CCD) array detector was used for the Raman scattering collection.
3. Results and Discussion
3.1. Microstructural Characterization
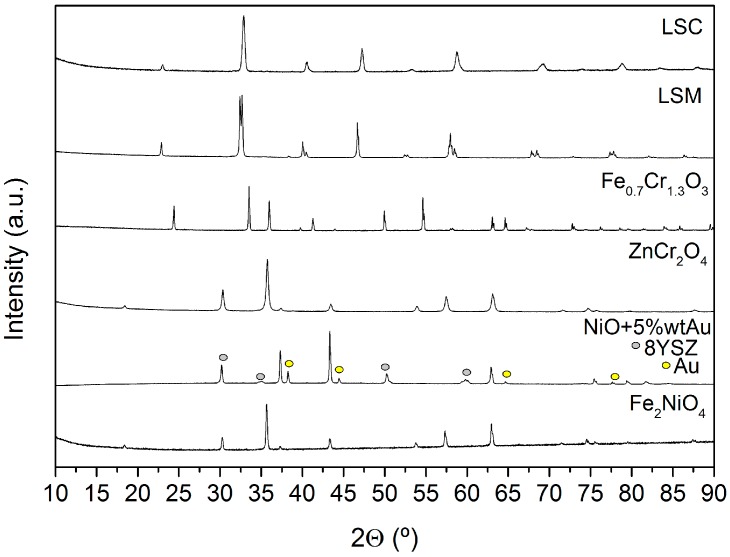
Analysis of the X-ray diffraction (XRD) patterns (Figure 2) of the different as-sintered electrode powders confirms that the target crystalline phase was obtained for each material. Diffraction peaks corresponding to secondary phases are not observed.
Figure 2.
X-ray diffraction patterns of the materials studied at room temperature once they are synthesized.
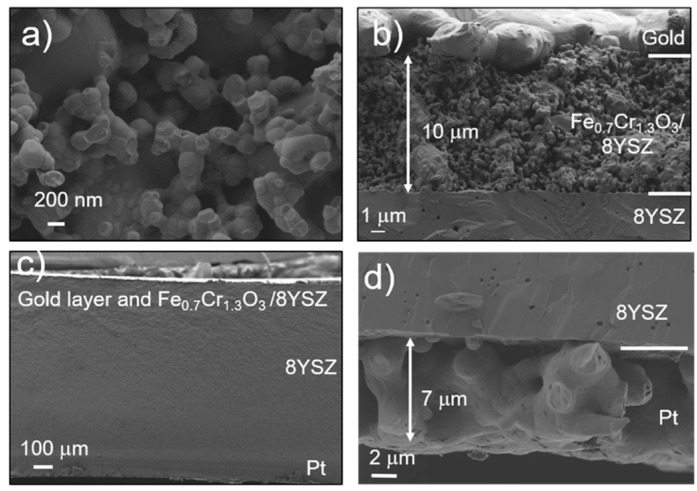
SEM analysis (Figure 3 and Figure S2 in Supporting Information) shows the structural and morphologic characteristics of the built sensor device. The fracture cross-section of the porous working electrode (Figure 3a,b) reveals a distinct grain size distribution for Fe0.7Cr1.3O3 and 8YSZ, i.e., Fe0.7Cr1.3O3 grains are bigger. Nevertheless, a homogeneous distribution of grains is reached throughout the 10 µm-thick electrode. No reaction interfaces are detected between electrodes and electrolyte. Neither reaction between the phases nor impurities on the grain boundaries are detected (Figure 3b–d). The reference electrode is a 7 µm-platinum layer made of highly-coarsened grains with good adhesion to the electrolyte. Figure 3c shows a view of the complete device with a ~1mm-thick dense 8YSZ electrolyte. For all electrodes with different compositions, a proper attachment of electrodes to the 8YSZ substrate was achieved, excepting La0.8Sr0.2CrO3−δ (LSC) electrode that was detached.
Figure 3.
SEM image of the device cross-section corresponding to FeCr2O4/8YSZ as WE and Pt as RE. (a) WE electrode cross-section with FeCr2O4 and 8YSZ grains. (b) Interface WE-electrolyte where a good attachment of the layer can be observed. Gold collector layer at the top as well as FeCr2O4 and 8YSZ grain distribution can be observed. (c) Complete device Fe0.7Cr1.3O3/8YSZ || 8YSZ || Pt can be observed. (d) Sintered platinum reference can be observed.
3.2. Electrochemical Characterization
In the presence of CO, hydrocarbons, other reducing agents, and oxygen, several oxidation and reduction reactions take place at the interface among electrode, electrolyte, and gas phase (mixed potential sensor). In a potentiometric sensor, a zero-current is applied. Thus, competitive reactions take place in both electrode and therefore, kinetics will be a key point. When a steady-state between the anodic reaction (Equation (3) or Equation (4)) and the cathodic reaction Equation (2) is achieved, a mixed-potential is established. The difference between the mixed-potential established in both electrodes will give rise to the voltage of the cell [25]. Then, the sensor performance can be enhanced with a proper selection of the materials: Selective material to the desired target analyte in the WE, and a material active to oxygen as RE (Figure 1). Note that both electrodes are exposed to the same gas mixture, i.e., RE is not exposed to a reference gas (air). In addition, heterogeneous catalytic conversion in the WE of the target gases (analytes) with locally adsorbed O2 can occur at the same time Equations (5) and (6). This reaction will compete with the (sensing) electrochemical reactions and affect the sensor response if the electrode is not active towards electrochemical oxidation of C2H4. These are the specific reactions taken into account [26].
| (2) |
| (3) |
| (4) |
| (5) |
| (6) |
In a first set of experiments, several perovskites, spinels, and other oxides were studied employing platinum as reference electrode. The aim is to identify promising materials for hydrocarbon sensing applications in an environment such as diesel exhaust. Thus, a high response to C2H4 and a low response to CO are required. Sensors were exposed to several concentrations of each gas. In a first screening, the sensors were exposed to a concentration range from 200 to 1000 ppm and, in a second step, the sensors were exposed to a concentration range from 50 to 200 ppm.
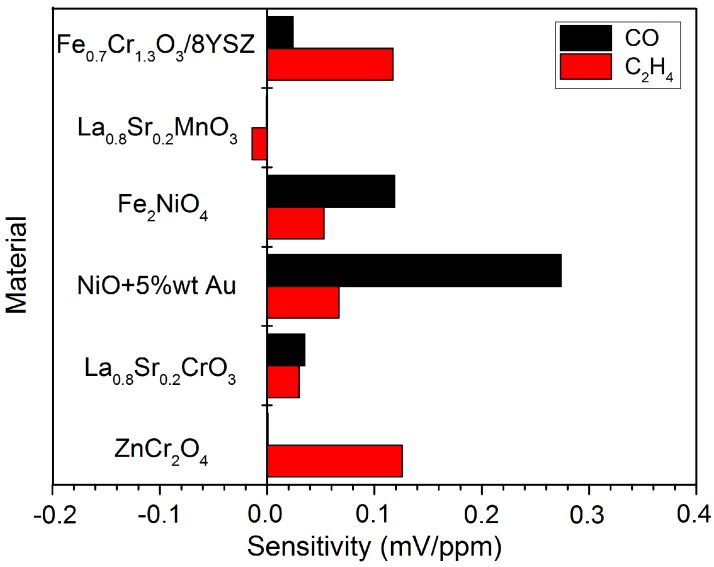
As the sensor responses are linear with the analyte concentration within the studied range, the sensor sensitivity (Figure 4) is defined as the slope dVcell/dCanalyte (mV/ppm) and calculated as a linear regression. NiO+5%wt Au, FeNiO4, and NiO show higher response to CO rather than C2H4, and were further investigated. LSC and LSM show low response with low sensitivity toward C2H4. ZnCr2O4 and Fe0.7Cr1.3O3 exhibit promising C2H4 sensitivity, i.e., high response to C2H4 and low response to CO. Nevertheless, ZnCr2O4 response is not stable with time despite providing the highest response to C2H4. Thus, the sensor response is not reproducible and not appropriate for long-term operation. This could be due to an ageing effect, e.g., sintering and coking (Figure S3 in Supporting Information). Thus, Fe0.7Cr1.3O3 is a priori the most promising sensing material because of the stable response and appropriate response to C2H4.
Figure 4.
Sensor sensitivity (mV/ppm) to C2H4 (red) and CO (black) individually for several materials used as working electrode. The sensor sensitivity is defined as Vcell/analyte concentration (mV/ppm) in the linear range of sensor response and calculated as a linear regression. ZnCr2O4 and Fe2NiO4 are evaluated in the range 200–1000 ppm, while the rest of the materials (Fe0.7Cr1.3O3, LSC, LSM, and NiO+5%wt Au) are evaluated in the range 50–200 ppm.
The mixture of Fe0.7Cr1.3O3 with 8YSZ ensures good attachment to the electrolyte and enables to enlarge the number of active sites available for the electrochemical hydrocarbon oxidation, i.e., the triple phase boundary (TPB) length. Therefore, apart from the intrinsic catalytic activity of the electrode material, the sensor performance can be boosted because of the increment of the TPB area. Then, in order to disclose if the good performance of Fe0.7Cr1.3O3 is due to the catalytic activity of the material itself or because of the increment of the TPB area, another tested material (LSC) is mixed with 8YSZ (1:1 volume ratio) and exposed to C2H4. When compared to the bare LSC electrode, no significant effect is observed (Figure S4) and therefore the good performance of the Fe0.7Cr1.3O3-8YSZ can be attributed to the intrinsic Fe0.7Cr1.3O3 activity.
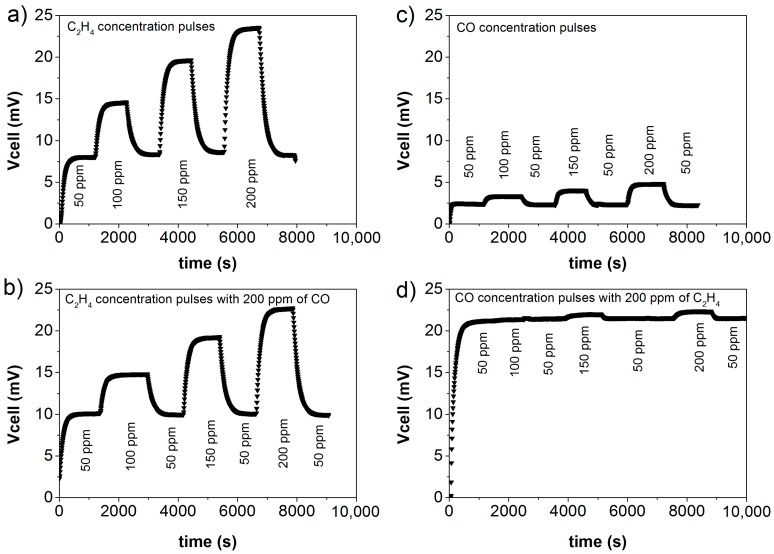
Sensors based on 8YSZ-Fe0.7Cr1.3O3 working electrode were further characterized by exposing them to C2H4 and CO mixtures with several concentrations. Specifically, a background concentration (200 ppm) of one analyte is set when varying the concentration of the other analyte. Figure 5 shows the recorded Vcell as a function of time for series of stepwise changes in gas composition, and illustrates high response sensitivity to C2H4 (Figure 5a), together with low cross-sensitivity toward CO (Figure 5b). Indeed, the sensor hardly responds to changes in CO concentration when C2H4 (at 200 ppm level) is present in the gas. Further, this figure reveals that the reproducibility and stability of the signal upon equilibration, while response kinetics is rather fast. Additionally, the sensor baseline is close to zero and stable without any drift observed (Figure S5).
Figure 5.
Response curves for changes in concentration of: (a) C2H4, (b) C2H4 with 200 ppm CO background, (c) CO, and (d) CO with 200 ppm C2H4 background. Each change in concentration has 20 min duration and goes from 50 ppm to 100, 150, and 200 ppm. The sensor consists of Fe0.7Cr1.3O3/8YSZ as WE and Pt as RE, at 550 °C with 6% of O2.
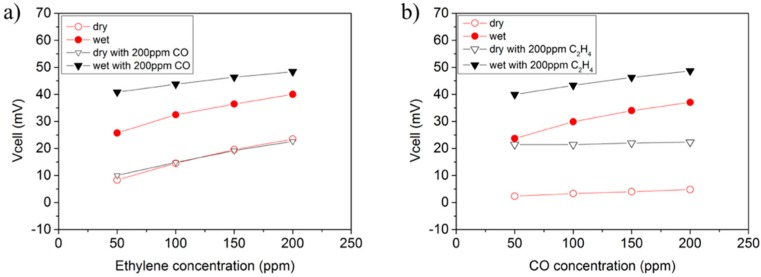
Figure 6 plots the equilibrium Vcell as a function of CO/C2H4 concentration. In dry conditions (open symbols in Figure 6), the sensor response (Vcell) is proportional to C2H4 concentration regardless of the CO background, whereas the response to CO changes is nearly negligible. The same study was repeated by adding 3% of water (saturation of inlet gases at room temperature). The addition of water (solid symbols in Figure 6) strongly increases the sensitivity of CO while slightly affects sensitivity to C2H4 and, consequently, leads to higher cross-sensitivity to CO (Table 1). Two effects may be responsible for this behavior: (1) Water could promote CO conversion by removing surface coke from surface or avoiding its formation; and (2) water enables the formation of H2 on the surface of both WE and RE (Pt) via water gas-shift reaction (WGS, Equation (7)). The electrochemical oxidation of the locally-built H2 on the electrodes is kinetically more favored than CO oxidation and this may have a notable impact in the sensor response to CO.
| (7) |
Figure 6.
EMF Sensor response as a function of analyte concentration for: (a) C2H4 and (b) CO. The effect of a background concentration (200 ppm) of the second analyte and 3% of water is also depicted. Each point is the main of the respective 20 min change in response.
Table 1.
Sensitivity of the sensor to C2H4, carbon monoxide, and each analyte with 200 ppm of background of the second analyte for dry and wet (3%) conditions, as well as for 0.16 ppm of C14H10. Sensor sensitivity is defined as Vcell/analyte concentration (mV/ppm) and calculated as a linear regression.
| Analyte | Dry Sensitivity (mV/ppm) | Wet Sensitivity (mV/ppm) | C14H10 Sensitivity (mV/ppm) |
|---|---|---|---|
| C2H4 | 1.2 × 10⁻¹ | 9.4 × 10⁻² | 9.0 × 10⁻² |
| CO | 2.4 × 10⁻² | 8.8 × 10⁻² | 7.1 × 10⁻² |
| C2H4 with 200 ppm of CO | 8.4 × 10⁻² | 5.1 × 10⁻² | 6.1 × 10⁻² |
| CO with 200 ppm of C2H4 | 6.6 × 10⁻³ | 5.8 × 10⁻² | 5.1 × 10⁻² |
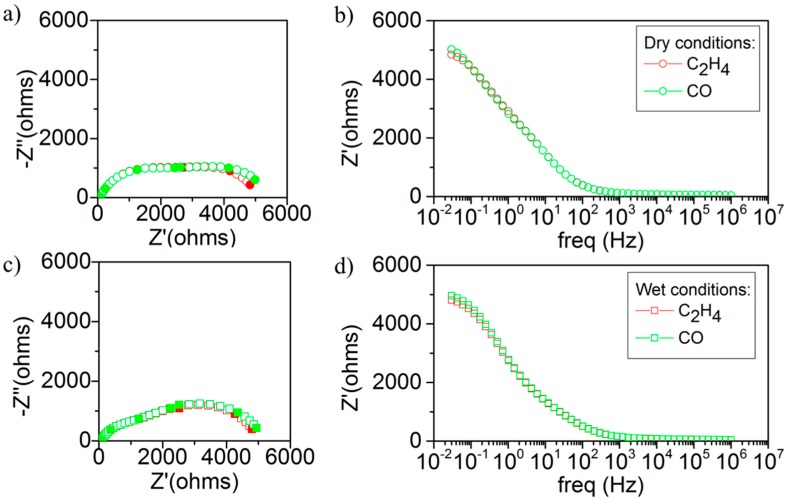
Figure 7 displays the electrochemical impedance spectra (Nyquist and Bode plots, frequency range 0.03 Hz to 1 MHz) of the sensor exposed to 200 ppm of C2H4 or CO, both in dry and wet conditions. Electrochemical impedance spectroscopy (EIS) analysis provides information related with the processes taking place in the device (ionic transport, solid-solid interfacial resistance, gas-solid surface reactions) since they may exhibit distinct characteristic frequencies. For the present case, the variation of the analyte concentration or type may induce changes in the impedance contributions only related to gas-solid surface reactions and appearing at the lowest frequencies. The larger the impedance, the slower (or less favored) the specific surface reaction (oxidation of analytes in this case) is. Although the results are rather similar for both analytes, there is a slight difference at low frequencies for both analytes (impedance is slight lower in C2H4) that can be linked to the results observed in the potentiometric characterization. In dry conditions (Figure 7a,b), the shape of the arc at high frequencies is similar for both analytes, therefore the ionic transport remains almost unaffected. On the other hand, the response impedance (Z’) at low frequencies is sensitive to changes in the gas composition and this suggests that the sensor response depends on electrochemical reactions at the surface of Fe0.7Cr1.3O3/8YSZ and interface with 8YSZ electrolyte [27,28,29,30,31]. Specifically, the low frequency response is higher in CO than in C2H4 (Table 2) and is in line with the observed sensor behavior in dry conditions. In wet conditions (Figure 7c,d), the impedance arc at low frequency is practically unaltered in C2H4 but it is reduced in CO (Table 2). Water has an effect on the electrochemical reactions taking place in both the electrode and electrode-electrolyte interface, as observed previously in the potentiometric characterization. Thus, the electrochemical CO evolution is ameliorated on the electrode surface thanks to the presence of water, likely mediated by locally formed H2 (Equation (7)). Therefore, the decrease in polarization resistance (Rp) results in higher sensitivity to CO and therefore in loss of the desired sensor performance to C2H4.
Figure 7.
Impedance spectrometry study in dry and wet conditions for Ar+6%O2, 200 ppm C2H4, and 200 ppm CO. (a) Nyquist plot and (b) Bode plot in dry conditions, and (c) Nyquist plot and (d) Bode plot in wet conditions with a 3% of H2O.
Table 2.
Polarization resistance (Rp) as a function of analyte (C2H4 and carbon monoxide) in dry and wet conditions. In both conditions the concentration of the analytes are 200 ppm.
| Analyte (200 ppm) | Rp (ohm) | |
|---|---|---|
| dry | C2H4 | 5112.52 |
| CO | 5548.20 | |
| wet | C2H4 | 5079.02 |
| CO | 5257.03 |
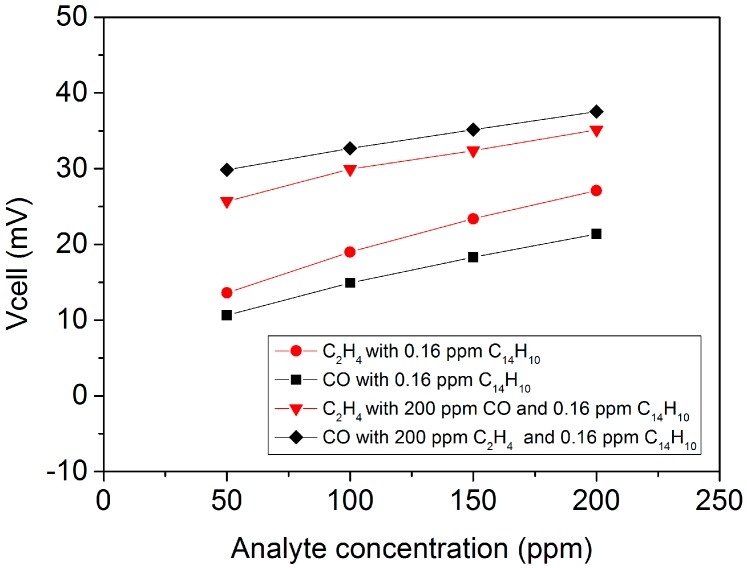
As a final test of the sensor based on 8YSZ-Fe0.7Cr1.3O3 working electrode, the effect of the exposure to minor amounts of different aromatic hydrocarbons on the potentiometric response was studied in dry conditions (Table 3), as they are potential candidates in exhaust gases that can interfere in the sensor response to C2H4. For this purpose, the gas feed was separately saturated at room temperature with toluene (28,947 ppm), methylnaphtalene (88 ppm), and phenanthrene (C14H10-0.16 ppm) at room temperature. The sensor shows high sensitivity to C14H10 while the response is still slightly higher in C2H4 than in CO (Table 1). However, the difference in response becomes small when one analyte is evaluated in the presence of 200 ppm of the second analyte (Figure 8 and Table 1), i.e., the sensor response to C2H4 is practically lost in presence of C14H10. Similarly, toluene addition leads to high cross-sensitivity toward CO and C2H4, while toluene response signal is superimposed over both CO and C2H4 responses, although it should be taken into consideration that toluene and methylnaphtalene concentration is out of the range of exhaust gases. Additionally, the sensitivity of the sensor toward poly-aromatics seems to increase with the number of rings. This could be related to the higher reactivity of larger aromatics.
Table 3.
Sensor response to several conditions: Ar+6%O2 base gas, toluene, methylnaphtalene, phenantrene, C2H4, and carbon monoxide. Concentration, cell voltage, and sensor sensitivity as mV/ppm are provided.
| Compound | Cell Voltage (mV) | Concentration (ppm) | Sensitivity (mV/ppm) |
|---|---|---|---|
| Ar+6%O2 | 0.03 | - | - |
| C7H8 | 119.16 | 28,947.37 | 0.004 |
| C11H10 | −158.75 | 88.16 | −1.80 |
| C14H10 | 0.23 | 0.16 | 1.44 |
| C2H4 | 23.49 | 200 | 0.12 |
| CO | 4.82 | 200 | 0.02 |
Figure 8.
Sensor response when 0.16 ppm of phenantrene is added as a function of analyte concentration, C2H4 in red, and CO in black. The effect of background concentration (200 ppm) of the second analyte is depicted. Each point is the average of the respective 20 min change in response.
Regarding sensor aging upon test in aromatics, a single exposure to one of these aromatics gives rise to changes in response when newly measured without aromatics, specifically the sensitivity decays. If a regeneration step is done (sensor calcination at 600 °C with air), C2H4 and CO response recover the original behavior. This suggests that coke may be formed on the surface of the electrodes. The iron spinel oxide provides Lewis acidic sites that have a catalytic activity toward aromatics oxidation and oligomerization [32]. Iron oxide is more affected by aging and coke formation leading to a reduction of its catalytic activity [33]. Thus, coke effect should be removed and probably this could be due to a surface modification when aromatics are partly oxidized during sensor operation. The sensor was exposed to working conditions at 550 °C for 24 days and negligible ageing effect was noticed on the sensor response.
Thus, as coke formation is suspected to happen after exposure to aromatics, Raman spectroscopy analyses were performed over the Fe0.7Cr1.3O3/8YSZ electrode layer with a gold collector before and after the test in order to check the coke formation. Raman spectroscopy is a technique that enables one to identify the potential presence of surface species related to distinct carbon forms. Figure 9 depicts both Raman spectra where the peaks corresponding to the spinel phase can be noticed at band values of 533 and 682 cm−1 [34,35,36]. Another common peak corresponding to Fe3O4 can be detected before and after at 1341 cm−1 [36]. The Raman spectra of the tested sample present more peaks in the region from 1200 to 1600 cm−1 than the untested sample. Amorphous carbon (1340–1400 cm−1 and 1540–1600 cm−1 [37]) and carbon nanotubes (1562 cm−1 [38]) are expected to appear in this region. In addition, there is much more fluorescence when the tested sample is measured. This may indicate the presence of complex aromatic molecules adsorbed on the electrode surface and this is in agreement with the lack of sensitivity after exposure to the aforementioned aromatics (and its recovery after a regeneration step). Despite these considerations, carbon fingerprint is here not detected to the limit of this technique.
Figure 9.
Raman spectra of the Fe0.7Cr1.3O4/8YSZ electrode layer with a gold collector after and before test.
Regarding NO2 cross sensitivity on the RE, Pt is well known for its catalytic activity toward O2 at mid-high temperatures. Although NO2 is a common compound in diesel exhaust gas, according to other potentiometric sensors for selective NO2 detection, the catalytic activity of Pt to oxygen redox reaction is expected to be much higher than the NO2 reduction reaction [7,39,40,41]. Thus, there should not be a significant effect on the sensor response, although experimental assays are required.
4. Conclusions
Fe0.7Cr1.3O3 was identified as a suitable working electrode material for C2H4 detection in exhaust gas streams that contain oxidizable gases together with molecular oxygen. The tested sensor cell comprised a disk-shaped solid oxide-ion conducting electrolyte (8YSZ) coated with the working electrode and a reference electrode (Pt) on the other side. This cell assembly Fe0.7Cr1.3O3/8YSZ || 8YSZ || Pt provides an adequate response to C2H4, with low cross-sensitivity to CO at 550 °C. This makes the sensor suitable for sensing in conditions like exhaust gases from diesel cars. The study using wet gas streams or adding significant concentration of polycyclic aromatic hydrocarbons (PAHs) revealed the need of further adjusting of surface properties of electrodes to keep high response towards C2H4 and signal stability, regardless of the presence of variable amounts of water or PAHs in ppm level. In the case of water, the activity toward water gases-shift reaction should be minimized in both working and reference electrodes.
Acknowledgments
Sensata Technologies Holland B.V. is kindly acknowledged. The authors want also acknowledge the Electron Microscopy Service from the Universitat Politècnica de València for their support in the SEM analysis performed in this work.
Supplementary Materials
The following are available online at http://www.mdpi.com/1424-8220/18/9/2992/s1, Figure S1: Experimental set-up used to measure sensor response, Figure S2: SEM image of the device cross-section showing the interface WE-electrolyte corresponding to (a) FeNiO4, (b) ZnCr2O4, (c) LSM and (d) LSC. On the other hand, (e) shows the NiO+5%wt Au surface, Figure S3: Response curves for changes in concentration of ZnCr2O4 with fresh ink and 1 month ink: (a) response to 400 ppm C2H4 with fresh paste, (b) response to changes in concentration from 50 to 200 ppm of C2H4. The sensor consists of ZnCr2O4 as WE and Pt as RE and at 550 °C with a 6% of O2 and balanced with Ar. A lower sensor response can be observed after 1 month of paste storage. Thus, the material reproducibility does not fit the requirements about stability and reproducibility with time, Figure S4: Response transient to C2H4 of the sensor employing as WE: (a) LSC and (b) LSC/8YSZ (1:1 vol.), Figure S5: Sensor baseline when exposed to 6% of O2 balanced with argon at 550 °C. The sensor consists of Fe0.7Cr1.3O3/8YSZ as WE and Pt as RE.
Author Contributions
Conceptualization, J.M.S. and F.T.-R.; Methodology, F.T.-R.; Investigation, J.M.S. and F.T.-R.; Resources, J.M.S.; Data Curation, F.T.-R.; Writing-Original Draft Preparation, J.M.S. and F.T.-R.; Writing-Review & Editing J.M.S. and F.T.-R.; Supervision, J.M.S.; Funding Acquisition, J.M.S.
Funding
This research was funded by Spanish government (AP-2003-03478, SEV-2016-0683 and ENE2014-57651).
Conflicts of Interest
The authors declare no conflict of interest. The funders had no role in the design of the study; in the collection, analyses, or interpretation of data; in the writing of the manuscript, and in the decision to publish the results.
References
- 1.World Health Organization . In: Health Effects of Transport-Related Air Pollution. Krzyzanowski M., Kuna-Dibbert B., Schneider J., editors. World Health Organization, Regional Office for Europe; Denmark, Germany: 2005. [Google Scholar]
- 2.Emission Standards: Europe: Cars and Light Trucks. [(accessed on 28 June 2018)]; Available online: https://dieselnet.com/standards/eu/ld.php#stds.
- 3.Sekhar P.K., Subramaniyam K. Electrical characterization of a mixed potential propylene sensor. Sens. Actuators B Chem. 2013;188:367–371. doi: 10.1016/j.snb.2013.07.003. [DOI] [Google Scholar]
- 4.Reşitoğlu İ.A., Altinişik K., Keskin A. The pollutant emissions from diesel-engine vehicles and exhaust aftertreatment systems. Clean Technol. Environ. Policy. 2015;17:15–27. doi: 10.1007/s10098-014-0793-9. [DOI] [Google Scholar]
- 5.Guth U., Zosel J. Electrochemical solid electrolyte gas sensors—Hydrocarbon and NOx analysis in exhaust gases. Ionics. 2004;10:366–377. doi: 10.1007/BF02377996. [DOI] [Google Scholar]
- 6.Fadeyev G., Kalakin A., Demin A., Volkov A., Brouzgou A., Tsiakaras P. Electrodes for solid electrolyte sensors for the measurement of CO and H2 content in air. Int. J. Hydrogen Energy. 2013;38:13484–13490. doi: 10.1016/j.ijhydene.2013.07.094. [DOI] [Google Scholar]
- 7.Yoo J., Chatterjee S., Wachsman E.D. Sensing properties and selectivities of a WO3/YSZ/Pt potentiometric NOx sensor. Sens. Actuators B Chem. 2007;122:644–652. doi: 10.1016/j.snb.2006.07.024. [DOI] [Google Scholar]
- 8.Romanytsia I., Viricelle J.P., Vernoux P., Pijolat C. Application of advanced morphology Au–X (X = YSZ, ZrO2) composites as sensing electrode for solid state mixed-potential exhaust NOx sensor. Sens. Actuators B Chem. 2015;207:391–397. doi: 10.1016/j.snb.2014.10.017. [DOI] [Google Scholar]
- 9.Iio A., Ikeda H., Anggraini S.A., Miura N. Potentiometric YSZ-based oxygen sensor using BaFeO3 sensing-electrode. Electrochem. Commun. 2014;48:134–137. doi: 10.1016/j.elecom.2014.09.004. [DOI] [Google Scholar]
- 10.Plashnitsa V.V., Elumalai P., Fujio Y., Miura N. Zirconia-based electrochemical gas sensors using nano-structured sensing materials aiming at detection of automotive exhausts. Electrochim. Acta. 2009;54:6099–6106. doi: 10.1016/j.electacta.2008.12.040. [DOI] [Google Scholar]
- 11.Brosha E.L., Mukundan R., Brown D.R., Garzon F.H., Visser J.H., Zanini M., Zhou Z., Logothetis E.M. CO/HC sensors based on thin films of LaCoO3 and La0.8Sr0.2CoO3−δ metal oxides. Sens. Actuators B Chem. 2000;69:171–182. doi: 10.1016/S0925-4005(00)00543-8. [DOI] [Google Scholar]
- 12.Chevallier L., Dibartolomeo E., Grilli M., Traversa E. High temperature detection of CO/HCs gases by non-Nernstian planar sensors using Nb2O5 electrode. Sens. Actuators B Chem. 2008;130:514–519. doi: 10.1016/j.snb.2007.09.056. [DOI] [Google Scholar]
- 13.Yamaguchi M., Anggraini S.A., Fujio Y., Sato T., Breedon M., Miura N. Stabilized zirconia-based sensor utilizing SnO2-based sensing electrode with an integrated Cr2O3 catalyst layer for sensitive and selective detection of hydrogen. Int. J. Hydrogen Energy. 2013;38:305–312. doi: 10.1016/j.ijhydene.2012.10.049. [DOI] [Google Scholar]
- 14.MacAm E.R., White B.M., Blackburn B.M., Di Bartolomeo E., Traversa E., Wachsman E.D. La2CuO4 sensing electrode configuration influence on sensitivity and selectivity for a multifunctional potentiometric gas sensor. Sens. Actuators B Chem. 2011;160:957–963. doi: 10.1016/j.snb.2011.09.012. [DOI] [Google Scholar]
- 15.Fujio Y., Sato T., Miura N. Sensing performance of zirconia-based gas sensor using titania sensing-electrode added with palladium. Solid State Ionics. 2014;262:266–269. doi: 10.1016/j.ssi.2013.08.028. [DOI] [Google Scholar]
- 16.Zosel J., Müller R., Vashook V., Guth U. Response behavior of perovskites and Au/oxide composites as HC-electrodes in different combustibles. Solid State Ionics. 2004;175:531–533. doi: 10.1016/j.ssi.2004.01.074. [DOI] [Google Scholar]
- 17.Mori M., Sadaoka Y., Nakagawa S., Kida M., Kojima T. Development of ethanol and toluene sensing devices with a planar-type structure based on YSZ and modified Pt electrodes. Sens. Actuators B Chem. 2013;187:509–513. doi: 10.1016/j.snb.2013.03.005. [DOI] [Google Scholar]
- 18.Elumalai P., Plashnitsa V.V., Fujio Y., Miura N. Highly sensitive and selective stabilized zirconia-based mixed-potential-type propene sensor using NiO/Au composite sensing-electrode. Sens. Actuators B Chem. 2010;144:215–219. doi: 10.1016/j.snb.2009.10.063. [DOI] [Google Scholar]
- 19.Fergus J.W. Sensing mechanism of non-equilibrium solid-electrolyte-based chemical sensors. J. Solid State Electrochem. 2011;15:971–984. doi: 10.1007/s10008-010-1046-4. [DOI] [Google Scholar]
- 20.Haruta M. When Gold Is Not Noble: Catalysis by Nanoparticles. Chem. Rec. 2003;3:75–87. doi: 10.1002/tcr.10053. [DOI] [PubMed] [Google Scholar]
- 21.Shaikhutdinov S.K., Meyer R., Naschitzki M., Baümer M., Freund H.-J. Size and support effects for CO adsorption on gold model catalysts. Catal. Lett. 2003;86:211–219. doi: 10.1023/A:1022616102162. [DOI] [Google Scholar]
- 22.De Souza C.V., Corr S.M. Polycyclic aromatic hydrocarbon emissions in diesel exhaust using gas chromatographye-mass spectrometry with programmed temperature vaporization and large volume injection. Atmos. Environ. 2015;103:222–230. doi: 10.1016/j.atmosenv.2014.12.047. [DOI] [Google Scholar]
- 23.Miguel A.H., Kirchstetter T.W., Harley R.A., Hering S.V. On-Road Emissions of Particulate Polycyclic Aromatic Hydrocarbons and Black Carbon from Gasoline and Diesel Vehicles. Environ. Sci. Technol. 1998;32:450–455. doi: 10.1021/es970566w. [DOI] [Google Scholar]
- 24.Storey J.M., Lewis S.A., West B.H., Huff S.P., Sluder C.S., Wagner R.M., Domingo N., Thomas J., Kass M. Hydrocarbon Species in The Exhaust of Diesel Engines Equipped with Advanced Emissions Control Devices. [(accessed on 20 October 2017)]; Final Report CRC Project No. AVFL-10b-2. Available online: www.crcao.org/reports/recentstudies2005/AVFL-10b-2%20Final%20Report%20January%2031%202005.pdf.
- 25.Miura N., Sato T., Anggraini S.A., Ikeda H., Zhuiykov S. A review of mixed-potential type zirconia-based gas sensors. Ionics. 2014;20:901–925. doi: 10.1007/s11581-014-1140-1. [DOI] [Google Scholar]
- 26.Striker T., Ramaswamy V., Armstrong E.N., Willson P.D., Wachsman E.D., Ruud J.A. Effect of nanocomposite Au–YSZ electrodes on potentiometric sensor response to NOx and CO. Sens. Actuators B. Chem. 2013;181:312–318. doi: 10.1016/j.snb.2013.02.039. [DOI] [Google Scholar]
- 27.Stranzenbach M., Saruhan B. Equivalent circuit analysis on NOx impedance-metric gas sensors. Sens. Actuators B Chem. 2009;137:154–163. doi: 10.1016/j.snb.2008.11.055. [DOI] [Google Scholar]
- 28.Hagen G., Dubbe A., Fischerauer G., Moos R. Thick-film impedance based hydrocarbon detection based on chromium(III) oxide/zeolite interfaces. Sens. Actuators B Chem. 2006;118:73–77. doi: 10.1016/j.snb.2006.04.005. [DOI] [Google Scholar]
- 29.Miura N., Nakatou M., Zhuiykov S. Impedancemetric gas sensor based on zirconia solid electrolyte and oxide sensing electrode for detecting total NOx at high temperature. Sens. Actuators B Chem. 2003;93:221–228. doi: 10.1016/S0925-4005(03)00196-5. [DOI] [Google Scholar]
- 30.Nakatou M., Miura N. Detection of propene by using new-type impedancemetric zirconia-based sensor attached with oxide sensing-electrode. Sens. Actuators B Chem. 2006;120:57–62. doi: 10.1016/j.snb.2006.01.044. [DOI] [Google Scholar]
- 31.Ikeda H., Iio A., Anggraini S.A., Miura N. Impedancemetric YSZ-based oxygen sensor using BaFeO3 sensing-electrode. Sens. Actuators B Chem. 2017;243:279–282. doi: 10.1016/j.snb.2016.11.140. [DOI] [Google Scholar]
- 32.Jäger B., Wermann A., Scholz P., Müller M., Reislöhner U., Stolle A., Ondruschka B. Iron-containing defect-rich mixed metal oxides for Friedel–Crafts alkylation. Appl. Catal. A. 2012;443:87–95. doi: 10.1016/j.apcata.2012.07.025. [DOI] [Google Scholar]
- 33.Ghorpade S.P., Darshane V.S., Dixit S.G. Liquid-phase Friedel-Crafts alkylation using CuCr2−xFexO4 spinel catalysts. Appl. Catal. A. 1998;166:135–142. doi: 10.1016/S0926-860X(97)00266-4. [DOI] [Google Scholar]
- 34.Jadhav H.S., Kalubarme R.S., Jadhav A.H., Seo J.G. Iron-nickel spinel oxide as an electrocatalyst for non-aqueous rechargeable lithium-oxygen batteries. J. Alloys Compd. 2016;666:476–481. doi: 10.1016/j.jallcom.2016.01.131. [DOI] [Google Scholar]
- 35.Samarasingha P.B., Andersen N.H., Sørby M.H., Kumar S., Nilsen O., Fjellvåg H. Neutron diffraction and Raman analysis of LiMn1.5Ni0.5O4 spinel type oxides for use as lithium ion battery cathode and their capacity enhancements. Solid State Ionics. 2016;284:28–36. doi: 10.1016/j.ssi.2015.11.018. [DOI] [Google Scholar]
- 36.Tian B., Światowska J., Maurice V., Zanna S., Seyeux A., Marcus P. Binary iron-chromium oxide as negative electrode for lithium-ion micro-batteries—Spectroscopic and microscopic characterization. Appl. Surf. Sci. 2015;353:1170–1178. doi: 10.1016/j.apsusc.2015.07.041. [DOI] [Google Scholar]
- 37.Veres M., Füle M., Tóth S., Koós M., Pócsik I. Surface enhanced Raman scattering (SERS) investigation of amorphous carbon. Diamond Relat. Mater. 2004;13:1412–1415. doi: 10.1016/j.diamond.2004.01.041. [DOI] [Google Scholar]
- 38.De la Chapelle M.L., Lefrant S., Journet C., Maser W., Bernier P., Loiseau A. Raman studies on single walled carbon nanotubes produced by the electric arc technique. Carbon. 1998;36:705–708. doi: 10.1016/S0008-6223(98)00026-8. [DOI] [Google Scholar]
- 39.Dutta A., Kaabbuathong N., Grilli M.L., Di Bartolomeo E., Traversa E. Study of YSZ-Based Electrochemical Sensors with WO3 Electrodes in NO2 and CO Environments. J. Electrochem. Soc. 2003;150:H33–H37. doi: 10.1149/1.1533044. [DOI] [Google Scholar]
- 40.Yin C., Guan Y., Zhu Z., Liang X., Wang B., Diao Q., Zhang H., Ma J., Liu F., Sun Y., et al. Highly sensitive mixed-potential-type NO2 sensor using porous double-layer YSZ substrate. Sens. Actuators B Chem. 2013;183:474–477. doi: 10.1016/j.snb.2013.03.064. [DOI] [Google Scholar]
- 41.Cai H., Sun R., Yang X., Liang X., Wang C., Sun P., Liu F., Zhao C., Sun Y., Lu G. Mixed-potential type NOx sensor using stabilized zirconia and MoO3–In2O3 nanocomposites. Ceram. Int. 2016;42:12503–12507. doi: 10.1016/j.ceramint.2016.03.243. [DOI] [Google Scholar]
Associated Data
This section collects any data citations, data availability statements, or supplementary materials included in this article.


