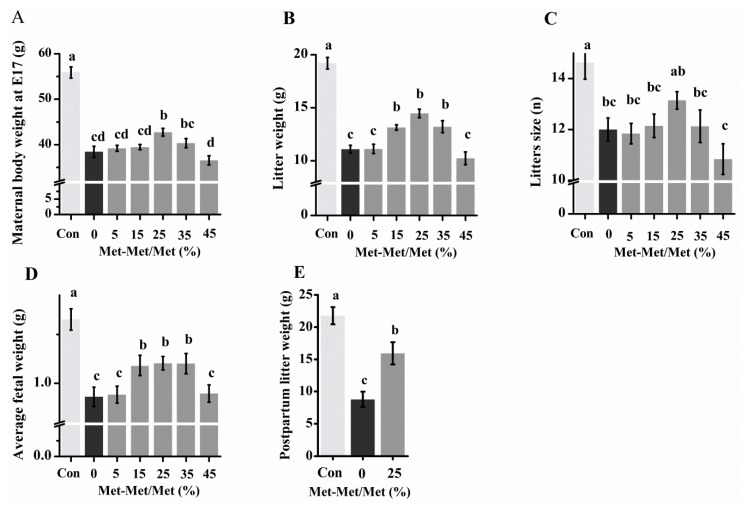
Figure 3.
Maternal body weight (A), litter weight (B), litter size (C), and average fetal weight (D) at day 17 and postpartum litter weight (E) with different levels of methionine (Met) supplementation as methionyl-methionine (Met-Met). The control group (Con) was fed a diet with Met, and the 35% Met group was fed a Met-deficient diet supplemented with 35% of the Met in the control diet by intraperitoneallyinjection from conception. In the 5, 15, 25, 35, and 45% Met-Met groups, 5, 15, 25, 35, or 45% Met in the 35% Met group was replaced with Met-Met. Data are expressed as the mean ± SEM, n = 6–8. The different letters indicate significant differences, p < 0.05.

