Abstract
Objective
To evaluate the effectiveness and safety of coenzyme Q10 for patients with type 2 diabetes mellitus (T2DM).
Methods
Data from randomized controlled trials were obtained to assess the effects of coenzyme Q10 versus placebo or western medicine on patients with T2DM. The study's registration number is CRD42018088474. The primary outcomes included glycosylated hemoglobin, fasting blood glucose, and fasting insulin.
Result
Thirteen trials involving 765 patients were included. Compared with the control group, coenzyme Q10 may decrease the HbA1c (WMD −0.29; 95% CI −0.54, −0.03; P = 0.03) and the fasting blood glucose (WMD −11.21; 95% CI −18.99, −3.43; P = 0.005). For fasting insulin, there is also not strong evidence that confirms which one is better because there was no statistical difference (WMD −0.48; 95% CI −2.54, 1.57; P = 0.65).
Conclusion
Based on current evidence, coenzyme Q10 may assist glycemic control, decrease TG, and improve HDL-C in patients with T2DM.
1. Introduction
Diabetes is one of the major global health issues. According to the World Health Organization, in 2014, about 422 million adults were suffering from diabetes. In the US, more than 9% of the US population were affected by diabetes [1–3]. In the global population of diabetes, 90%–95% are with type 2 diabetes mellitus (T2DM). Since 1980, the global prevalence of diabetes in adults has nearly doubled. Diabetes caused 1.5 million deaths in 2012 as it relates to increased risk of cardiovascular and other diseases [4, 5]. And according to estimates of the Diabetes Federation Diabetes Atlas, the number of patients with diabetes in 2035 will reach 592 million [6]. Patients with T2DM are at high risk of developing hyperglycemia-related cardiovascular complications such as heart disease, hypertension, stroke, retinopathy, and nephropathy. In the US, disability, loss of work, and premature death caused by diabetes have resulted in a huge direct and indirect medical costs [2]. Without effective prevention and management programs, a further significant increase in diabetes will have grave consequences on the health and lifespan of the world population [6]. At present, the treatment of diabetes is still lacking etiological treatment; the treatment of diabetes is mainly achieved through diabetes management including healthy eating, weight control, appropriate physical activity, antiglycemic medications, and multifactorial risk reduction [7].
T2DM occurs when the organism fails to respond to the increased blood glucose caused by the impaired β cell secretion and/or insulin resistance [1, 8]. Therefore, T2DM is a complex chronic disease. Oxidative stress and insulin resistance are recognized pathogenic mechanisms in the development and progression of T2DM and its complications [1, 9]. Insulin, secreted by β cells, plays crucial roles in many metabolic processes such as regulating the glucose uptake [1, 10]. Therefore, when insulin secretion is impaired, glucose uptake will also be affected. Persistent hyperglycemia will lead to the overproduction of reactive oxygen species, which can cause oxidative damage to deoxyribonucleic acid (DNA), proteins, and lipids [1, 10, 11]. Because the mitochondria are in proximity to the sources of reactive oxygen species, oxidative stress often leads to mitochondrial damage, resulting in mitochondrial dysfunction. An increasing number of studies have shown that in obese and T2DM patients, reactive oxygen species can aggravate the insulin resistance status and interfere with the insulin signaling pathway through impairing the mitochondrial ability to oxidize fat [12, 13]. Meanwhile, the abnormality in mitochondrial functions secondary to oxidative stress is one of the mechanisms leading to T2DM and T2DM-related complications [11].
Coenzyme Q10 is a lipid-soluble nutrient widely present in living cells. Coenzyme Q10, as an effective antioxidant, can scavenge free radicals and protect cells from oxidation. Recent studies have found that T2DM patients have significantly lower levels of coenzyme Q10 than healthy people [1, 14–16], which indicates that coenzyme Q10 deficiency may reduce the organism's ability to counter hyperglycemia-induced oxidative stress in T2DM [17, 18]. This suggests that coenzyme Q10 plays an important role in the pathogenesis of T2DM [19]. Therefore, exogenous coenzyme Q10 supplements may improve the oxidative stress-induced abnormalities in mitochondrial functions, thereby bettering glycemic control in patients with T2DM [20].
Therefore, the purpose of this paper is to review the available randomized controlled trials (RCTs) to evaluate the effectiveness of coenzyme Q10 for T2DM. Although systematic reviews and meta-analyses of the effects of coenzyme Q10 on the metabolic profile of diabetes mellitus [21] and diabetes-related biomarkers [22] have been performed, the analysis in 2015 only showed that coenzyme Q10 may reduce triglyceride levels, while the analysis in 2016 only included RCTs before 2014. Over time, more RCTs about coenzyme Q10 were published between 2014 and 2018. Therefore, the results of systematic reviews and meta-analyses need to be updated. This systematic review and meta-analysis is a registered review with protocol (CRD42018088474) in PROSPERO, which is aimed at evaluating the effects of coenzyme Q10 on T2DM.
2. Materials and Methods
2.1. Protocol
Study selection, assessment of eligibility criteria, data extraction, and statistical analyses were performed based on a predefined protocol registered on PROSPERO (CRD42018088474) (see Supplementary Materials available here).
2.2. Search Strategy and Study Selection
Records of coenzyme Q10 supplementation in T2DM were identified through a systematic literature search from the China National Knowledge Infrastructure (CNKI) Databases, Chinese Biomedical Database (CBM), Cochrane Library (until Issue 2, 2018), Web of Science, Embase, Wan Fang Database (Chinese Ministry of Science and Technology), PubMed, MEDLINE Complete, ClinicalTrials.gov, and Chinese Science and Technology Periodical Database (VIP), from their inception to February 2018. The search terms included Coenzyme Q10, CoQ 10, CoQ10, ubidecarenone, co-enzyme Q10, ubiquinone Q10, Bio-Quinone Q10, ubiquinone 50, ubisemiquinone radical, ubisemiquinone, ketosis-resistant diabetes mellitus, non-insulin-dependent diabetes mellitus, stable diabetes mellitus, and type 2 diabetes mellitus. For example, the search strategy for PubMed is presented in Table 1.
Table 1.
Search strategy for PubMed.
| Database | Search strategy |
|---|---|
| PubMed | (Coenzyme Q10 OR CoQ 10 OR CoQ10 OR ubidecarenone OR co-enzyme Q10 OR ubiquinone Q10 OR Bio-Quinone Q10 OR 2,3-dimethoxy-5-methyl-6-decaprenylbenzoquinone OR ubiquinone 50 OR ubisemiquinone radical OR Q-ter OR ubisemiquinone OR coenzyme Q10, (Z,Z,Z,Z,Z,Z,E,E,E)-isomer OR coenzyme Q10, ion (1-), (all-E)-isomer) AND (Type 2 diabetes mellitus OR Diabetes Mellitus, Noninsulin-Dependent OR Diabetes Mellitus, Ketosis-Resistant OR Diabetes Mellitus, Ketosis Resistant OR Ketosis-Resistant Diabetes Mellitus OR Diabetes Mellitus, Non Insulin Dependent OR Diabetes Mellitus, Non-Insulin-Dependent OR Non-Insulin-Dependent Diabetes Mellitus OR Diabetes Mellitus, Stable OR Stable Diabetes Mellitus OR Diabetes Mellitus, Type II OR NIDDM OR Diabetes Mellitus, Noninsulin Dependent OR Diabetes Mellitus, Maturity-Onset OR Diabetes Mellitus, Maturity Onset OR Maturity-Onset Diabetes Mellitus OR Maturity Onset Diabetes Mellitus OR MODY OR Diabetes Mellitus, Slow-Onset OR Diabetes Mellitus, Slow Onset OR Slow-Onset Diabetes Mellitus OR Type 2 Diabetes Mellitus OR Noninsulin-Dependent Diabetes Mellitus OR Noninsulin Dependent Diabetes Mellitus OR Maturity-Onset Diabetes OR Diabetes, Maturity-Onset OR Maturity Onset Diabetes OR Type 2 Diabetes OR Diabetes, Type 2 OR Diabetes Mellitus, Adult-Onset OR Adult-Onset Diabetes Mellitus OR Diabetes Mellitus, Adult Onset) AND (randomized controlled trial [pt] OR controlled clinical trial [pt] OR placebo [tiab] OR drug therapy [sh] OR trial [tiab] OR groups [tiab] OR clinical trials as topic [mesh: noexp] OR Clinical Trial OR random∗ [tiab] OR random allocation [mh] OR single-blind method [mh] OR double-blind method [mh] OR cross-over studies) NOT (animals [mh] NOT humans [mh]) |
Studies meeting the inclusion criteria were included in this review (see Box 1).
Box 1.

Inclusion criteria.
2.3. Data Extraction
Three reviewers (Shi-ying Zhang, Kai-lin Yang, and Liu-ting Zeng) independently selected the studies and extracted the data from the studies. Disagreements were resolved by discussion of five reviewers (Shi-ying Zhang, Kai-lin Yang, Liu-ting Zeng, Xiao-he Wu, and Hui-yong Huang). We first reviewed the titles and abstracts of each of the studies and excluded the articles that do not meet the eligibility criteria. Then, we assessed the full texts of studies that meet the criteria. A customized form was used to record authors, year of publication, intervention, control group, outcomes, AEs, and duration.
If there is missing information in the article, reviewers would attempt to contact the authors to obtain the data or impute the missing data according to the Cochrane Handbook 5.1.0 [23]. If P < 0.05, the missing standard deviations would be imputed by a P value; if P > 0.05 or P = NS, it would be imputed by using the average of candidate standard deviations [23].
2.4. Study Quality Assessment
We assessed the risk of bias by using the risk of a bias assessment tool based on the Cochrane Handbook [24]. The criteria consist of 7 items: random sequence generation, allocation concealment, blinding of participants and personnel, blinding of outcome assessment, incomplete outcome data, selective outcome reporting, and other sources of bias. The study quality assessment was performed by three reviewers (Shi-ying Zhang, Kai-lin Yang, and Liu-ting Zeng) independently. Disagreements were resolved by consensus among all five reviewers (Shi-ying Zhang, Kai-lin Yang, Liu-ting Zeng, Xiao-he Wu, and Hui-yong Huang).
2.5. Statistical Analysis
The data were analyzed by RevMan 5.3 software. The dichotomous variable measure was summarized by risk ratio (RR) with a 95% confidence interval (CI). The continuous outcomes underwent meta-analysis using mean differences (MD) and 95% CI. Heterogeneity among studies was assessed using Cochrane's Q and I 2 statistic [25]. The fixed effect model would be used when P > 0.1 and I 2 < 50%. We would explore the reasons for heterogeneity, perform the subgroup analysis, or use the random effects model when P < 0.1 and I 2 > 50%.
3. Results
3.1. Results of the Search
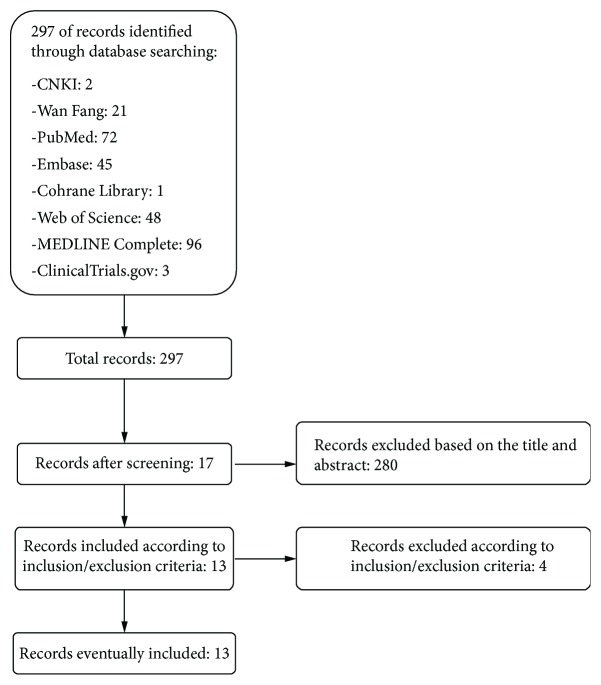
Two hundred ninety-seven articles were found in the initial search; two hundred eighty of them were excluded based on the title and abstract and seventeen of them were retrieved for more detailed evaluation. Finally, thirteen studies were included in this systematic review and meta-analysis, and four were excluded (Figure 1).
Figure 1.
Flow diagram of searching and article selection.
3.2. Description of Included Trials and Risk of Bias in Included Studies
Thirteen RCTs with 765 participants met the inclusion criteria. All of them were parallel-group RCTs. In Playford et al.'s [26] and Chew et al.'s research [27], there were two trial groups and two control groups. According to the Cochrane Handbook 5.1.0, we split the shared trial and control groups into two groups with a smaller sample size [23] and include the four reasonably independent comparisons [Playford 2002a (coenzyme Q10 vs. placebo), Playford 2002b (coenzyme Q10 vs. Fenofibrate), Playford 2002c (coenzyme Q10 + fenofibrate vs. placebo), and Playford 2002d (coenzyme Q10 + fenofibrate vs. fenofibrate) and Chew 2008a (coenzyme Q10 vs. placebo), Chew 2008b (coenzyme Q10 vs. fenofibrate), Chew 2008c (coenzyme Q10 + fenofibrate vs. placebo), and Chew 2008d (coenzyme Q10 + fenofibrate vs. fenofibrate)]. Study characteristics are presented in Table 2.
Table 2.
The characteristics of the included studies.
| Study | Sample size | Intervention | Relevant outcomes | Mean age (years) | Duration | |||
|---|---|---|---|---|---|---|---|---|
| Trial group | Control group | Trial group | Control group | Trial group | Control group | |||
| Hodgson et al. [28] | 38 | 36 | Coenzyme Q10 200 mg or coenzyme Q10 200 mg + fenofibrate 200 mg | Placebo or fenofibrate 200 mg | HbA1c | 52 ± 6.41 | 54.4 ± 9.88 | 12 weeks |
| Playford et al. [26] | 38 | 35 | Coenzyme Q10 200 mg or coenzyme Q10 200 mg + fenofibrate 200 mg | Placebo or fenofibrate 200 mg | HbA1c, TG, TC, HDL-C, LDL-C | 52.7 ± 9.80 | 54.1 ± 13.7 | 12 weeks |
| Moazen et al. [33] | 26 | 26 | Coenzyme Q10 200 mg | Microcrystalline cellulose (placebo) | Fasting blood glucose, HbA1c, adiponectin | 50.67 ± 7.01 | 52.79 ± 7.66 | 8 weeks |
| Akbari Fakhrabadi et al. [29] | 32 | 30 | Coenzyme Q10 200 mg | Microcrystalline cellulose (placebo) | Fasting blood glucose, fasting insulin, HbA1c, HOMA-IR, TC, HDL-C, LDL-C | 56.7 ± 6.4 | 54.8 ± 6.7 | 12 weeks |
| Gholami et al. [30] | 35 | 35 | Coenzyme Q10 100 mg | Cellulose acetate 100 mg | Fasting blood glucose, fasting insulin, HbA1c, HOMA-IR, TC, TG, HDL-C, LDL-C | 52.97 ± 1.04 | 53.68 ± 1.14 | 12 weeks |
| Zahedi et al. [31] | 20 | 20 | Coenzyme Q10 150 mg | Maize starch 150 mg | Fasting blood glucose, fasting insulin, HbA1c, HOMA-IR, TC, TG, HDL-C, LDL-C | 53.5 ± 9.7 | 58.8 ± 9.6 | 12 weeks |
| Chew et al. [27] | 36 | 33 | Coenzyme Q10 200 mg or coenzyme Q10 200 mg + fenofibrate 160 mg | Placebo or fenofibrate 160 mg | Fasting blood glucose, HbA1c, TC, TG, HDL-C, LDL-C | 62.22 ± 7.41 | 63.57 ± 8.09 | 24 weeks |
| Hosseinzadeh-Attar et al. [34] | 31 | 33 | Coenzyme Q10 200 mg | Maize starch 200 mg | Fasting blood glucose, HbA1c, TC, TG, HDL-C, LDL-C | 45.2 ± 7.6 | 47.1 ± 8.3 | 12 weeks |
| Mohammed-Jawad et al. [32] | 19 | 19 | Coenzyme Q10 200 mg + antidiabetic drugs | Antidiabetic drugs | Fasting blood glucose, HbA1c, TC, HDL-C, LDL-C | 49.37 ± 6.65 | 51.63 ± 8.13 | 8 weeks |
| Eriksson et al. [19] | 12 | 11 | Coenzyme Q10 200 mg | Placebo 200 mg | Fasting blood glucose, HbA1c, TC, TG, HDL-C | 65 ± 17.32 | 64 ± 23.22 | 24 weeks |
| Lim et al. [35] | 40 | 40 | Coenzyme Q10 200 mg | Placebo 200 mg | Fasting blood glucose, HbA1c | 54 ± 9 | 53 ± 9 | 12 weeks |
| Mehrdadi et al. [36] | 26 | 30 | Coenzyme Q10 200 mg | Placebo 200 mg | Fasting blood glucose, fasting insulin, HbA1c, adipolin, HOMA-IR | 46 ± 7 | 48 ± 8 | 12 weeks |
| Kolahdouz Mohammadi et al. [37] | 31 | 33 | Coenzyme Q10 200 mg | Placebo 200 mg | Fasting blood glucose, HbA1c, TG, TC, HDL-C, LDL-C | 45.23 ± 7.64 | 47.18 ± 8.31 | 12 weeks |
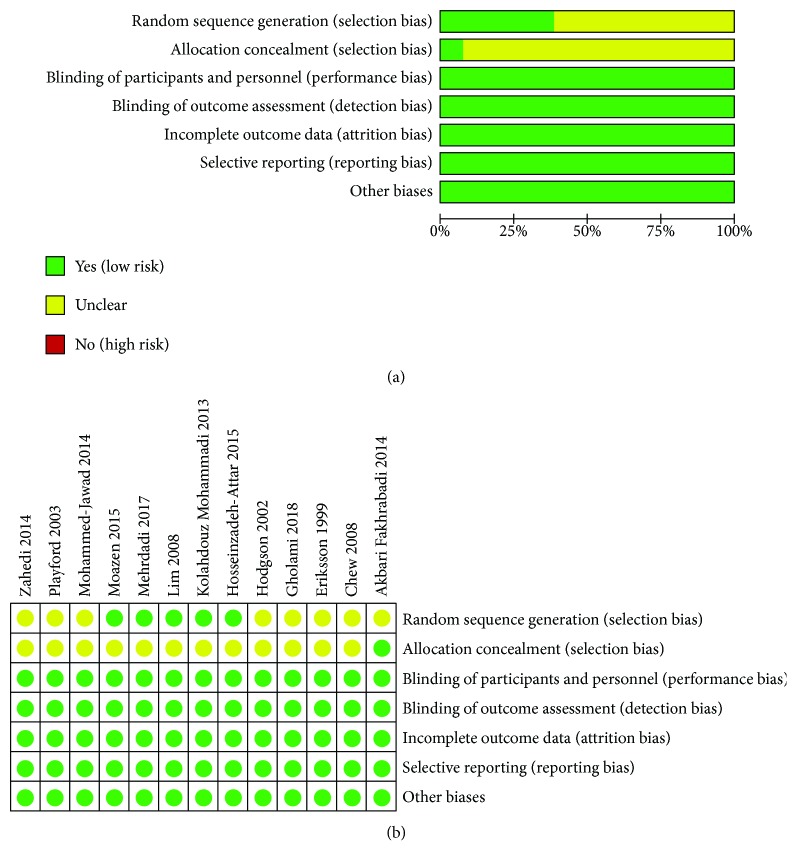
With regard to the selection bias, eight RCTs [19, 26–32] did not describe the randomization procedures, and twelve RCTs [19, 26–28, 30–37] did not describe an acceptable method of allocation concealment; thus, we thought that their risk of bias is unclear. One RCT [33] used block randomization, three RCTs [34, 36, 37] utilized permuted random block allocation, and one RCT used a website [35] to conduct randomization; we therefore rated them as having a low risk of bias. One RCT [29] describes an acceptable method of allocation concealment, and it was rated as having a low risk of bias. As for the performance bias and detection bias, two trials were unclear [32, 33], but they used objective measures (e.g., HbA1c, fasting insulin, and fasting glucose) and the outcome is not likely to be influenced by the lack of blinding, while the remaining three studies used blinding; thus, we gave a low risk of bias for all. None of trials missed data and incompletely reported the outcomes; therefore, we gave a low risk of bias. Other sources of bias were at low risk in all of the included studies. A graphical summary of the risks of bias assessment is presented in Figure 2.
Figure 2.
(a, b) The risk of bias.
3.3. Primary Outcomes
3.3.1. Glycosylated Hemoglobin
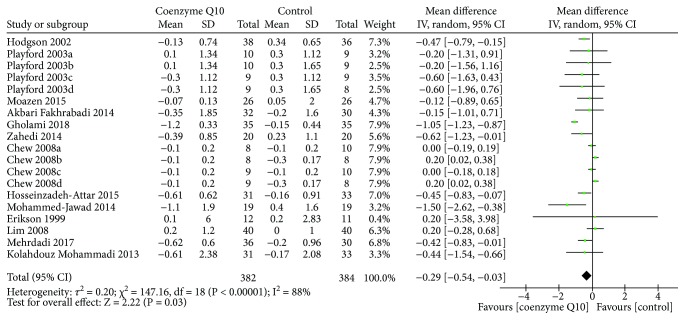
All of the RCTs reported the HbA1c at the end of treatment. Due to the high heterogeneity (τ 2 = 0.20, I 2 = 88%, P < 0.00001), the random effects model was used. As shown in Figure 3, coenzyme Q10 may decrease the HbA1c compared with the control group (WMD −0.29; 95% CI −0.54, −0.03; P = 0.03).
Figure 3.
Glycosylated hemoglobin.
3.3.2. Fasting Blood Glucose
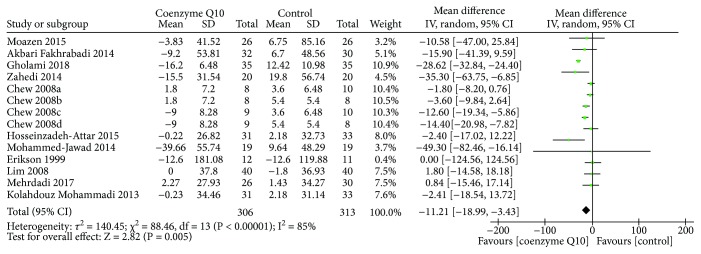
Ten RCTs [19, 27, 29–37] reported the fasting blood glucose. The random effects model was utilized because of the high heterogeneity (τ 2 = 140.45, I 2 = 85%, P < 0.00001). As shown in Figure 4, coenzyme Q10 may decrease the fasting blood glucose compared with the control group (WMD −11.21; 95% CI −18.99, −3.43; P = 0.005).
Figure 4.
Fasting blood glucose.
3.3.3. Fasting Insulin
Four RCTs [29–31, 36] reported the fasting insulin. The random effects model was used due to the high heterogeneity (τ 2 = 2.60, I 2 = 77%, P = 0.005). The result showed that there is no statistically significant difference between the coenzyme Q10 group and control group in adjusting insulin (WMD −0.48; 95% CI −2.54, 1.57; P = 0.65) (Figure 5).
Figure 5.
Fasting insulin.
3.4. Secondary Outcomes
3.4.1. Homeostasis Model Assessment of Insulin Resistance
Four RCTs [29–31, 36] reported HOMA-IR. Due to the high heterogeneity (τ 2 = 1.56, I 2 = 92%, P < 0.00001), the random effects model was utilized. The results showed that in improving the HOMA-IR, the difference between the coenzyme Q10 group and the control group was not statistically significant (MD −0.89; 95% CI −2.25, 0.48; P = 0.20) (Figure 6).
Figure 6.
Homeostasis model assessment of insulin resistance.
3.4.2. Blood Lipids
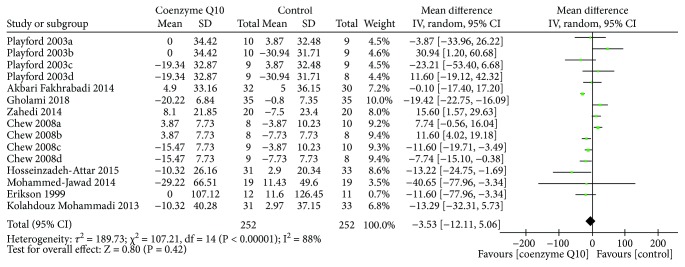
Nine RCTs [19, 26, 27, 29–32, 34, 37] reported TC. The random effects model was utilized because of the high heterogeneity (τ 2 = 189.73, I 2 = 87%, P < 0.00001). In this index, there is also not strong evidence that confirms which one is better because there was no statistical difference (WMD −3.53; 95% CI −12.11, 5.08; P = 0.42) (Figure 7).
Figure 7.
Total cholesterol.
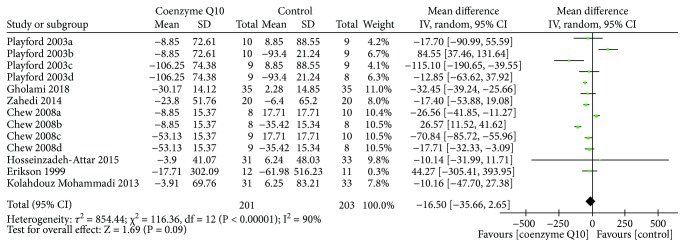
Seven RCTs [19, 26, 27, 30, 31, 34, 37] reported TG. The random effects model was utilized due to the high heterogeneity (τ 2 = 854.44, I 2 = 90%, P < 0.00001). In this index, there is also not strong evidence that confirms which one is better (WMD −16.50; 95% CI −35.66, 2.65; P = 0.09) (Figure 8).
Figure 8.
Triglyceride.
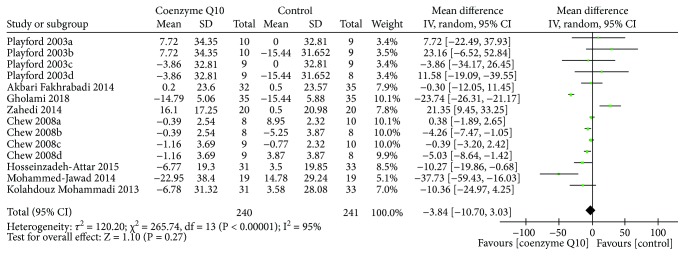
Eight RCTs [26, 27, 29–32, 34, 37] reported LDL-C. Due to the high heterogeneity (τ 2 = 120.20, I 2 = 95%, P < 0.00001), the random effects model was used. The results showed that in decreasing the LDL-C, the difference between the coenzyme Q10 group and the control group was not statistically significant (WMD −3.84; 95% CI −10.70, 3.03; P = 0.27) (Figure 9).
Figure 9.
LDL-C.
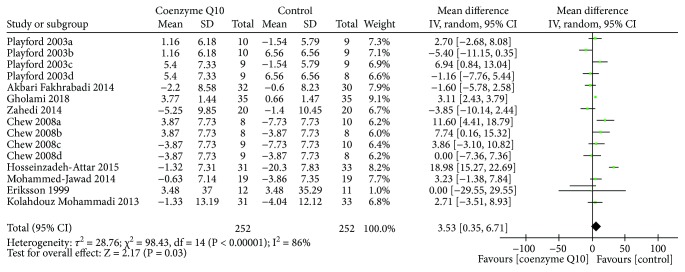
Nine RCTs [19, 26, 27, 29–32, 34, 37] reported HDL-C. The random effects model was used due to the high heterogeneity (τ 2 = 28.76, I 2 = 86%, P < 0.00001). As shown in Figure 10, coenzyme Q10 may increase HDL-C levels compared to the control group (WMD 3.53; 95% CI 0.35, 6.71; P = 0.03).
Figure 10.
HDL-C.
3.4.3. Adiponectin
Two RCTs [33, 36] reported adiponectin. Due to the high heterogeneity (τ 2 = 57.71, I 2 = 92%, P = 0.0003), we used the random effects model. The results showed that there was no statistically significant difference between the coenzyme Q10 group and the control group in improving the adiponectin (WMD −4.32; 95% CI −15.27, 6.62; P = 0.44) (Figure 11).
Figure 11.
Adiponectin.
3.5. Adverse Events
None of RCTs reported AEs.
4. Discussions
This study is a systematic review and meta-analysis that regards the effects of coenzyme Q10 on T2DM patients. It synthesizes the results from 13 RCTs (including the newest RCTs [29–34, 36] after 2014) involving 765 participants to draw an overall conclusion. Although significant differences between groups were found for some outcomes, the available evidence shows that coenzyme Q10 may improve the glycemic control (decreasing the HbA1c and fasting blood glucose) and blood lipids (decreasing TG and increasing HDL-C), suggesting that coenzyme Q10 may assist glycemic control and protect the cardiovascular system. However, these findings should be interpreted with caution although it seems like that they are prospective. The unclear risk of bias for selection bias (random sequence generation and allocation concealment), the small number of patients, and the high heterogeneity limited the promotion of the results. In addition, the lack of statistical significance of fasting insulin, HOMA-IR, TC, LDL-C, and adiponectin does not equate to no medical significance. Instead, it may mean that coenzyme Q10 may be the safer or cheaper treatment options.
Coenzyme Q10 deficiency, particularly ubiquinol (the reduced form of coenzyme Q10) deficiency, is often observed among patients with T2DM. The ubiquinol/ubiquinone ratio is often utilized as an indicator to react to the body's oxidative stress [38]. Decreased ubiquinol levels are often accompanied by increased ubiquinone levels, suggesting that there is an ineffective conversion between ubiquinone and ubiquinol. It also indicates that the body's ability to scavenge free radicals is reduced. Meanwhile, the impaired conversion of ubiquinone to ubiquinol is often found in many diseases [39]. Román-Pintos et al. [15] found that coenzyme Q10 levels in T2DM patients were significantly lower than those in healthy people, while their MDA levels were significantly higher than those in healthy one. Furthermore, the ubiquinone/ubiquinol ratio in T2DM patients was continuously higher than that in normal heathy people throughout the day after breakfast, which indicates that postprandial hyperglycemia is associated with increased oxidative stress [16]. Meanwhile, exogenous coenzyme Q10 supplementation can increase over 31% of the activity of succinate dehydrogenase in patients with T2DM [15]. The mitochondrial succinate dehydrogenase is a flavoprotein in the mitochondrial inner membrane which can donate electrons to coenzyme Q10. Since the Krebs cycle relies on succinate dehydrogenase and NADH dehydrogenase, it can be inferred that appropriate coenzyme Q10 level is beneficial for this cycle [40]. Therefore, based on the evidence above, the abnormalities in mitochondrial functions secondary to oxidative stress in T2DM patients may be potentially relieved by restoring the coenzyme Q10 level through exogenous coenzyme Q10 supplementation, ultimately improving the glycemic control.
None of RCTs reported information about AEs, which means that there is currently a lack of reports on AEs. However, this does not mean that the intervention of coenzyme Q10 is safe [41]. Thus, although, based on current evidences, we consider that coenzyme Q10 is a relatively safe treatment, we cannot assure it. Future clinical trials are required to report AEs with more explanations [42].
Compared with previous reviews [21, 22], the strengths of this systematic review and meta-analysis are that it is strictly conducted in accordance with the protocol registered on PROSPERO and it assesses more outcomes. It also included seven new RCTs [29–34, 37] after 2014. Of course, this systematic review and meta-analysis also has limitations, including but not limited to the number of patients participated which is only 765 and the heterogeneity of some outcomes. Such heterogeneity confounds the interpretation of statistical findings. The heterogeneity may come from the potential discrepancies in the pharmacological effects of various coenzyme Q10 preparations which may result from different standardizations of the coenzyme Q10 manufacturing process, dosage, duration of treatment, units of laboratory tests, and races of the selected patients or other places. Therefore, the random effects model was adopted, although it cannot completely eliminate heterogeneity. Meanwhile, the study duration is generally short-to-medium term (mostly 12 weeks), and the long-term efficacy of coenzyme Q10 is temporarily uncertain. Furthermore, in the included studies, the dose of CoQ10 in the experimental group was not necessarily the same, which could lead to differences in the effect of lowering blood glucose; the difference in dosage makes it difficult to determine the minimum effective dose of coenzyme Q10. Finally, due to the fact that none of the trials reported AEs, the safety of coenzyme Q10 should be interpreted with caution. In the future, more similar high-quality randomized controlled trials are needed to amend the results of this systematic review and meta-analysis.
5. Conclusion
Coenzyme Q10 may assist glycemic control, decrease TG, and improve HDL-C in patients with T2DM. However, the limitations in RCTs, including small sample sizes and short duration, make the result be interpreted cautiously. The benefits from long-term treatment of coenzyme Q10 beyond 6 months remain to be defined by future studies. Meanwhile, more randomized, double-blind, large-sample-size trials of coenzyme Q10 for T2DM are needed in the future to validate or revise the result of this work.
Acknowledgments
This work is supported by the National Natural Science Foundation of China (no. 81373551), the Doctoral Fund of Ministry of Education of China (no. 20134323110001), the key projects of Hunan Department of Science and Technology (no. S2014S2032).
Contributor Information
Xiao-he Wu, Email: wxhkyzy@163.com.
Hui-yong Huang, Email: huanghy68@126.com.
Conflicts of Interest
We declare no competing interests.
Authors' Contributions
Shi-ying Zhang, Kai-lin Yang, Liu-ting Zeng, Xiao-he Wu, and Hui-yong Huang are responsible for the study concept and design. Shi-ying Zhang, Kai-lin Yang, and Liu-ting Zeng are responsible for the literature searching. Shi-ying Zhang, Kai-lin Yang, Liu-ting Zeng, Xiao-he Wu, and Hui-yong Huang are responsible for the data analysis and interpretation. Shi-ying Zhang, Kai-lin Yang, and Liu-ting Zeng drafted the paper. Xiao-he Wu and Hui-yong Huang supervised the study. All authors participated in the analysis and interpretation of data and approved the final paper.
Supplementary Materials
CRD42018088474.pdf is the protocol of this systematic review and meta-analysis; PRISMA 2009 checklist.doc is the PRISMA checklist.
References
- 1.Shen Q., Pierce J. D. Supplementation of coenzyme Q10 among patients with type 2 diabetes mellitus. Healthcare. 2015;3(2):296–309. doi: 10.3390/healthcare3020296. [DOI] [PMC free article] [PubMed] [Google Scholar]
- 2.World Health Organization. Global Status Report Noncommunicable Diseases 2016. Geneva (Switzerland): World Health Organization; 2016. [Google Scholar]
- 3.Centers for Disease Control and Prevention. National Diabetes Statistics Report: Estimates of Diabetes and Its Burden in the United States, 2014. Atlanta, GA, USA: USA Department of Health and Human Services; 2014. [Google Scholar]
- 4.Rawshani A., Rawshani A., Franzén S., et al. Mortality and cardiovascular disease in type 1 and type 2 diabetes. New England Journal of Medicine. 2017;376(15):1407–1418. doi: 10.1056/NEJMoa1608664. [DOI] [PubMed] [Google Scholar]
- 5.Tabák A. G., Herder C., Rathmann W., Brunner E. J., Kivimäki M. Prediabetes: a high-risk state for diabetes development. The Lancet. 2012;379(9833):2279–2290. doi: 10.1016/S0140-6736(12)60283-9. [DOI] [PMC free article] [PubMed] [Google Scholar]
- 6.International Diabetes Federation. IDF Diabetes Atlas. International Diabetes Federation: Brussels, Belgium; 2013. http://www.idf.org/diabetesatlas. [Google Scholar]
- 7.American Diabetes Association. 15. Diabetes advocacy: standards of medical care in diabetes—2018. Diabetes Care. 2018;41(Supplement 1):S152–S153. doi: 10.2337/dc18-S015. [DOI] [PubMed] [Google Scholar]
- 8.Ruhe R. C., McDonald R. B. Use of antioxidant nutrients in the prevention and treatment of type 2 diabetes. Journal of the American College of Nutrition. 2001;20(Supplement 5):363S–369S. doi: 10.1080/07315724.2001.10719169. [DOI] [PubMed] [Google Scholar]
- 9.Al-Gadi I. S., Haas R. H., Falk M. J., Goldstein A., McCormack S. E. Endocrine disorders in primary mitochondrial disease. Journal of the Endocrine Society. 2018;2(4):361–373. doi: 10.1210/js.2017-00434. [DOI] [PMC free article] [PubMed] [Google Scholar]
- 10.Yagihashi S., Inaba W., Mizukami H. Dynamic pathology of islet endocrine cells in type 2 diabetes: β-cell growth, death, regeneration and their clinical implications. Journal of Diabetes Investigation. 2016;7(2):155–165. doi: 10.1111/jdi.12424. [DOI] [PMC free article] [PubMed] [Google Scholar]
- 11.Lamson D. W., Plaza S. M. Mitochondrial factors in the pathogenesis of diabetes: a hypothesis for treatment. Alternative Medicine Review. 2002;7(2):94–111. [PubMed] [Google Scholar]
- 12.Meng Y., Eirin A., Zhu X. Y., et al. Obesity-induced mitochondrial dysfunction in porcine adipose tissue-derived mesenchymal stem cells. Journal of Cellular Physiology. 2018;233(8):5926–5936. doi: 10.1002/jcp.26402. [DOI] [PMC free article] [PubMed] [Google Scholar]
- 13.Brøns C., Jacobsen S., Hiscock N., et al. Effects of high-fat overfeeding on mitochondrial function, glucose and fat metabolism, and adipokine levels in low-birth-weight subjects. American Journal of Physiology-Endocrinology and Metabolism. 2012;302(1):E43–E51. doi: 10.1152/ajpendo.00095.2011. [DOI] [PubMed] [Google Scholar]
- 14.Chatziralli I. P., Theodossiadis G., Dimitriadis P., et al. The effect of vitamin E on oxidative stress indicated by serum malondialdehyde in insulin-dependent type 2 diabetes mellitus patients with retinopathy. The Open Ophthalmology Journal. 2017;11(1):51–58. doi: 10.2174/1874364101711010051. [DOI] [PMC free article] [PubMed] [Google Scholar]
- 15.Román-Pintos L. M., Villegas-Rivera G., Rodríguez-Carrizalez A. D., Miranda-Díaz A. G., Cardona-Muñoz E. G. Diabetic polyneuropathy in type 2 diabetes mellitus: inflammation, oxidative stress, and mitochondrial function. Journal of Diabetes Research. 2016;2016:16. doi: 10.1155/2016/3425617.3425617 [DOI] [PMC free article] [PubMed] [Google Scholar]
- 16.Hasegawa G., Yamamoto Y., Zhi J. G., et al. Daily profile of plasma %CoQ10 level, a biomarker of oxidative stress, in patients with diabetes manifesting postprandial hyperglycaemia. Acta Diabetologica. 2005;42(4):179–181. doi: 10.1007/s00592-005-0199-6. [DOI] [PubMed] [Google Scholar]
- 17.Daehn I. S. Glomerular endothelial cell stress and cross-talk with podocytes in early diabetic kidney disease. Frontiers in Medicine. 2018;5:p. 76. doi: 10.3389/fmed.2018.00076. [DOI] [PMC free article] [PubMed] [Google Scholar]
- 18.Mezawa M., Takemoto M., Onishi S., et al. The reduced form of coenzyme Q10 improves glycemic control in patients with type 2 diabetes: an open label pilot study. BioFactors. 2012;38(6):416–421. doi: 10.1002/biof.1038. [DOI] [PubMed] [Google Scholar]
- 19.Eriksson J. G., Forsen T. J., Mortensen S. A., Rohde M. The effect of coenzyme Q10 administration on metabolic control in patients with type 2 diabetes mellitus. BioFactors. 1999;9(2-4):315–318. doi: 10.1002/biof.5520090229. [DOI] [PubMed] [Google Scholar]
- 20.Alam M. A., Rahman M. M. Mitochondrial dysfunction in obesity: potential benefit and mechanism of co-enzyme Q10 supplementation in metabolic syndrome. Journal of Diabetes & Metabolic Disorders. 2014;13(1):p. 60. doi: 10.1186/2251-6581-13-60. [DOI] [PMC free article] [PubMed] [Google Scholar]
- 21.Suksomboon N., Poolsup N., Juanak N. Effects of coenzyme Q10 supplementation on metabolic profile in diabetes: a systematic review and meta-analysis. Journal of Clinical Pharmacy and Therapeutics. 2015;40(4):413–418. doi: 10.1111/jcpt.12280. [DOI] [PubMed] [Google Scholar]
- 22.Moradi M., Haghighatdoost F., Feizi A., Larijani B., Azadbakht L. Effect of coenzyme Q10 supplementation on diabetes biomarkers: a systematic review and meta-analysis of randomized controlled clinical trials. Archives of Iranian Medicine. 2016;19(8):588–596. [PubMed] [Google Scholar]
- 23.Deeks J. J., Higgins J. P., Altman D. G. Chapter 16: special topics in statistics. In: Higgins J. P., Green S., editors. Cochrane Handbook for Systematic Reviews of Interventions. UK: The Cochrane Collaboration; 2011. [Google Scholar]
- 24.Deeks J. J., Higgins J. P., Altman D. G. Chapter 8: assessing risk of bias in included studies. In: Higgins J. P., Green S., editors. Cochrane Handbook or Systematic Reviews of Interventions Version 5.1.0. UK: The Cochrane Collaboration; 2011. [Google Scholar]
- 25.Deeks J. J., Higgins J. P., Altman D. G. Chapter 9: analyzing data and undertaking meta-analyses. In: Higgins J. P., Green S., editors. Cochrane Handbook for Systematic Reviews of Interventions. UK: The Cochrane Collaboration; 2011. [Google Scholar]
- 26.Playford D. A., Watts G. F., Croft K. D., Burke V. Combined effect of coenzyme Q10 and fenofibrate on forearm microcirculatory function in type 2 diabetes. Atherosclerosis. 2003;168(1):169–179. doi: 10.1016/S0021-9150(02)00417-3. [DOI] [PubMed] [Google Scholar]
- 27.Chew G. T., Watts G. F., Davis T. M. E., et al. Hemodynamic effects of fenofibrate and coenzyme Q10 in type 2 diabetic subjects with left ventricular diastolic dysfunction. Diabetes Care. 2008;31(8):1502–1509. doi: 10.2337/dc08-0118. [DOI] [PMC free article] [PubMed] [Google Scholar]
- 28.Hodgson J. M., Watts G. F., Playford D. A., Burke V., Croft K. D. Coenzyme Q10 improves blood pressure and glycaemic control: a controlled trial in subjects with type 2 diabetes. European Journal of Clinical Nutrition. 2002;56(11):1137–1142. doi: 10.1038/sj.ejcn.1601464. [DOI] [PubMed] [Google Scholar]
- 29.Akbari Fakhrabadi M., Zeinali Ghotrom A., Mozaffari-Khosravi H., Hadi Nodoushan H., Nadjarzadeh A. Effect of coenzyme Q10 on oxidative stress, glycemic control and inflammation in diabetic neuropathy: a double blind randomized clinical trial. International Journal for Vitamin and Nutrition Research. 2014;84(5-6):252–260. doi: 10.1024/0300-9831/a000211. [DOI] [PubMed] [Google Scholar]
- 30.Gholami M., Rezvanfar M. R., Delavar M., Abdollahi M., Khosrowbeygi A. Effects of coenzyme Q10 supplementation on serum values of gamma-glutamyl transferase, pseudocholinesterase, bilirubin, ferritin, and high-sensitivity C-reactive protein in women with type 2 diabetes. Experimental and Clinical Endocrinology & Diabetes. 2018 doi: 10.1055/s-0043-124183. [DOI] [PubMed] [Google Scholar]
- 31.Zahedi H., Eghtesadi S., Seifirad S., et al. Effects of CoQ10 supplementation on lipid profiles and glycemic control in patients with type 2 diabetes: a randomized, double blind, placebo-controlled trial. Journal of Diabetes and Metabolic Disorders. 2014;13(1):p. 81. doi: 10.1186/s40200-014-0081-6. [DOI] [PMC free article] [PubMed] [Google Scholar]
- 32.Mohammed-Jawad N. K., Al- Sabbagh M. Role of L-carnitine and coenzyme Q10 as adjuvant therapy in patients with type 2 diabetes mellitus. American Journal of Pharmacological Sciences. 2014;2(5):82–86. doi: 10.12691/ajps-2-5-2. [DOI] [Google Scholar]
- 33.Moazen M., Mazloom Z., Ahmadi A., Dabbaghmanesh M. H., Roosta S. Effect of coenzyme Q10 on glycaemic control, oxidative stress and adiponectin in type 2 diabetes. The Journal of the Pakistan Medical Association. 2015;65(4):404–408. [PubMed] [Google Scholar]
- 34.Hosseinzadeh-Attar M., Kolahdouz Mohammadi R., Eshraghian M., et al. Reduction in asymmetric dimethylarginine plasma levels by coenzyme Q10 supplementation in patients with type 2 diabetes mellitus. Minerva Endocrinologica. 2015;40(4):259–266. [PubMed] [Google Scholar]
- 35.Lim S. C., Lekshminarayanan R., Goh S. K., et al. The effect of coenzyme Q10 on microcirculatory endothelial function of subjects with type 2 diabetes mellitus. Atherosclerosis. 2008;196(2):966–969. doi: 10.1016/j.atherosclerosis.2007.11.012. [DOI] [PubMed] [Google Scholar]
- 36.Mehrdadi P., Kolahdouz Mohammadi R., Alipoor E., Eshraghian M. R., Esteghamati A., Hosseinzadeh-Attar M. J. The effect of coenzyme Q10 supplementation on circulating levels of novel adipokine adipolin/CTRP12 in overweight and obese patients with type 2 diabetes. Experimental and Clinical Endocrinology & Diabetes. 2017;125(3):156–162. doi: 10.1055/s-0042-110570. [DOI] [PubMed] [Google Scholar]
- 37.Kolahdouz Mohammadi R., Hosseinzadeh-Attar M. J., Eshraghian M. R., Nakhjavani M., Khorami E., Esteghamati A. The effect of coenzyme Q10 supplementation on metabolic status of type 2 diabetic patients. Minerva Gastroenterologica e Dietologica. 2013;59(2):231–236. [PubMed] [Google Scholar]
- 38.Yamashita S., Yamamoto Y. Simultaneous detection of ubiquinol and ubiquinone in human plasma as a marker of oxidative stress. Analytical Biochemistry. 1997;250(1):66–73. doi: 10.1006/abio.1997.2187. [DOI] [PubMed] [Google Scholar]
- 39.Yubero D., Montero R., Martín M. A., et al. Secondary coenzyme Q10 deficiencies in oxidative phosphorylation (OXPHOS) and non-OXPHOS disorders. Mitochondrion. 2016;30:51–58. doi: 10.1016/j.mito.2016.06.007. [DOI] [PubMed] [Google Scholar]
- 40.Amin M. M., Asaad G. F., Abdel Salam R. M., El-Abhar H. S., Arbid M. S. Novel CoQ10 antidiabetic mechanisms underlie its positive effect: modulation of insulin and adiponectine receptors, tyrosine kinase, PI3K, glucose transporters, sRAGE and visfatin in insulin resistant/diabetic rats. PLoS One. 2014;9(2, article e89169) doi: 10.1371/journal.pone.0089169. [DOI] [PMC free article] [PubMed] [Google Scholar]
- 41.Loke Y., Price D., Herxheimer A. Chapter 14: adverse effects. In: JPT H., Green S., editors. Cochrane Handbook for Systematic Reviews of Interventions. Chapter 14. Chichester, UK: John Wiley & Sons; 2011. [Google Scholar]
- 42.Ioannidis J. P. A., Evans S. J. W., Gøtzsche P. C., et al. Better reporting of harms in randomized trials: an extension of the CONSORT statement. Annals of Internal Medicine. 2004;141(10):781–788. doi: 10.7326/0003-4819-141-10-200411160-00009. [DOI] [PubMed] [Google Scholar]
Associated Data
This section collects any data citations, data availability statements, or supplementary materials included in this article.
Supplementary Materials
CRD42018088474.pdf is the protocol of this systematic review and meta-analysis; PRISMA 2009 checklist.doc is the PRISMA checklist.


