

Abstract
Objective
The aim of this study was to determine the diagnostic accuracy of different machine learning algorithms for breast cancer risk calculation.
Methods
A meta-analysis was conducted of published research articles on diagnostic test accuracy of different machine learning algorithms for breast cancer risk calculation published between January 2000 and May 2018 in the online article databases of PubMed, ProQuest and EBSCO. Paired forest plots were employed for the analysis. Numerical values for sensitivity and specificity were obtained from false negative (FN), false positive (FP), true negative (TN) and true positive (TP) rates, presented alongside graphical representations with boxes marking the values and horizontal lines showing the confidence intervals (CIs). Summary receiver operating characteristic (SROC) curves were applied to assess the performance of diagnostic tests. Data were processed using Review Manager 5.3 (RevMan 5.3).
Results
A total of 1,879 articles were reviewed, of which 11 were selected for systematic review and meta-analysis. Fve algorithms for machine learning able to predict breast cancer risk were identified: Super Vector Machine (SVM); Artificial Neural Networks (ANN); Decision Tree (DT); Naive Bayes (NB); and K-Nearest Neighbor (KNN). With the SVM, the Area Under Curve (AUC) from the SROC was > 90%, therefore classified into the excellent category.
Conclusion
The meta-analysis confirmed that the SVM algorithm is able to calculate breast cancer risk with better accuracy value than other machine learning algorithms.
Keywords: Breast cancer risk, calculation, machine learning, algorithms
Introduction
Breast cancer is a heterogeneous tumor that has various subtypes with different biological behaviors and clinicopathological and molecular characteristics (Carey et al., 2006). In the last 20 years, there has been an increase in the understanding of multistep carcinogenesis and the leading role of genetic change in the diagnosis, treatment and prevention of breast cancer. This leads to an increase in prevention, detection and treatment strategies in breast cancer patients (Jemal et al., 2011; Nindrea et al., 2017; Harahap et al., 2017).
The cause of breast cancer is multifactorial. Several risk factors for breast cancer have been known nowadays. The risk factors are classified into non modifiable risk factors: age, sex, genetic factors (5-7%), family history of breast cancer, history of previous breast cancer and proliferative breast disease; modifiable risk factors: menstrual and reproductive factors, radiation exposure, hormone replacement therapy, alcohol and high fat diet; and environmental factors: organochlorine exposure, electromagnetic field and smoking (Clemons and Goss, 2001; Nindrea et al., 2018).
Increasing comprehensive knowledge and awareness of breast cancer risk could facilitate its early detection. It can be more effectively treated in earlier stage than when clinical signs and symptoms present, justifying early detection efforts (Karayurt et al., 2008; Olajide et al., 2014). Based on those studies, it is necessary to do the calculation of risk factors through an algorithm that can assist to determine whether a person has risk factors for breast cancer so it can help the early detection of breast cancer. An algorithm system using real scoring can support people to perform routine checks for early detection of breast cancer and help healthcare workers to find people at risk of developing breast cancer (Chapman et al., 2001; Han and Kamber, 2012).
Through measurement of breast cancer risk, it can be seen whether a person has a safe risk to breast cancer, adequate for breast cancer prevention or harmful to the occurrence of breast cancer. If someone in the high risk category then the action should be hastened to do screening to ascertain whether someone is likely to have breast cancer or not, whereas if someone in the prevention behavior is adequate then it is advisable to keep the behavior to avoid breast cancer, and on the other hand, when entering in the safe category then someone will be recommended to maintain the behavior and avoid risk factors for breast cancer to avoid breast cancer (Moons et al., 2009; Royston et al., 2009).
The calculation of breast cancer risk factors can be determined by using the algorithm or early detection model of breast cancer risk through determinant factors is used to detect breast cancer risk itself and is a preventive action, using machine learning by classifying the risk of breast cancer of the variable predictors, making it is easier to classify. Classification using machine learning is a type of artificial intelligence (AI) that provides computers with the ability to learn without being explicitly programmed. Machine learning has been used in cancer detection and diagnosis for a score. Machine learning methods have been used to identify, classify, detect, or distinguish tumors and other malignancies. In other words machine learning has been used primarily as an aid to cancer diagnosis and detection (Moons et al., 2009; Han and Kamber, 2012).
Machine learning algorithms are effective because their process of searching for a model function can explain and differentiate the class and concept data, which the model is determined based on the data training analysis that is class object data whose label class is already known. The types of learning algorithm are Naive Bayes, Neural Network, Decision Tree, Logistic Regression, Linear Discriminant Analysis, Super Vector Machine and K-Nearest Neighbor (Royston et al., 2009; Han and Kamber, 2012).
This study determined diagnostic test accuracy of different machine learning algorithms for breast cancer risk calculation with some research through a meta-analysis study which the conclusion drawn have a better accuracy.
Materials and Methods
Study design and research sample
This research is a quantitative research with meta-analysis study design. The meta-analysis followed the preferred reporting items for Systematic Reviews and Meta-Analysis (PRISMA) statement (Liberati et al., 2009). Meta-analysis was used to figure diagnostic test accuracy of different machine learning algorithms for breast cancer risk calculation. The research samples were published research articles published between January 2000 and May 2018 in online article databases of PubMed, ProQuest and EBSCO.
Operational definitions
The variables of this study included independent variables consisted of Machine learning algorithms: Naive Bayes, Neural Network, Decision Tree, Logistic Regression, Linear Discriminant Analysis, Super Vector Machine and K-Nearest Neighbor; and dependent variable: breast cancer risk.
Research procedure
This study was conducted by collecting data through the identification of published research articles on diagnostic test accuracy of different machine learning algorithms for breast cancer risk calculation in online article databases of PubMed, ProQuest and EBSCO (Figure 1).
Figure 1.
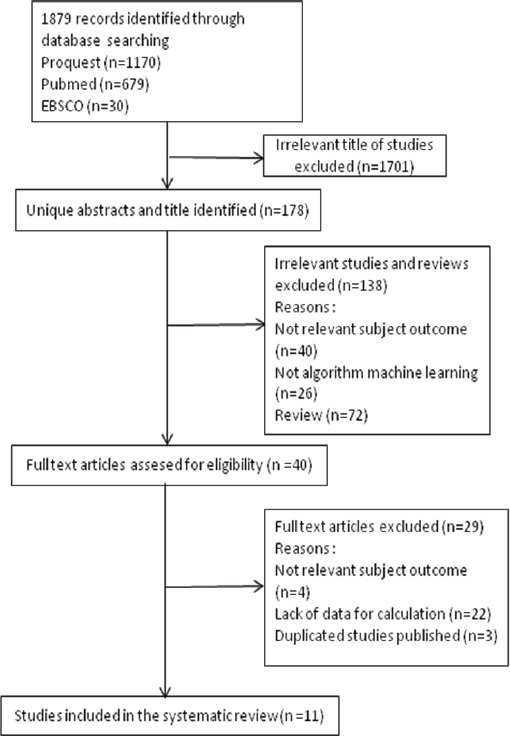
Flow Diagram Research Procedure
Identification of 1,879 articles, done by review through the title of the articles, continued by reviewing the abstract, and then the full text form. The article were excluded if: (a) not relevant subject outcome, (b) not algortihm machine learning, (c) the information provided in the results was insufficient for data extraction and (d) duplicate studies.
Data collection technique
The data collection done through online search by entering keywords as follows: ((breast cancer risk OR breast cancer risk calculation OR breast cancer prediction) AND (machine learning OR algorithms OR Naive Bayes OR Neural Network OR Decision Tree OR Logistic Regression OR Linear Discriminant Analysis OR Super Vector Machine OR K-Nearest Neighbor)).
The search was limited to english language articles. The article type was limited to journal articles. The research subject was limited to research with human subject. The time of publication was limited from January 2000 to May 2018. The abstract of articles with potentially relevant titles were reviewed, while the irrelevant articles were excluded. Furthermore, articles that have potentially relevant abstracts will be reviewed in full-text, while the irrelevant articles were excluded. The inclusion criteria of this study sample was research on machine learning algorithms for breast cancer risk calculations using Naive Bayes, Neural Network, Decision Tree, Logistic Regression, Linear Discriminant Analysis, Super Vector Machine and K-Nearest Neighbor with prognostic model study. Exclusion criteria were: the research was not available in full text form and when these criteria were not satisfied or if the provided information was insufficient for data extraction. The following data were obtained from each article: first author’s name and year of publication, size of dataset, dataset, machine learning algorithms and accuracy.
Two independent investigators carefully extracted information from all studies that satisfied the inclusion criteria in accordance with a standardized protocol. Disagreements were resolved by three other investigators. Quality assessment was conducted using Newcastle–Ottawa Quality Assessment Scale (NOS) and studies with an NOS score ≥7 were considered as high quality (Wells et al., 2009).
Data analysis
The paired forest plot analysis was generated by using mock data. Numerical values for sensitivity and specificity were obtained from false negative (FN), false positive (FP), true negative (TN) and true positive (TP). They were presented alongside graphical representations which the boxes marked the values and the horizontal lines showed the confidence intervals (CIs). The summary receiver operating characteristic (SROC) curve represented the performance of a diagnostic test. A rough guide for classifying the accuracy of a diagnostic test was based on Area Under Curve (AUC). The criteria for AUC classification are 0.90-1 (excellence), 0.80-0.90 (good), 0.70-0.80 (fair), 0.60-0.70 (poor) and 0.50-0.60 (failure) (Bradley, 1997). Data was analyzed by using Review Manager 5.3 (RevMan 5.3).
Results
The selection of studies was conducted to obtain 11 studies related to diagnostic test accuracy of different machine learning algorithms for breast cancer risk calculation (Table 1).
Table 1.
Systematic Review of Diagnostic Test Accuracy of Different Machine Learning Algorithms for Breast Cancer Risk Calculation
| First Author, Year | Size of Dataset (n) | Dataset | Machine Learning Algorithms | Accuracy (%) | NOS |
|---|---|---|---|---|---|
| Chang et al., 2003 | 250 | Primary data (pathologically proved breast tumors) | Super Vector Machine | 85.6 | 7 |
| Polat and Gunes, 2007 | 683 | Wisconsin breast cancer dataset | Super Vector Machine | 95.89 | 7 |
| Akay, 2009 | 683 | Wisconsin breast cancer dataset | Super Vector Machine | 99.51 | 7 |
| Ayer et al., 2010 | 62,219 | Wisconsin state cancer reporting system | Artificial Neural Networks | 96.5 | 8 |
| Dramicanin et al., 2012 | 42 | Primary data (breast tissue specimens) | Super Vector Machine | 64.29 | 6 |
| Subramanian et al., 2014 | 40 | Primary data (mammographic image) | a. Super Vector Machine b. Artificial Neural Networks c. Decision Tree d. Naive Bayes |
a. 62.5 b. 75 c. 67.5 d. 75 |
6 |
| Mert et al., 2015 | 569 | Wisconsin diagnostic breast cancer dataset | a. K-Nearest Neighbor b. Artificial Neural Networks c. Radial Basis Function Neural Network d. Super Vector Machine |
a. 93.14 b. 97.53 c. 87.17 d. 95.25 |
7 |
| Milosevic et al., 2015 | 300 | The Mini Mammographic Database | a. Super Vector Machine b. K-Nearest Neighbor c. Naive Bayes |
a. 83.7 b. 54.3 c. 77.3 |
7 |
| Sun et al., 2015 | 340 | Primary data (digital mammograms) | Super Vector Machine | 72.9 | 7 |
| Asri et al., 2016 | 699 | Wisconsin breast cancer dataset | a. Support Vector Machine b. Decision Tree c. Naive Bayes d. K-Nearest Neighbors |
a. 97.13 b. 95.13 c. 95.99 d. 95.27 |
8 |
| Heidari et al., 2018 | 500 | Primary data (full-field digital mammography) | Super Vector Machine | 60.8 | 7 |
NOS, Newcastle–Ottawa Quality Assessment Scale
Based on the results of systematic review there were 11 studies analyzed by meta-analysis. The research variables analyzed based on the systematic review that had been done were Super Vector Machine (SVM), Artificial Neural Networks (ANN), Decision Tree (DT), Naive Bayes (NB) and K-Nearest Neighbor (KNN).
Meta-analysis study of breast cancer risk calculation using super vector machine was shown in Figure 2. Figure 2 shows there were 10 studies of breast cancer risk calculation using super vector machine algorithm, the sensitivity value of the algorithm was between 0.67 and 0.99, while the specificity value was 0.60 to 0.98.
Figure 2.
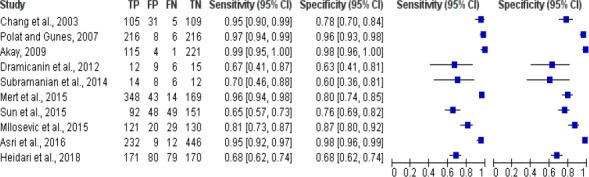
Forest Plot Breast Cancer Risk Calculation Using Super Vector Machine
The results of meta analysis study of breast cancer risk calculation using artificial neural network was shown in Figure 3. Figure 3 shows there were 3 studies of breast cancer risk calculation using artificial neural network algorithm, the sensitivity of the algorithm was between 0.84 and 0.97, while the specificity value was 0.71 to 0.99.
Figure 3.
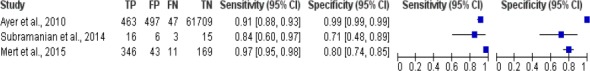
Forest Plot Breast Cancer Risk Calculation Using Artificial Neural Network
The results of meta-analysis study of breast cancer risk calculation using decision tree was shown in Figure 4. Figure 4 shows there were 2 studies of breast cancer risk calculation using decision tree algorithm, the sensitivity value of the algorithm was between 0.90 and 0.92, while the specificity value was 0.79 to 0.97.
Figure 4.
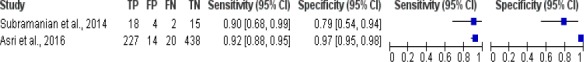
Forest Plot Breast Cancer Risk Calculation Using Decision Tree
The results of meta-analysis study of breast cancer risk calculation using naive bayes was shown in Figure 5. Figure 5 shows there were 3 studies of breast cancer risk calculation using naive bayes algorithm, the sensitivity of the algorithm was between 0.76 and 0.91, while the specificity value was 0.78 to 0.99.
Figure 5.
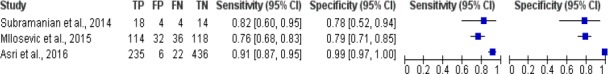
Forest Plot Breast Cancer Risk Calculation Using Naive Bayes
The results of meta-analysis study of breast cancer risk calculation using K-Nearest Neighbor was shown in Figure 6. Figure 6 shows there were 3 studies of breast cancer risk calculation using K-Nearest Neighbor algorithm, the sensitivity value of the algorithm was between 0.56 and 0.95, while the specificity value was 0.53 to 0.96.
Figure 6.
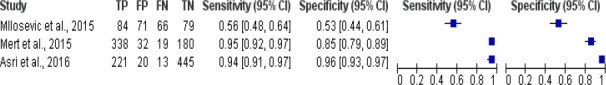
Forest Plot Breast Cancer Risk Calculation Using K-Nearest Neighbor
Summary Receiver Operating Characteristic (SROC) plot was based on the results of meta-analysis study of breast cancer risk calculation using machine learning algorithms (Figure 7).
Figure 7.
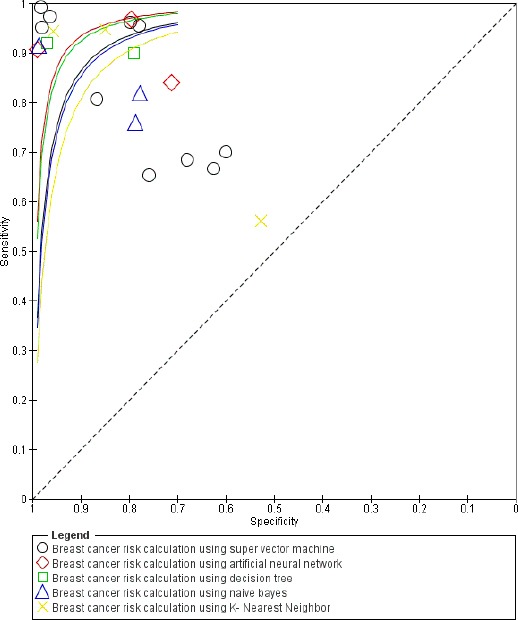
SROC Plot Breast Cancer Risk Calculation Using Machine Learning Algorithms
Figure 7 shows there were 5 studies from 10 studies with Area Under Curve (AUC) > 90% which describes breast cancer risk calculation using super vector machine algorithm were classified into excellent category, while the other 5 studies were classified into good to fair category. One of 3 studies with AUC > 90% which describes breast cancer risk calculation using artificial neural network algorithm was classified into excellent category, while the other 2 studies were classified into good category (0.80 to 0.90). One of 2 studies with AUC > 90% which describes breast cancer risk calculation using decision tree algorithm was classified into excellent category, while the another study was into good category (0.80 to 0.90). One of 3 studies with AUC > 90% which describes breast cancer risk calculation using naive bayes algorithm was classified into excellent category, while the other 2 studies were classified into fair category (0.70 to 0.80). There were 2 of 3 studies with AUC > 90% which describes breast cancer risk calculation using K-Nearest Neighbor algorithm that were classified into excellent category, while another study was classified into failure category (0.50 to 0.60).
Discussion
Based on an epidemiological data set, demonstrated that the super vector machine (SVM) algorithm produced the best Area Under Curve (AUC) among the four classifier algorithms ie. artificial neural network (ANN), decision tree (DT), naive bayes (NB) and K-Nearest Neighbor (KNN) in meta-analysis results. In the SVM there were 5 studies from 10 studies with AUC > 90% which describes breast cancer risk calculation using super vector machine algorithm were classified into excellent category.
The accuracy of the SVM for classifying malignancies was 85.6% (214 of 250); the sensitivity, 95.45% (105 of 110); the specificity, 77.86% (109 of 140); the positive predictive value, 77.21% (105 of 136); and the negative predictive value, 95.61% (109 of 114) (Chang et al., 2003).The highest classification accuracy (99.51%) was obtained by the SVM model, and this is very promising compared to the previously reported results (Akay, 2009).
To analyze medical data, various data mining and machine learning methods were available. An important challenge in data mining and machine learning areas was done to build accurate and computationally efficient classifiers for Medical applications. Based on the use four main algorithms: SVM, NB, k-NN and C4.5 on the Wisconsin Breast Cancer (original) datasets to compared efficiency and effectiveness of those algorithms in terms of accuracy, precision, sensitivity and specificity to find the best accuracy classification. SVM reached with accuracy of 97.13% and outperformed the others, therefore, all other algorithms. In conclusion, SVM had proven its efficiency in Breast Cancer prediction and diagnosis and achieved the best performance in terms of precision and low error rate (Asri et al., 2016). SVM algorithm can predict breast cancer risk and has a better accuracy value than other algorithms (Polat and Gunes, 2006; Akay, 2009; Heidari et al., 2017).
Classification algorithms for pattern recognition and discrimination problems are usually regarded as ‘black-boxes.’ Therefore, the consideration of all possible risk factors and transfer functions in an algorithm is a difficult and tremendously timeconsuming process. Optimization of all of the possible approaches would take more than several months, even with high performance personal computers. However, after the final training of an algorithm with the optimal selection of risk factor combinations, the assessment of an individual woman would take under several seconds. For further enhancement of the classifier performance, ensemble methods using SVM, ANN, DT, NB, KNN and other classification algorithms could be employed. The main idea of the ensemble method is that the performance of combining the classifiers is superior to that of each individual classifier in a certain discrimination problem (Subramanian et al., 2014; Mert et al., 2015; Milosevic et al., 2015).
There is no doubt that evaluation of data taken from patients and decisions of experts are the most important factors influencing the prediction of breast cancer risk. However, different machine learning techniques can also help the early detection of breast cancer. They help reduce the possible errors that can be done because of fatigued or inexperienced experts and provide medical data to be examined in shorter time and in more detail. The most common tumor in the female population is breast cancer. This disease could have different impacts on any patient. Many breast cancer patients were multifactorial. If the risk factors could be detected in early stage so it could produce a better treatment of the breast cancer (Stodjadinovic et al., 2010; Cvetkovic, 2017; Ehtemam et al., 2017; Nindrea et al., 2018).
As a systematic review, this meta-analysis should be carefully interpreted because of some limitations. First, the number of dataset in two studies is relatively small (Dramicanin et al., 2012; Subramanian et al., 2014) which can reduce the statistical power. Second, several studies only used one machine learning algorithm without known comparison between other machine learning algorithm.
The expected benefits of the present method are only simple interviews or direct inputs of questionnaire regarding a subject’s status are required to perform a discrimination of breast cancer risk. However, regular mammography inspections are required for the detection of a newly developed cancer. The proposed methodology does not determine the onset of breast cancer, which can be performed through mammographic diagnosis. However, it can encourage potential breast cancer-prone women to go the hospital for diagnostic tests. Therefore, the early diagnosis of breast cancer will be more effective, and the mortality rate of breast cancer will decrease. Additionally, if the present method is designed in the form of a web-based or smartphone application, women who want to know their own risk of breast cancer will be able to access this information easily in daily life.
Conflict of interest
The authors declare no conflict of interest.
Acknowledgements
The authors would thanks to Dana Masyarakat (DAMAS) grant Faculty of Medicine, Public Health and Nursing Universitas Gadjah Mada 2018 for help this research. Syafruddin, MD for collecting data. Mutia Lailani, MD for translating.
References
- 1.Akay MF. Support vector machines combined with feature selection for breast cancer diagnosis. Expert Syst Appl. 2009;36:3240–7. [Google Scholar]
- 2.Asri H, Mousannif H, Al moatassime H, Noel T. Using machine learning algorithms for breast cancer risk prediction and diagnosis. Procedia Comput Sci. 2016;83:1064–9. [Google Scholar]
- 3.Ayer T, Alagoz O, Chhatwal J, et al. Breast cancer risk estimation with artificial neural networks revisited: discrimination and calibration. Cancer. 2010;116:3310–21. doi: 10.1002/cncr.25081. [DOI] [PMC free article] [PubMed] [Google Scholar]
- 4.Bradley AP. The use of the area under the ROC curve in the evaluation of machine learning algorithms. Pattern Recognit. 1997;30:1145–59. [Google Scholar]
- 5.Carey LA, Perou CM, Livasy CA, et al. Race, breast cancer subtypes, and survival in the carolina breast cancer study. JAMA. 2006;295:2492–502. doi: 10.1001/jama.295.21.2492. [DOI] [PubMed] [Google Scholar]
- 6.Chang RF, Wu WJ, Moon WK, Chou YH, Chen DR. Support Vector machines for diagnosis of breast tumors on US images. Acad Radiol. 2003;10:189–97. doi: 10.1016/s1076-6332(03)80044-2. [DOI] [PubMed] [Google Scholar]
- 7.Chapman WW, Fizman M, Chapman BE, Haug PJ. A comparison of classification algorithms to automatically identify chest x-ray reports that support pneumonia. J Biomed Inform. 2001;34:4–14. doi: 10.1006/jbin.2001.1000. [DOI] [PubMed] [Google Scholar]
- 8.Clemons M, Goss P. Estrogen and the risk of breast cancer. N Engl J Med. 2001;344:276–85. doi: 10.1056/NEJM200101253440407. [DOI] [PubMed] [Google Scholar]
- 9.Cvetkovic J. Breast cancer patients'depression prediction by machine learning approach. Cancer Invest. 2017;35:569–72. doi: 10.1080/07357907.2017.1363892. [DOI] [PubMed] [Google Scholar]
- 10.Dramicanin T, Lenhardt L, Zekovic I, Dramicanin MD. Support Vector machine on fluorescence landscapes for breast cancer diagnostics. J Fluoresc. 2012;22:1281–9. doi: 10.1007/s10895-012-1070-0. [DOI] [PubMed] [Google Scholar]
- 11.Ehtemam H, Montazeri M, Khajouei R, et al. Prognosis and early diagnosis of ductal and lobular type in breast cancer patient. Iran J Public Health. 2017;46:1563–71. [PMC free article] [PubMed] [Google Scholar]
- 12.Han J, Kamber M. Data mining: concepts and techniques. 3rd edition. USA: Elsevier; 2012. pp. 5–6. [Google Scholar]
- 13.Harahap WA, Ramadhan Khambri D, Haryono S, Nindrea RD. Outcomes of trastuzumab therapy for 6 and 12 months in Indonesian national health insurance system clients with operable HER2-positive breast cancer. Asian Pac J Cancer Prev. 2017;18:1151–7. doi: 10.22034/APJCP.2017.18.4.1151. [DOI] [PMC free article] [PubMed] [Google Scholar]
- 14.Heidari M, Khuzani AZ, Hollingsworth AB, et al. Prediction of breast cancer risk using a machine learning approach embedded with a locality preserving projection algorithm. Phys Med Biol. 2018;63:035020. doi: 10.1088/1361-6560/aaa1ca. [DOI] [PMC free article] [PubMed] [Google Scholar]
- 15.Jemal A, Bray F, Ferlay J, et al. Global cancer statistics. CA Cancer J Clin. 2011;61:69–90. doi: 10.3322/caac.20107. [DOI] [PubMed] [Google Scholar]
- 16.Karayurt O, Ozmen D, Cetinkaya AC. Awareness of breast cancer risk factors and practice of breast self examination among high school students in Turkey. BMC Public Health. 2008;8:359. doi: 10.1186/1471-2458-8-359. [DOI] [PMC free article] [PubMed] [Google Scholar]
- 17.Liberati A, Altman DG, Tetzlaff J, et al. The PRISMA statement for reporting systematic reviews and meta-analyses of studies that evaluate healthcare interventions: explanation and elaboration. BMJ. 2009;339:2700. doi: 10.1136/bmj.b2700. [DOI] [PMC free article] [PubMed] [Google Scholar]
- 18.Mert A, Kilic N, Bilgili E, Akan A. Breast cancer detection with reduced feature set. Comput Math Method M. 2015;2015:1–11. doi: 10.1155/2015/265138. [DOI] [PMC free article] [PubMed] [Google Scholar]
- 19.Milosevic M, Jankovic D, Peulic A. Comparative analysis of breast cancer detection in mammograms and thermograms. Biomed Tech (Berl) 2015;60:49–56. doi: 10.1515/bmt-2014-0047. [DOI] [PubMed] [Google Scholar]
- 20.Moons KG, Altman DG, Vergouwe Y, Royston P. Prognosis and prognostic research: application and impact of prognostic models in clinical practice. BMJ. 2009;338:b606. doi: 10.1136/bmj.b606. [DOI] [PubMed] [Google Scholar]
- 21.Nindrea RD, Aryandono T, Lazuardi L. Breast cancer risk from modifiable and non-modifiable risk factors among women in Southeast Asia: a meta-analysis. Asian Pac J Cancer Prev. 2017;18:3201–6. doi: 10.22034/APJCP.2017.18.12.3201. [DOI] [PMC free article] [PubMed] [Google Scholar]
- 22.Nindrea RD, Harahap WA, Aryandono T, Lazuardi L. Association of BRCA1 Promoter methylation with breast cancer in Asia: a meta- analysis. Asian Pac J Cancer Prev. 2018;19:885–9. doi: 10.22034/APJCP.2018.19.4.885. [DOI] [PMC free article] [PubMed] [Google Scholar]
- 23.Olajide TO, Ugburo AO, Habeebu MO, et al. Awareness and practice of breast screening and its impact on early detection and presentation among breast cancer patients attending a clinic in Lagos, Nigeria. Niger J Clin Pract. 2014;17:802–7. doi: 10.4103/1119-3077.144404. [DOI] [PubMed] [Google Scholar]
- 24.Polat K, Gunes S. Breast cancer diagnosis using least square support vector machine. Digit Signal Process. 2007;17:694–701. [Google Scholar]
- 25.Royston P, Moons KG, Altman DG, Vergouwe Y. Prognosis and prognostic research: developing a prognostic model. BMJ. 2009;338:b604. doi: 10.1136/bmj.b604. [DOI] [PubMed] [Google Scholar]
- 26.Subramanian J, Karmegam A, Papageorgiou E, Papandrianos N, Vasukie A. An integrated breast cancer risk assessment and management model based on fuzzy cognitive maps. Comput Methods Programs Biomed. 2015;118:280–97. doi: 10.1016/j.cmpb.2015.01.001. [DOI] [PubMed] [Google Scholar]
- 27.Sun W, Tseng TL, Qian W, et al. Using multiscale texture and density features for near-term breast cancer risk analysis. Med Phys. 2015;42:2853–62. doi: 10.1118/1.4919772. [DOI] [PMC free article] [PubMed] [Google Scholar]
- 28.Stodjadinovic A, Eberhardt C, Henry L, et al. Development of a bayesian classifier for breast cancer risk stratification: a feasibility study. Eplasty. 2010;29:e25. [PMC free article] [PubMed] [Google Scholar]
- 29.Wells GA, Shea B, O'Connell D, et al. The Newcastle-Ottawa Scale (NOS) for assessing the quality of nonrandomised studies in meta-analyses. 2009. [[cited 2018 May 5]]. Available from: http://www.ohri.ca/programs/clinical_epidemiology/oxford.asp .