

Abstract
Key points
It has been suggested that leucine is primarily responsible for the increase in muscle protein synthesis after protein ingestion because leucine uniquely activates the mTOR‐p70S6K signalling cascade.
We compared the effects of ingesting protein or an amount of leucine equal to that in the protein during a hyperinsulinaemic‐euglycaemic clamp (to eliminate potential confounding as a result of differences in the insulinogenic effect of protein and leucine ingestion) on muscle anabolic signalling and protein turnover in 28 women.
We found that protein, but not leucine, ingestion increased muscle p‐mTORSer2448 and p‐p70S6KThr389, although only protein, and not leucine, ingestion decreased muscle p‐eIF2αSer51 and increased muscle protein synthesis.
Abstract
It has been suggested that leucine is primarily responsible for the increase in muscle protein synthesis (MPS) after protein ingestion because leucine uniquely activates the mTOR‐p70S6K signalling cascade. We tested this hypothesis by measuring muscle p‐mTORSer2448, p‐p70S6KThr389 and p‐eIF2αSer51, as well as protein turnover (by stable isotope labelled amino acid tracer infusion in conjunction with leg arteriovenous blood and muscle tissue sampling), in 28 women who consumed either 0.45 g protein kg−1 fat‐free mass (containing 0.0513 g leucine kg−1 fat‐free mass) or a control drink (n = 14) or 0.0513 g leucine kg−1 fat‐free mass or a control drink (n = 14) during a hyperinsulinaemic‐euglycaemic clamp procedure (HECP). Compared to basal conditions, the HECP alone (without protein or leucine ingestion) suppressed muscle protein breakdown by ∼20% and increased p‐mTORSer2448 and p‐p70S6KThr389 by >50% (all P < 0.05) but had no effect on p‐eIF2αSer51 and MPS. Both protein and leucine ingestion further increased p‐mTORSer2448 and p‐p70S6KThr389, although only protein, and not leucine, ingestion decreased (by ∼35%) p‐eIF2αSer51 and increased (by ∼100%) MPS (all P < 0.05). Accordingly, leg net protein balance changed from negative (loss) during basal conditions to equilibrium during the HECP alone and the HECP with concomitant leucine ingestion and to positive (gain) during the HECP with concomitant protein ingestion. These results provide new insights into the regulation of MPS by demonstrating that leucine and mTOR signalling alone are not responsible for the muscle anabolic effect of protein ingestion during physiological hyperinsulinaemia, most probably because they fail to signal to eIF2α to initiate translation and/or additional amino acids are needed to sustain translation.
Keywords: amino acid sensing, anabolic signalling, protein turnover
Key points
It has been suggested that leucine is primarily responsible for the increase in muscle protein synthesis after protein ingestion because leucine uniquely activates the mTOR‐p70S6K signalling cascade.
We compared the effects of ingesting protein or an amount of leucine equal to that in the protein during a hyperinsulinaemic‐euglycaemic clamp (to eliminate potential confounding as a result of differences in the insulinogenic effect of protein and leucine ingestion) on muscle anabolic signalling and protein turnover in 28 women.
We found that protein, but not leucine, ingestion increased muscle p‐mTORSer2448 and p‐p70S6KThr389, although only protein, and not leucine, ingestion decreased muscle p‐eIF2αSer51 and increased muscle protein synthesis.
Introduction
Muscle mass is maintained by a tightly controlled balance between muscle protein synthesis (MPS) and muscle protein breakdown (MPB). During basal, postabsorptive conditions, the rate of MPB exceeds the rate of MPS, causing a net loss of protein (Rennie et al. 2004). Meal intake compensates for the postabsorptive loss of muscle protein because dietary protein‐derived amino acids stimulate MPS and insulin suppresses MPB (Rennie et al. 2004). The postprandial net protein gain is largely determined by the amount of protein ingested because the postprandial increase in plasma amino acids stimulates MPS in a dose‐dependent manner, whereas the plasma insulin concentration necessary to achieve maximal suppression of MPB (∼15‐30 mU L−1) already occurs after consuming a small amount of protein or carbohydrate (Bohe et al. 2003; Greenhaff et al. 2008; Moore et al. 2009). The exact mechanism(s) responsible for the stimulatory effect of postprandial hyperaminoacidemia on MPS is unclear. Leucine probably plays a key role in stimulating postprandial MPS because it uniquely activates the mTOR‐p70S6K signalling cascade (Atherton et al. 2010; Iwanaka et al. 2010; Moberg et al. 2014), which is essential for myocellular hypertrophy (Goodman et al. 2011; Walker et al. 2011; Moro et al. 2016). Furthermore, increasing the leucine content of mixed meals or protein beverages augments the postprandial increase in MPS (Rieu et al. 2006; Wall et al. 2013; Churchward‐Venne et al. 2014; Murphy et al. 2016; Devries et al. 2018) and we have found that leucine, but not total protein, ingestion determines the increase in muscle mTOR‐p70S6K (Smith et al. 2015c). However, it is not known whether leucine alone is responsible for the increase in MPS after protein ingestion.
The present study aimed to compare the effects of ingesting protein or an amount of leucine equal to that in the protein on muscle protein turnover. Participants ingested either 0.45 g whey protein kg−1 fat‐free mass (FFM), containing 0.0513 g leucine kg−1 FFM, or 0.0513 g leucine kg−1 FFM alone during a hyperinsulinaemic‐euglycaemic clamp procedure (HECP) to eliminate potential confounding as a result of differences in the insulinogenic effect of protein and leucine ingestion. 2H‐labelled phenylalanine and leucine tracers were infused throughout the study. Leg arteriovenous blood and thigh muscle biopsy sampling was used to determine net protein kinetics.
Methods
Human subjects research regulatory compliance
The study was approved and monitored by the Human Research Protection Office at Washington University School of Medicine (St Louis, MO, USA). Written informed consent was obtained from all participants before their participation.
Study participants
Twenty‐eight sedentary (<1.5 h of exercise/week), 50–65‐year‐old postmenopausal women participated in the present study: 14 in the protein group and 14 in the leucine group. All potential participants completed a comprehensive medical examination, including a history and physical examination, a resting electrocardiogram, standard blood tests, and an oral glucose tolerance test. Exclusion criteria included evidence of chronic illness or significant organ dysfunction (e.g. diabetes, kidney disease), taking medications (including hormone replacement therapy) that could interfere with the action of insulin or protein metabolism, excessive alcohol intake (> 20 g per day), and smoking or chewing tobacco products. Participants’ body fat mass and FFM were determined using dual energy X‐ray absorptiometry (Lunar iDXA; GE Healthcare Lunar, Madison, WI, USA) and thigh muscle volume was determined using magnetic resonance imaging as described previously (Smith et al. 2015a). Details concerning the age, body composition and thigh muscle volume of participants are presented in Table 1.
Table 1.
Age, body composition and thigh muscle volume of participants
| Protein group | Leucine group | P | |
|---|---|---|---|
| Age (years) | 57.4 ± 1.2 | 60.1 ± 0.9 | 0.09 |
| Body mass index (kg m−2) | 33.6 ± 0.7 | 36.2 ± 1.2 | 0.08 |
| Body mass (kg) | 90.7 ± 2.1 | 98.7 ± 3.6 | 0.07 |
| Body fat (%) | 48.3 ± 0.9 | 50.4 ± 1.1 | 0.15 |
| Thigh muscle volume (cm3) | 3,639 ± 87 | 3,568 ± 91 | 0.58 |
Data are the mean ± SEM; n = 14 per group.
Protein metabolism studies
Each participant completed two HECP in randomized order in conjunction with or without protein ingestion (n = 14) or in conjunction with or without leucine ingestion (n = 14). Before each HECP, participants were instructed to adhere to their usual diet and to refrain from vigorous physical activity for 3 days. In the late afternoon before the HECP, participants were admitted to the Clinical Translational Research Unit (Washington University School of Medicine, St Louis, MO, USA) where they consumed a standard dinner between 18.00 h and 19.00 h, and then fasted, except for water, until the next morning. At 06.00 h, a catheter was inserted into an arm vein for the infusion of 2H‐labelled phenylalanine and leucine tracers; catheters for blood sampling were inserted into the radial artery of the opposite arm and in retrograde fashion into the femoral vein of one leg. At 06.45 h, primed, constant infusions of [ring‐2H5]phenylalanine (priming dose: 6.0 μmol kg FFM−1, infusion rate: 0.10 μmol kg FFM−1 min−1) and [5,5,5‐2H3]leucine (priming dose: 6.3 μmol kg FFM−1; 0.14 μmol kg FFM−1 min−1), both purchased from Cambridge Isotope Laboratories Inc. (Andover, MA, USA), were started and maintained for 7 hours. Four hours after the start of the tracer infusions, a HECP was started and maintained for 3 h. Human insulin (Novolin R; Novo Nordisk, Princeton, NJ, USA) was infused at a rate of 50 mU m−2 body surface area (BSA) min−1 (initiated with a 10 min step‐down priming infusion of 200 mU m−2 BSA min−1 for the initial and 100 mU m−2 BSA min−1 for the subsequent 5 min). Euglycaemia (blood glucose ∼5.6 mm) was maintained by variable rate infusion of 20% dextrose (Baxter, Deerfield, IL, USA). To adjust for the insulin‐mediated suppression of whole body proteolysis, the phenylalanine and leucine tracer infusion rates were reduced to 0.08 μmol kg FFM−1 min−1 and 0.10 μmol kg FFM−1 min−1, respectively, during the HECP.
Participants in the protein group consumed either 0.45 g of whey protein (unflavored Unjury; ProSynthesis Laboratories, Inc., Reston, VA, USA) per kg FFM (containing 0.0513 g leucine per kg FFM) dissolved in 270 mL of water or an equivalent volume of water (control study) in small aliquots every 20 min during the 3 h HECP. The total amount of protein ingested was 20.7 ± 0.5 g (containing 2.4 ± 0.1 g leucine). To minimize changes in arterial plasma leucine and phenylalanine enrichments as a result of an increased amino acid appearance in plasma during protein ingestion, [5,5,5‐2H3]leucine and [ring‐2H5]phenylalanine, equivalent to 5% and 6% of the leucine and phenylalanine content in whey protein, respectively, were added to the protein drinks. Participants in the leucine group consumed either 0.0513 g leucine (Sigma‐Aldrich, Inc., St Louis, MO, USA) per kg FFM (total: 2.4 ± 0.1 g) enriched to 5% with [5,5,5‐2H3]leucine or an equivalent volume of the control solution only in small aliquots every 20 min during the 3 h HECP. The protein or leucine ingestion and respective control studies were conducted in randomized order, 1–4 weeks apart.
Arterial and femoral venous blood samples were obtained immediately before starting the tracer infusions, every 6–7 min during the last 20 min of the basal period, 1 h and 2 h after starting the HECP, and every 6–7 min during last 20 min of the HECP. Additional arterial blood samples were obtained every 10 min during the HECP to monitor blood glucose concentration. Leg blood flow in the common femoral artery was measured at regular intervals between 2 h and 3 h after starting the tracer infusions (basal period) and between 1 h and 3 h after starting the HECP using Doppler ultrasound (M‐Turbo; Sonosite Inc., Bothell, WA, USA) and a linear array 13 to 6 MHz frequency probe (Sonosite Inc.) (Radegran & Saltin, 1999). In nine of the 14 subjects in each group, muscle tissue samples from the quadriceps femoris were obtained under local anaesthesia (lidocaine HCl, 2%; Hospira Inc., Lake Forest, IL, USA) using a Tilley‐Henkel forceps 1 h and 4 h after starting the tracer infusions (basal period) and 3 h after starting the HECP to determine muscle protein fractional turnover and the contents of the key cell growth stimulators p‐mTORSer2448 and p‐p70S6KThr389, which sense an increase in amino acids, the eIF2 kinase p‐GCN2Thr899, which senses uncharged t‐RNA, and the inhibitory translation initiation factor p‐eIF2αSer51.
Sample processing and analysis
Blood samples were collected in chilled tubes containing heparin (to determine glucose and insulin concentrations) or EDTA (to determine amino acid concentrations and enrichments). Samples were placed in ice and plasma was separated by centrifugation within 30 min of collection and then stored at −80°C until final analyses. Muscle samples were rinsed in ice‐cold saline immediately after collection, cleared of visible fat and connective tissue, frozen in liquid nitrogen and stored at −80°C until final analysis.
Plasma glucose concentration was determined using an automated glucose analyser (Yellow Spring Instruments Co, Yellow Springs, OH, USA). The plasma insulin concentrations were measured using a commercially available enzyme‐linked immunosorbent assay (EMD Millipore, St Charles, MO, USA). Plasma phenylalanine and leucine concentrations and enrichments were determined using gas‐chromatography/mass‐spectrometry (GC‐MS; MSD 5973 System, Hewlett‐Packard, Palo Alto, CA, USA) after adding known amounts of internal standards to each sample and converting the amino acids to their t‐butyldimethylsilyl (t‐BDMS) derivatives (Smith et al. 2007). The concentrations of additional amino acids were determined by GC‐MS using the EZ:faast Amino Acid Analysis kit (Phenomenex, Torrance, CA, USA).
To determine phenylalanine enrichment in muscle proteins and muscle free phenylalanine and leucine concentrations and enrichments, ∼20 mg of each muscle biopsy sample was homogenized in 1 mL of trichloroacetic acid solution (3% w/v) after the addition of known amounts of internal standards. Muscle proteins were then precipitated by centrifugation and the supernatant, containing free amino acids, was collected. The pellet containing muscle proteins was hydrolysed in HCl. The supernatant, containing free amino acids was purified by passing it through a 0.2 μm filter. Amino acids in the hydrolysate and eluent were converted to their t‐BDMS derivative and analysed by GC‐MS (Smith et al. 2007).
The concentrations of phosphorylated intramuscular amino acid sensing proteins and proteins involved in translation initiation (p‐mTORSer2448, p‐p70S6KThr389, p‐GCN2Thr899 and p‐eIF2αSer51) were quantified by western analysis as described previously (Smith et al. 2015c). Frozen muscle tissue was rapidly homogenized in ice‐cold cell lysis buffer (Cell Signaling Technology, Beverly, MA, USA) and proteins were extracted (Yoshino et al. 2012). Then, 20 μg of protein from each sample was loaded onto gradient (4–20%) polyacrylamide gels (Bio‐Rad Laboratories, Hercules, CA, USA), separated by SDS‐PAGE and transferred to Immobilo polyvinylidene difluoride membranes (Millipore, Bedford, MA, USA). The blotted membranes were incubated with the following primary antibodies: rabbit polyclonal anti‐phospho‐mTOR (Ser2448) (#2971; Cell Signaling Technology), rabbit monoclonal anti‐phospho‐p70S6K (Thr389) (#9234; Cell Signaling Technology), rabbit monoclonal anti‐phospho‐GCN2 (Thr899) (#75836; Abcam, Cambridge, UK) and rabbit monoclonal anti‐phospho‐eIF2α (Ser51) (#3398 Cell Signaling Technology). All blots were incubated with horseradish peroxidase‐conjugated anti‐rabbit antibodies and developed using Amersham ECL Select Western Blotting Detection Reagent (#RPN2235; GE Healthcare Life Sciences, Piscataway, NJ, USA). The p‐mTORSer2448 and p‐p70S6KThr389 data have been reported previously in a study evaluating the effects of protein and leucine ingestion on muscle p‐mTORSer2448 and the action of insulin (Smith et al. 2015c).
Calculations
Phenylalanine and leucine kinetics across the leg were calculated using a two‐pool model and recently described equations (Smith et al. 2015b):
| (1) |
| (2) |
| (3) |
where CTA and CTV are total (i.e. tracee + tracer) plasma amino acid concentrations in the artery and femoral vein, respectively; MPEA and MPEV represent the mole percent excess of the amino acids in arterial and femoral venous plasma, respectively; and PF is plasma flow (mL min−1) calculated from the measured blood flow adjusted for haematocrit (Hct). Leg Ra represents the rate of amino acid release into the vein from protein breakdown and leg Rd reflects the rate of arterial plasma amino acids taken up by the muscle for protein synthesis (phenylalanine) or protein synthesis and oxidation (leucine).
Phenylalanine intramuscular Ra from proteolysis and intramuscular Rd to protein synthesis were calculated using a three‐pool model:
| (4) |
where MPEM is the mole percent excess of phenylalanine in the muscle free pool, and FM,A is inward transport, calculated as {[(MPEM − MPEV)/(MPEA − MPEM) × CTV] + CTA} × PF
| (5) |
The mixed muscle protein fractional synthesis rate (FSR) was calculated by dividing the increment in [2H5]phenylalanine enrichment in muscle protein over time by either the [2H5]phenylalanine enrichment in plasma (weighted average from samples collected during basal conditions and at 1 h and 2 h, as well as during last 20 min of the HECP) or the muscle intracellular free precursor pool. The results were not affected by the choice of precursor.
Statistical analysis
Statistical analyses were carried out using SPSS, version 24 (IBM Corp., Armonk, NY, USA). Student's t test was used to compare the basic characteristics of participants in the protein and leucine groups. Three‐way ANOVA, with group (protein vs. leucine) as the between subject factor and study (control vs. protein or leucine ingestion) and time (basal vs. clamp) as within subject factors, was used to evaluate the effect of the HECP with and without concomitant protein or leucine ingestion on plasma metabolite and hormone concentrations, leg plasma flow, muscle free amino acid concentrations, intramuscular signalling protein contents and muscle protein turnover. When statistically significant interactions were found, Tukey's post hoc procedure was used to locate the differences. P < 0.05 was considered statistically significant. Data are presented as the mean ± SEM unless otherwise noted.
Results
Arterial plasma glucose and insulin concentrations and leg plasma flow (Table 2)
During basal conditions, plasma glucose and insulin concentrations and leg plasma flow were not different among the protein and leucine groups and their respective control studies. During the HECP, the plasma glucose concentration was maintained at the 5.6 mm target in all studies; the insulin concentration increased ∼10‐fold and leg plasma flow increased by ∼20% above basal values in all studies (no difference among groups and studies).
Table 2.
Arterial plasma glucose and insulin concentrations and leg plasma flow
| Protein group | Leucine group | |||
|---|---|---|---|---|
| Control | Protein | Control | Leucine | |
| Glucose (mm) | ||||
| Basal | 5.05 ± 0.05 | 5.12 ± 0.06 | 5.38 ± 0.13 | 5.27 ± 0.10 |
| HECP | 5.62 ± 0.04* | 5.59 ± 0.05* | 5.58 ± 0.06* | 5.57 ± 0.05* |
| Insulin (mU L−1) | ||||
| Basal | 4.6 (3.5, 6.8) | 4.5 (2.7, 6.0) | 5.4 (4.8, 7.4) | 5.5 (4.0, 6.9) |
| HECP | 58.2 (49.3, 65.7)* | 65.4 (57.7, 75.9)* | 53.7 (48.8, 65.9)* | 52.2 (47.2, 64.3)* |
| Plasma flow (mL min−1) | ||||
| Basal | 167 ± 18 | 173 ± 16 | 204 ± 43 | 184 ± 23 |
| HECP | 206 ± 24* | 208 ± 19* | 244 ± 46* | 230 ± 29* |
Data are the mean ± SEM or medians (quartile 1, quartile 4); n = 14 per group.
*Significant main effect of HECP (P < 0.05).
Arterial and venous plasma and muscle free amino acid concentrations (Fig. 1 and Table 3)
During basal conditions, plasma amino acid concentrations were not different among the protein and leucine groups and their respective control studies. Arterial plasma total essential and non‐essential amino acid concentrations decreased by ∼15–30% during the HECP in the control studies and during the HECP with concomitant leucine ingestion but increased by ∼65% (essential) and ∼10% (non‐essential) above basal values during the HECP with concomitant protein ingestion.
Figure 1. Arterial plasma phenylalanine and leucine concentration time courses.
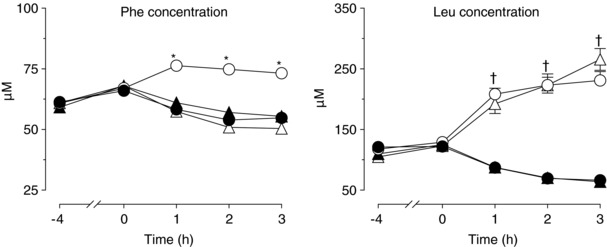
Basal conditions: −4 h to 0 h; hyperinsulinaemic euglycaemic clamp procedure: 0 h to 3 h. Data are the mean ± SEM. Circles represent the protein ingestion (open circles) and respective control (filled circles) studies; triangles represent the leucine ingestion (open triangles) and respective control (filled triangles) studies. Three‐way ANOVA revealed a significant group (whey vs. leucine) × study (control vs. protein or leucine ingestion) × time (basal vs. clamp) interaction for plasma phenylalanine and (ii) a significant study (control vs. protein or leucine ingestion) × time (basal vs. clamp) interaction for plasma leucine concentrations. *Significantly different from the corresponding value in all the other studies (P < 0.05). †Significantly different from the corresponding control value (P < 0.05).
Table 3.
Arterial and venous plasma and muscle free amino acid concentrations
| Protein group | Leucine group | |||
|---|---|---|---|---|
| Control | Protein | Control | Leucine | |
| Total essential (μm) | ||||
| Artery | ||||
| Basal | 807 ± 29 | 839 ± 29 | 780 ± 28 | 780 ± 31 |
| HECP | 526 ± 30* | 1,376 ± 53* , † , ‡ | 561 ± 24* | 666 ± 30* , † |
| Total non‐essential (μm) | ||||
| Artery | ||||
| Basal | 934 ± 45 | 917 ± 45 | 887 ± 27 | 935 ± 26 |
| HECP | 692 ± 42* | 1,033 ± 37* , † , ‡ | 759 ± 27* | 756 ± 47* |
| Phenylalanine (μm) | ||||
| Artery | ||||
| Basal | 66 ± 2 | 67 ± 2 | 68 ± 2 | 68 ± 2 |
| HECP | 54 ± 2* | 75 ± 2* , † , ‡ | 57 ± 2* | 50 ± 2* |
| Vein | ||||
| Basal | 71 ± 3 | 71 ± 2 | 73 ± 3 | 72 ± 2 |
| HECP | 52 ± 3* | 66 ± 2† , ‡ | 56 ± 3* | 47 ± 2* , † |
| Muscle | ||||
| Basal | 85 ± 4 | 91 ± 3 | 77 ± 6 | 81 ± 6 |
| HECP | 67 ± 5§ | 84 ± 12§ | 63 ± 7§ | 56 ± 5§ |
| Leucine (μm) | ||||
| Artery | ||||
| Basal | 122 ± 5 | 129 ± 3 | 125 ± 5 | 123 ± 6 |
| HECP | 62 ± 4* | 230 ± 14* , † | 67 ± 4* | 255 ± 18* , † |
| Vein | ||||
| Basal | 127 ± 5 | 132 ± 4 | 127 ± 6 | 127 ± 6 |
| HECP | 58 ± 4* | 176 ± 10* , † | 63 ± 5* | 194 ± 16* , † |
| Muscle | ||||
| Basal | 150 ± 8 | 172 ± 9 | 151 ± 7 | 150 ± 7 |
| HECP | 88 ± 9* | 184 ± 18† , ‡ | 92 ± 10* | 233 ± 15* , † |
Data are the mean ± SEM during the last 20 min of the basal period and the HECP. Three‐way ANOVA revealed: (i) a significant group (whey vs. leucine) × study (control vs. protein or leucine ingestion) × time (basal vs. clamp) interaction for arterial and venous plasma phenylalanine concentrations, muscle free leucine concentrations, and total essential and non‐essential amino acid concentrations; (ii) a significant study (control vs. protein or leucine ingestion) × time (basal vs. clamp) interaction for arterial and venous plasma leucine concentrations; and (iii) a significant main effect of time for muscle free phenylalanine concentrations.
*Significantly different from corresponding basal value (P < 0.05).
†Significantly different from corresponding control value (P < 0.05).
‡Significantly different from corresponding value in the leucine group (P < 0.05).
§Significant main effect of the HECP (P < 0.001).
Arterial and venous plasma phenylalanine concentrations decreased by ∼25% during the HECP in the control studies and during the HECP with concomitant leucine ingestion, although they were not different or slightly greater than basal values during the HECP with concomitant protein ingestion; muscle phenylalanine concentration decreased by ∼10–30% in all studies. Arterial and venous plasma leucine concentrations decreased by ∼50% during the HECP in the control studies but increased by ∼50% (venous) to 100% (arterial) during both protein and leucine ingestion. Muscle leucine concentration decreased by ∼40% during the HECP in the control studies, did not change during the HECP with concomitant protein ingestion, and increased by ∼50% with concomitant leucine ingestion.
Amino acid sensing and anabolic signalling in muscle (Fig. 2)
Compared to basal conditions, the HECP alone increased both p‐mTORSer2448 and p‐p70S6KThr38 but had no effect on p‐GCN2Thr899 and p‐eIF2αSer51. Both protein and leucine ingestion augmented the HECP‐induced increase in p‐mTORSer2448 and p‐p70S6KThr38, without a difference between groups. Protein, but not leucine, ingestion decreased p‐eIF2αSer51. Neither protein, nor leucine ingestion altered p‐GCN2Thr899.
Figure 2. Muscle p‐mTORSer2448, p‐p70S6KThr389, p‐GCN2Thr899 and p‐eIF2αSer51 contents.
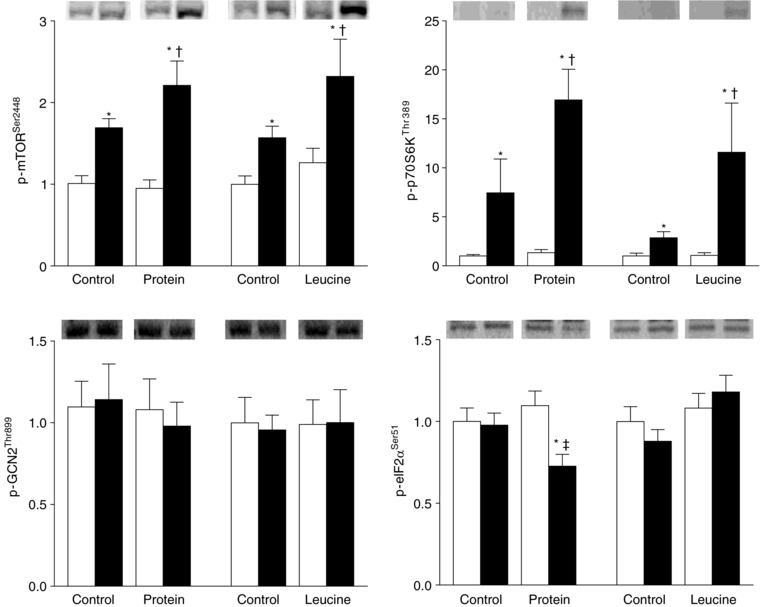
Average contents (arbitrary units) during basal conditions (white bars) and during the hyperinsulinaemic euglycaemic clamp procedure (black bars) expressed as the mean ± SEM. Representative blots are shown on top. Three‐way ANOVA revealed: (i) a significant group (whey vs. leucine) × study (control vs. protein or leucine ingestion) × time (basal vs. clamp) interaction for p‐eIF2αSer51 and (ii) a significant study (control vs. protein or leucine ingestion) × time (basal vs. clamp) interaction for p‐mTORSer2448 and p‐p70S6KThr389. *Significantly different from corresponding basal value (P < 0.05). †Significantly different from the corresponding control value (P < 0.05). ‡Significantly different from corresponding value in the leucine group (P < 0.05).
Leg phenylalanine and leucine kinetics (Fig. 3)
During basal conditions, leg phenylalanine and leucine kinetics were not different among the protein and leucine groups and their respective control studies. Leg phenylalanine uptake, an index of MPS, increased by >50% during the HECP with concomitant protein ingestion but did not change during the HECP alone or with concomitant leucine ingestion. Intramuscular phenylalanine Rd, a measure of MPS, increased by ∼100% during the HECP with concomitant protein ingestion (from 2119 ± 339 nmol min−1 during basal conditions to 4351 ± 621 nmol min−1) but did not change during the HECP alone in the protein and leucine groups or with concomitant leucine ingestion (3127 ± 407 nmol min−1 during basal conditions vs. 3407 ± 342 nmol min−1 during the HECP alone or with leucine ingestion; total mean ± SEM). Leg phenylalanine release, an index of MPB, decreased by ∼20% during the HECP alone and with concomitant protein and leucine ingestion. Intramuscular phenylalanine Ra, a measure of MPB, tended (P = 0.09) to decrease during the HECP in all studies (from 3506 ± 299 nmol min−1 during basal conditions to 3235 ± 255 nmol min−1 during the HECP; toal mean ± SEM of all studies), although the difference did not reach statistical significance, probably because of a lack of statistical power. Leg net phenylalanine balance changed from negative (net protein loss) during basal conditions to equilibrium during the HECP alone and the HECP with concomitant leucine ingestion, and to positive (net gain) during the HECP with concomitant protein ingestion. Leg leucine uptake was not affected by the HECP alone, whereas both protein and leucine ingestion markedly increased leg leucine uptake. Leg leucine release decreased by ∼20–30% during the HECP alone and during the HECP with concomitant protein or leucine ingestion; accordingly, leucine net balance across the leg markedly increased during both protein and leucine ingestion.
Figure 3. Leg phenylalanine and leucine kinetics.
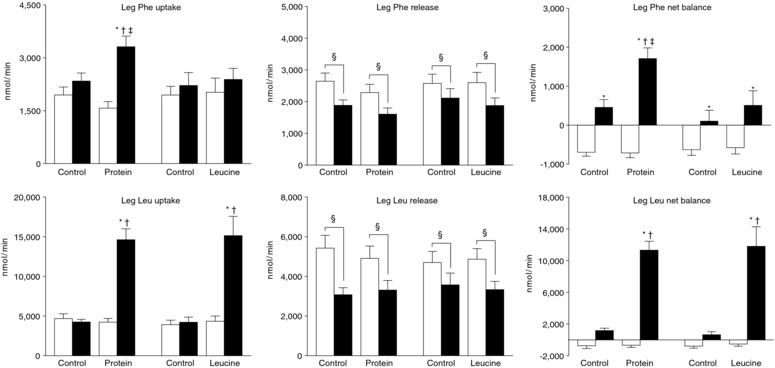
Leg phenylalanine and leucine kinetics assessed using the two‐pool arterio‐venous balance model during basal conditions (white bars) and during the hyperinsulinaemic euglycaemic clamp procedure (black bars). Data are the mean ± SEM. Three‐way ANOVA revealed: (i) a significant group (whey vs. leucine) × study (control vs. protein or leucine ingestion) × time (basal vs. clamp) interaction for leg phenylalanine uptake and net balance; (ii) a significant study (control vs. protein or leucine ingestion) × time (basal vs. clamp) interaction for leg leucine uptake and net balance; and (iii) a significant main effect of time for leg phenylalanine and leucine release. *Significantly different from corresponding basal value (P < 0.05). †Significantly different from corresponding control value (P < 0.05). ǂSignificantly different from corresponding value in the leucine group (P < 0.05). §Significant main effect of the hyperinsulinaemic‐euglycaemic clamp (P < 0.001).
Muscle protein FSR (Fig. 4)
Compared to basal conditions, the muscle protein FSR was not affected by the HECP alone or the HECP with concomitant leucine ingestion but increased by ∼100% with protein ingestion.
Figure 4. Mixed muscle protein FSR.
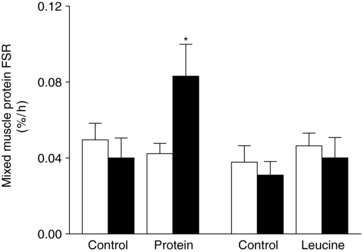
Mixed muscle protein FSR, calculated using the plasma [2H5]phenylalanine enrichment as the precursor pool, during basal conditions (white bars) and during the hyperinsulinaemic euglycaemic clamp procedure (black bars). The results were qualitatively the same when using the muscle free [2H5]phenylalanine enrichment as the precursor pool. Data are the mean ± SEM. Three‐way ANOVA revealed a significant group (whey vs. leucine) × study (control vs. protein or leucine ingestion) × time (basal vs. clamp) interaction. *Significantly different from all other values (P < 0.05).
Discussion
The muscle anabolic effect of protein ingestion is proposed to be mediated by leucine because of its unique ability to activate mTOR‐p70S6K, which is essential for regulating MPS (Atherton et al. 2010; Iwanaka et al. 2010; Goodman et al. 2011; Walker et al. 2011; Moberg et al. 2014; Moro et al. 2016). We compared the effects of ingesting protein or an amount of leucine equal to that in the ingested protein on anabolic signalling and protein turnover in muscle during controlled physiological hyperinsulinaemia, as achieved using the HECP, to eliminate potential confounding as a result of differences in the insulinogenic effect of protein and leucine ingestion. Our data demonstrate that, compared to basal conditions, the HECP alone increased both p‐mTORSer2448 and p‐p70S6KThr38 but had no effect on p‐eIF2αSer51 or the rate of MPS, and also decreased the rate of MPB. Both protein and leucine ingestion during the HECP caused a similar further increase in p‐mTORSer2448 and p‐p70S6KThr389; however, only protein, but not leucine, ingestion decreased p‐eIF2αSer51 (which permits translation initiation) and increased the rate of MPS. The protein ingestion‐induced decrease in p‐eIF2αSer51 occurred in the absence of changes in GCN2 activity. The stimulatory effect of protein, but not leucine, ingestion on MPS was observed independently of the method used to measure muscle protein turnover (i.e. the arteriovenous phenylalanine tracer balance technique in conjunction with either a two‐ or three‐pool modelling approach or by directly measuring the phenylalanine tracer incorporation rate into muscle protein). Neither protein, nor leucine ingestion augmented the insulin‐mediated suppression of MPB or leg phenylalanine and leucine rates of release. These results confirm the potent anti‐proteolytic effect of insulin and muscle anabolic effect of protein ingestion, as well as the dissociation among key anabolic signalling events in muscle and MPS; they also provide novel insights into the regulation of muscle protein turnover by nutrient ingestion.
The results of the present study are consistent with those obtained in a recent study conducted in very old mice (aged 25 months) reporting that oral gavage with a leucine‐enriched protein solution, but not a matched amount of leucine alone, stimulated MPS (Dijk et al. 2018). However, our results are inconsistent with the observation that an i.v. or orally administered ‘flooding’ dose of leucine acutely increased the rate of MPS in healthy young men (Smith et al. 1992; Wilkinson et al. 2013). The differences in the results among studies could be a result of age‐associated anabolic resistance (Cuthbertson et al. 2005; Smith et al. 2012). However, we consider this doubtful because, unlike leucine, protein ingestion did increase the rate of MPS both in our middle‐aged women and the aged rats studied by Dijk et al. (2018). Therefore, the differences in results among studies are probably related to the dose and mode of delivery, comprising a ∼3.5 g ‘flooding’ bolus (Smith et al. 1992; Wilkinson et al. 2013) vs. slow sustained (180 min) delivery of ∼2.4 g leucine in our protein and leucine groups, and/or the controlled hyperinsulinaemia and ensuing hypoaminoacidema during the HECP in our study. Hypoaminoacidemia itself inhibits MPS (Kobayashi et al. 2003) and the results from our study suggest that leucine alone is insufficient to overcome this blockade because the availability of other (essential) amino acids needed for protein synthesis is rate limiting (Wolfe, 2017). This notion is supported by the results from studies conducted in neonatal pigs and adult rats that found i.v. leucine administration transiently increased the rate of MPS and this increase was only sustained when additional amino acids were provided (Anthony et al. 2002; Escobar et al. 2005; Wilson et al. 2010). Indeed, it has been found that leucine infusion causes a decrease in intramyocellular total amino acid concentration (Alvestrand et al. 1990), probably because it promotes amino acid incorporation into protein until their availability becomes rate‐limiting (Wolfe, 2017). Moreover, there is no dose–response relationship between the amount of leucine given and the initial rate of MPS (Crozier et al. 2005). By contrast, protein and essential amino acid ingestion and i.v. mixed amino acid infusion elicit a dose‐dependent increase in MPS (Bohe et al. 2003; Cuthbertson et al. 2005; Moore et al. 2009) and increasing the leucine content of mixed meals or protein beverages dose‐dependently augments the postprandial increase in MPS (Katsanos et al. 2006; Rieu et al. 2006; Wall et al. 2013; Churchward‐Venne et al. 2014; Murphy et al. 2016; Devries et al. 2018). Taken together, these data suggest that leucine contributes to but does not cause the muscle anabolic effect of protein ingestion, which requires the presence of additional amino acids.
The canonical mTOR‐p70S6K signalling pathway is considered to be the key regulator of MPS (Goodman et al. 2011; Walker et al. 2011; Moro et al. 2016). However, the results from our study suggest that mTOR independent signalling pathways are responsible for translation initiation because the HECP alone and the HECP with both concomitant protein and leucine ingestion increased mTORSer2448 and p‐p70S6KThr389, although only protein ingestion decreased p‐eIF2αSer51, which permits translation initiation. The upstream mediators responsible for the differences in eIF2αSer51 phosphorylation during the HECP with and without protein and leucine ingestion are not known. The results from our study suggest that the intracellular amino acid sensor GCN2, which can regulate eIF2α activity (Kimball, 2002; Gordon et al. 2013; Moro et al. 2016), is not involved because GCN2 phosphorylation was not different during protein and leucine ingestion. Indeed, GCN2 phosphorylation was not altered by either the HECP or protein and leucine ingestion, despite marked differences in intramyocellular amino acid concentrations during basal conditions and the HECP with and without protein and leucine ingestion. The most probable explanation for this observation is that intramyocellular amino acid concentrations did not fall below a critical threshold of amino acid ‘deprivation’ that activates GCN2 (Kimball, 2002; Gordon et al. 2013).
The increased leucine uptake by muscle during leucine ingestion was presumably oxidized because leucine ingestion did not increase MPS and the intramyocellular leucine concentration during leucine ingestion was not much greater than that during protein ingestion despite similar leg leucine uptake rates. This finding is consistent with studies that evaluated the fate of leucine during i.v. leucine infusion more directly by measuring the production of α‐ketoisocaproic acid, a leucine oxidation product (Abumrad et al. 1982; Alvestrand et al. 1990; Nair et al. 1992).
Neither protein nor leucine ingestion augmented the insulin‐mediated suppression of MPB, assessed as the intracellular appearance of phenylalanine from proteolysis (three‐pool model) or leg phenylalanine release (two‐pool model). This finding is consistent with the results from previous studies that found the ingestion or infusion of complete or essential amino acid mixtures did not alter MPB (Biolo et al. 1997; Glynn et al. 2010a; Glynn et al. 2013). By contrast, i.v. infusions of a mixture of branched chain amino acids or leucine alone (Louard et al. 1990; Nair et al. 1992; Louard et al. 1995) or ingestion of a leucine‐enriched essential amino acid solution (Glynn et al. 2010b) inhibited MPB. The reasons for the differences in results among those studies are not clear, although they could be a result of differences in the dose of amino acids/protein administered and/or the prevailing insulin concentration. In the present study, MPB was probably already maximally suppressed by insulin during the HECP alone because plasma insulin increased from ∼5‐6 mU L−1 during basal conditions to ∼50–60 mU L−1 during the HECP and MPB is maximally suppressed at plasma insulin concentrations > 30 mU L−1 (Greenhaff et al. 2008).
Summary and conclusion
The results from the present study confirm the potent anti‐proteolytic effect of insulin and the muscle anabolic effect of protein ingestion and provide new insights into the regulation of MPS by demonstrating that leucine and mTOR signalling alone are not responsible for the muscle anabolic effect of protein ingestion during physiological hyperinsulinaemia, probably because they fail to signal to eIF2α to initiate translation and/or because additional amino acids are needed to sustain translation.
Additional information
Competing interests
The authors declare that they have no competing interests.
Author contributions
BM designed the experiments. GIS, RR, DNR, and SK conducted the experiments. SvV, GIS, LP, RR, AO, JY, and BM analyzed the data. SvV, GIS, SK, and BM wrote the manuscript. All authors approved the final version of the manuscript submitted for publication and agree to be accountable for all aspects of the work. All persons designated as authors qualify for authorship, and all those who qualify for authorship are listed.
Funding
This publication was made possible by NIH grants DK94483, DK56341 (Nutrition and Obesity Research Center), DK20579 (Diabetes Research Center), GM103422 (Biomedical Mass Spectrometry Resource) and UL1TR000448 (Clinical Translational Science Award), including KL2 sub‐award TR000450, a Central Society for Clinical and Translational Research Early Career Development Award, and a grant from the Longer Life Foundation.
Acknowledgements
The authors thank Emily Lake, Janet Winkelmann and Kathryn Gratza for their help with subject recruitment, scheduling and testing; Freida Custodio and Jennifer Shew for their technical assistance; the staff of the Clinical Translational Research Unit for their help in performing the studies; and the study subjects for their participation.
Biography
Stephan van Vliet received his PhD from the University of Illinois under the supervision of Dr Nicholas Burd and is currently a first year postdoctoral research fellow at Washington University of School of Medicine under the supervision of Dr Bettina Mittendorfer. His research interest focuses on the effects of nutrition and physical activity on metabolic function and health‐span. Stephan is a recipient of a ESPEN Research fellowship and plans to pursue a career in academic research.

Edited by: Michael Hogan & Troy Hornberger
References
- Abumrad NN, Robinson RP, Gooch BR & Lacy WW (1982). The effect of leucine infusion on substrate flux across the human forearm. J Surg Res 32, 453–463. [DOI] [PubMed] [Google Scholar]
- Alvestrand A, Hagenfeldt L, Merli M, Oureshi A & Eriksson LS (1990). Influence of leucine infusion on intracellular amino acids in humans. Eur J Clin Invest 20, 293–298. [DOI] [PubMed] [Google Scholar]
- Anthony JC, Lang CH, Crozier SJ, Anthony TG, MacLean DA, Kimball SR & Jefferson LS (2002). Contribution of insulin to the translational control of protein synthesis in skeletal muscle by leucine. Am J Physiol Endocrinol Metab 282, E1092–E1101. [DOI] [PubMed] [Google Scholar]
- Atherton PJ, Smith K, Etheridge T, Rankin D & Rennie MJ (2010). Distinct anabolic signalling responses to amino acids in C2C12 skeletal muscle cells. Amino Acids 38, 1533–1539. [DOI] [PubMed] [Google Scholar]
- Biolo G, Tipton KD, Klein S & Wolfe RR (1997). An abundant supply of amino acids enhances the metabolic effect of exercise on muscle protein. Am J Physiol Endocrinol Metab 273, E122–E129. [DOI] [PubMed] [Google Scholar]
- Bohe J, Low A, Wolfe RR & Rennie MJ (2003). Human muscle protein synthesis is modulated by extracellular, not intramuscular amino acid availability: a dose‐response study. J Physiol 552, 315–324. [DOI] [PMC free article] [PubMed] [Google Scholar]
- Churchward‐Venne TA, Breen L, Di Donato DM, Hector AJ, Mitchell CJ, Moore DR, Stellingwerff T, Breuille D, Offord EA, Baker SK & Phillips SM (2014). Leucine supplementation of a low‐protein mixed macronutrient beverage enhances myofibrillar protein synthesis in young men: a double‐blind, randomized trial. Am J Clin Nutr 99, 276–286. [DOI] [PubMed] [Google Scholar]
- Crozier SJ, Kimball SR, Emmert SW, Anthony JC & Jefferson LS (2005). Oral leucine administration stimulates protein synthesis in rat skeletal muscle. J Nutr 135, 376–382. [DOI] [PubMed] [Google Scholar]
- Cuthbertson D, Smith K, Babraj J, Leese G, Waddell T, Atherton P, Wackerhage H, Taylor PM & Rennie MJ (2005). Anabolic signaling deficits underlie amino acid resistance of wasting, aging muscle. FASEB J 19, 422–424. [DOI] [PubMed] [Google Scholar]
- Devries MC, McGlory C, Bolster DR, Kamil A, Rahn M, Harkness L, Baker SK & Phillips SM (2018). Protein leucine content is a determinant of shorter‐ and longer‐term muscle protein synthetic responses at rest and following resistance exercise in healthy older women: a randomized, controlled trial. Am J Clin Nutr 107, 217–226. [DOI] [PubMed] [Google Scholar]
- Dijk FJ, van Dijk M, Walrand S, van Loon LJC, van Norren K & Luiking YC (2018). Differential effects of leucine and leucine‐enriched whey protein on skeletal muscle protein synthesis in aged mice. Clin Nutr ESPEN 24, 127–133. [DOI] [PubMed] [Google Scholar]
- Escobar J, Frank JW, Suryawan A, Nguyen HV, Kimball SR, Jefferson LS & Davis TA (2005). Physiological rise in plasma leucine stimulates muscle protein synthesis in neonatal pigs by enhancing translation initiation factor activation. Am J Physiol Endocrinol Metab 288, E914–E921. [DOI] [PubMed] [Google Scholar]
- Glynn EL, Fry CS, Drummond MJ, Dreyer HC, Dhanani S, Volpi E & Rasmussen BB (2010a). Muscle protein breakdown has a minor role in the protein anabolic response to essential amino acid and carbohydrate intake following resistance exercise. Am J Physiol Regul Integr Comp Physiol 299, R533–R540. [DOI] [PMC free article] [PubMed] [Google Scholar]
- Glynn EL, Fry CS, Drummond MJ, Timmerman KL, Dhanani S, Volpi E & Rasmussen BB (2010b). Excess leucine intake enhances muscle anabolic signaling but not net protein anabolism in young men and women. J Nutr 140, 1970–1976. [DOI] [PMC free article] [PubMed] [Google Scholar]
- Glynn EL, Fry CS, Timmerman KL, Drummond MJ, Volpi E & Rasmussen BB (2013). Addition of carbohydrate or alanine to an essential amino acid mixture does not enhance human skeletal muscle protein anabolism. J Nutr 143, 307–314. [DOI] [PMC free article] [PubMed] [Google Scholar]
- Goodman CA, Mayhew DL & Hornberger TA (2011). Recent progress toward understanding the molecular mechanisms that regulate skeletal muscle mass. Cell Signal 23, 1896–1906. [DOI] [PMC free article] [PubMed] [Google Scholar]
- Gordon BS, Kelleher AR & Kimball SR (2013). Regulation of muscle protein synthesis and the effects of catabolic states. Int J Biochem Cell Biol 45, 2147–2157. [DOI] [PMC free article] [PubMed] [Google Scholar]
- Greenhaff PL, Karagounis LG, Peirce N, Simpson EJ, Hazell M, Layfield R, Wackerhage H, Smith K, Atherton P, Selby A & Rennie MJ (2008). Disassociation between the effects of amino acids and insulin on signaling, ubiquitin ligases, and protein turnover in human muscle. Am J Physiol Endocrinol Metab 295, E595–E604. [DOI] [PMC free article] [PubMed] [Google Scholar]
- Iwanaka N, Egawa T, Satoubu N, Karaike K, Ma X, Masuda S & Hayashi T (2010). Leucine modulates contraction‐ and insulin‐stimulated glucose transport and upstream signaling events in rat skeletal muscle. J Appl Physiol 108, 274–282. [DOI] [PubMed] [Google Scholar]
- Katsanos CS, Kobayashi H, Sheffield‐Moore M, Aarsland A & Wolfe RR (2006). A high proportion of leucine is required for optimal stimulation of the rate of muscle protein synthesis by essential amino acids in the elderly. Am J Physiol Endocrinol Metab 291, E381–E387. [DOI] [PubMed] [Google Scholar]
- Kimball SR (2002). Regulation of global and specific mRNA translation by amino acids. J Nutr 132, 883–886. [DOI] [PubMed] [Google Scholar]
- Kobayashi H, Borsheim E, Anthony TG, Traber DL, Badalamenti J, Kimball SR, Jefferson LS & Wolfe RR (2003). Reduced amino acid availability inhibits muscle protein synthesis and decreases activity of initiation factor eIF2B. Am J Physiol Endocrinol Metab 284, E488–E498. [DOI] [PubMed] [Google Scholar]
- Louard RJ, Barrett EJ & Gelfand RA (1990). Effect of infused branched‐chain amino acids on muscle and whole‐body amino acid metabolism in man. Clin Sci 79, 457–466. [DOI] [PubMed] [Google Scholar]
- Louard RJ, Barrett EJ & Gelfand RA (1995). Overnight branched‐chain amino acid infusion causes sustained suppression of muscle proteolysis. Metabolism 44, 424–429. [DOI] [PubMed] [Google Scholar]
- Moberg M, Apro W, Ohlsson I, Ponten M, Villanueva A, Ekblom B & Blomstrand E (2014). Absence of leucine in an essential amino acid supplement reduces activation of mTORC1 signalling following resistance exercise in young females. Appl Physiol Nutr Metab 39, 183–194. [DOI] [PubMed] [Google Scholar]
- Moore DR, Robinson MJ, Fry JL, Tang JE, Glover EI, Wilkinson SB, Prior T, Tarnopolsky MA & Phillips SM (2009). Ingested protein dose response of muscle and albumin protein synthesis after resistance exercise in young men. Am J Clin Nutr 89, 161–168. [DOI] [PubMed] [Google Scholar]
- Moro T, Ebert SM, Adams CM & Rasmussen BB (2016). Amino acid sensing in skeletal muscle. Trends Endocrinol Metab 27, 796–806. [DOI] [PMC free article] [PubMed] [Google Scholar]
- Murphy CH, Saddler NI, Devries MC, McGlory C, Baker SK & Phillips SM (2016). Leucine supplementation enhances integrative myofibrillar protein synthesis in free‐living older men consuming lower‐ and higher‐protein diets: a parallel‐group crossover study. Am J Clin Nutr 104, 1594–1606. [DOI] [PubMed] [Google Scholar]
- Nair KS, Schwartz RG & Welle S (1992). Leucine as a regulator of whole body and skeletal muscle protein metabolism in humans. Am J Physiol Endocrinol Metab 263, E928–E934. [DOI] [PubMed] [Google Scholar]
- Radegran G & Saltin B (1999). Nitric oxide in the regulation of vasomotor tone in human skeletal muscle. Am J Physiol Heart Circ Physiol 276, H1951–H1960. [DOI] [PubMed] [Google Scholar]
- Rennie MJ, Wackerhage H, Spangenburg EE & Booth FW (2004). Control of the size of the human muscle mass. Annu Rev Physiol 66, 799–828. [DOI] [PubMed] [Google Scholar]
- Rieu I, Balage M, Sornet C, Giraudet C, Pujos E, Grizard J, Mosoni L & Dardevet D (2006). Leucine supplementation improves muscle protein synthesis in elderly men independently of hyperaminoacidaemia. J Physiol 575, 305–315. [DOI] [PMC free article] [PubMed] [Google Scholar]
- Smith GI, Julliand S, Reeds DN, Sinacore DR, Klein S & Mittendorfer B (2015a). Fish oil derived n‐3 polyunsaturated fatty acid therapy increases muscle mass and strength in older adults: a randomized controlled trial. Am J Clin Nutr 102, 115–122. [DOI] [PMC free article] [PubMed] [Google Scholar]
- Smith GI, Patterson BW, Klein SJ & Mittendorfer B (2015b). Effect of hyperinsulinemia‐hyperaminoacidemia on leg muscle protein synthesis and breakdown: reassessment of the 2‐pool arterio‐venous balance model. J Physiol 593, 4245–4257. [DOI] [PMC free article] [PubMed] [Google Scholar]
- Smith GI, Reeds DN, Hall AM, Chambers KT, Finck BN & Mittendorfer B (2012). Sexually dimorphic effect of aging on skeletal muscle protein synthesis. Biol Sex Differ 3, 11. [DOI] [PMC free article] [PubMed] [Google Scholar]
- Smith GI, Villareal DT & Mittendorfer B (2007). Measurement of human mixed muscle protein fractional synthesis rate depends on the choice of amino acid tracer. Am J Physiol Endocrinol Metab 293, E666–E671. [DOI] [PubMed] [Google Scholar]
- Smith GI, Yoshino J, Stromsdorfer KL, Klein SJ, Magkos F, Reeds DN, Klein S & Mittendorfer B (2015c). Protein ingestion induces muscle insulin resistance independent of leucine‐mediated mTOR activation. Diabetes 64, 1555–1563. [DOI] [PMC free article] [PubMed] [Google Scholar]
- Smith K, Barua JM, Watt PW, Scrimgeour CM & Rennie MJ (1992). Flooding with L‐[1‐13C]leucine stimulates human muscle protein incorporation of continuously infused L‐[1‐13C]valine. Am J Physiol Endocrinol Metab 262, E372–E376. [DOI] [PubMed] [Google Scholar]
- Walker DK, Dickinson JM, Timmerman KL, Drummond MJ, Reidy PT, Fry CS, Gundermann DM & Rasmussen BB (2011). Exercise, amino acids, and aging in the control of human muscle protein synthesis. Med Sci Sports Exerc 43, 2249–2258. [DOI] [PMC free article] [PubMed] [Google Scholar]
- Wall BT, Hamer HM, de Lange A, Kiskini A, Groen BB, Senden JM, Gijsen AP, Verdijk LB & van Loon LJ (2013). Leucine co‐ingestion improves post‐prandial muscle protein accretion in elderly men. Clin Nutr 32, 412–419. [DOI] [PubMed] [Google Scholar]
- Wilkinson DJ, Hossain T, Hill DS, Phillips BE, Crossland H, Williams J, Loughna P, Churchward‐Venne TA, Breen L, Phillips SM, Etheridge T, Rathmacher JA, Smith K, Szewczyk NJ & Atherton PJ (2013). Effects of leucine and its metabolite beta‐hydroxy‐beta‐methylbutyrate on human skeletal muscle protein metabolism. J Physiol 591, 2911–2923. [DOI] [PMC free article] [PubMed] [Google Scholar]
- Wilson FA, Suryawan A, Gazzaneo MC, Orellana RA, Nguyen HV & Davis TA (2010). Stimulation of muscle protein synthesis by prolonged parenteral infusion of leucine is dependent on amino acid availability in neonatal pigs. J Nutr 140, 264–270. [DOI] [PMC free article] [PubMed] [Google Scholar]
- Wolfe RR (2017). Branched‐chain amino acids and muscle protein synthesis in humans: myth or reality? J Int Soc Sports Nutr 14, 30. [DOI] [PMC free article] [PubMed] [Google Scholar]
- Yoshino J, Conte C, Fontana L, Mittendorfer B, Imai S, Schechtman KB, Gu C, Kunz I, Rossi Fanelli F, Patterson BW & Klein S (2012). Resveratrol supplementation does not improve metabolic function in nonobese women with normal glucose tolerance. Cell Metab 16, 658–664. [DOI] [PMC free article] [PubMed] [Google Scholar]