

Abstract
Constitutive membrane fusion within eukaryotic cells is thought to be controlled at its initial steps, membrane tethering and SNARE complex assembly, and to rapidly proceed from there to full fusion. Although theory predicts that fusion pore expansion faces a major energy barrier and might hence be a rate‐limiting and regulated step, corresponding states with non‐expanding pores are difficult to assay and have remained elusive. Here, we show that vacuoles in living yeast are connected by a metastable, non‐expanding, nanoscopic fusion pore. This is their default state, from which full fusion is regulated. Molecular dynamics simulations suggest that SNAREs and the SM protein‐containing HOPS complex stabilize this pore against re‐closure. Expansion of the nanoscopic pore to full fusion can thus be triggered by osmotic pressure gradients, providing a simple mechanism to rapidly adapt organelle volume to increases in its content. Metastable, nanoscopic fusion pores are then not only a transient intermediate but can be a long‐lived, physiologically relevant and regulated state of SNARE‐dependent membrane fusion.
Keywords: endosomes, lysosomes, membrane fusion, SNAREs, vacuoles
Subject Categories: Membrane & Intracellular Transport
Introduction
Membrane fusion reactions in eukaryotic cells traverse a series of intermediate steps. Docking is followed by outer membrane leaflet fusion, establishing a hemifusion stalk, which can expand into a larger hemifused zone, the hemifusion diaphragm. Fusion of the inner leaflets leads to the formation and subsequent expansion of the fusion pore, which allows content mixing. Trans‐SNARE complexes transmit force to the membranes, which drives fusion reactions through these steps (Gao et al, 2012; Hernandez et al, 2012, 2014; Shi et al, 2012). Theory indicates that the expansion of an existing fusion pore faces a major energy barrier, which may be overcome through membrane tension (Chizmadzhev et al, 2000; Kozlov et al, 2010; Long et al, 2012; Kozlov & Chernomordik, 2015; Ryham et al, 2016). This suggests that expansion of fusion pores might be rate‐limiting, reversible, and give rise to a potentially long‐lived intermediate. In line with this, in vitro data show that the number of trans‐SNARE complexes around a fusion pore and SNARE‐associated proteins influences the diameter and dynamics of that pore (Shi et al, 2012; Lai et al, 2013; Bao et al, 2018). Also in vivo, exocytic fusion pores are highly dynamic and their properties depend on the expression level of exocytic SNAREs and membrane tension in vivo (Bao et al, 2018; Shin et al, 2018). Despite this dynamics, exocytic fusion pores usually remain relatively short‐lived (sub‐second range) (Bao et al, 2018; Shin et al, 2018). Pore flickering for seconds could be observed during exocytosis of very compact or colloidal content of secretory vesicles, which can counteract the completion of fusion. In this special case, pore opening requires actin‐dependent force generation for active extrusion (Tse et al, 1993; Zimmerberg et al, 1994; Chen et al, 2008; Tran et al, 2015; Rousso et al, 2016; Zhao et al, 2016), suggesting that pore opening might be hindered through interactions between the membrane and its contents.
Stable, long‐lived intermediates arrested in hemifusion or at the state of non‐expanding fusion pores have remained elusive in living cells. Particularly for all non‐exocytic fusion events, in vivo fusion intermediates are hence usually presumed to be short‐lived. Visualization of such intermediates in living cells is challenging, but it might be favored in a situation in which pore expansion is governed by limited membrane tension (Kozlov & Chernomordik, 2015). We used yeast vacuoles to probe for such fusion intermediates in vivo. The structure of the vacuolar compartment is dynamically controlled by two antagonistic processes. On the one hand, membrane fission reduces the total volume of the vacuolar compartment by fragmenting it into multiple smaller vacuoles. On the other hand, fusion can re‐assemble these small vacuoles into a single bigger structure. The equilibrium between both processes determines vacuole structure (Weisman, 2003; Peters et al, 2004; Baars et al, 2007; Brett & Merz, 2008; Michaillat et al, 2012; Alpadi et al, 2013). Fusion is favored when vacuolar content increases, either by accumulation of macromolecules, e.g., during autophagy, or through osmotic water influx in hypotonic media. Fragmentation is triggered by lack of luminal content or hypertonic media (Bonangelino et al, 2002; Zieger & Mayer, 2012; Desfougères et al, 2016a).
Homotypic fusion of yeast vacuoles in vitro could be dissected into a series of well‐characterized steps: Priming by Sec18/NSF promotes SNARE activation through dissociation of cis‐SNARE complexes (Mayer et al, 1996; Ungermann et al, 1998). Tethering, governed by coordinated action of the Rab‐GTPase Ypt7 and the HOPS complex, permits the formation of trans‐SNARE complexes (Mayer & Wickner, 1997; Price et al, 2000; Zick & Wickner, 2014; Orr et al, 2015; Lürick et al, 2017). These, together with V 0 proteolipids, induce lipid mixing (Peters et al, 2001; Reese et al, 2005; Strasser et al, 2011; Desfougères et al, 2016b; Mattie et al, 2017). Content mixing requires several trans‐SNARE complexes (D'Agostino et al, 2016) and their anchoring in the membrane through peptidic transmembrane domains in helical continuity with the SNARE domain (Pieren et al, 2015). Content mixing also requires the association of trans‐SNARE complexes with HOPS and its SM protein subunit Vps33 in order to deform the hemifusion zone sufficiently to facilitate fusion pore formation (Pieren et al, 2010; Zick & Wickner, 2014; D'Agostino et al, 2017). The transition from hemifusion to content mixing is rate‐limiting for vacuole fusion in vitro (Reese & Mayer, 2005), but it could not yet be resolved whether the limiting step is fusion pore formation or pore expansion. It has also remained unclear whether the transition from hemifusion to pore formation or expansion is kinetically relevant in vivo and whether the respective intermediates might be of physiological importance. Since, in living cells, yeast vacuoles always appear as a cluster of tethered vesicles, we explored whether these organelles are only docked, or whether they are connected through hemifusion, non‐expanding or expanded fusion pores.
Results
When multiple vacuolar vesicles are present, as is the case in many wild‐type strains under conditions of logarithmic growth on standard rich media, these vacuoles are always tethered to each other. Given that vacuoles are tethered over a large surface in living yeast cells, we tested whether expanded fusion pores might be detectable. We stained the vacuoles in living cells with FM4‐64, a vital dye that inserts into the outer leaflet of the plasma membrane. FM4‐64 enters the cells by endocytosis and finally accumulates in the vacuolar membrane (Vida & Emr, 1995). Stained cells were analyzed by serial confocal sectioning with a spinning disk microscope and 3D reconstruction. Only ~1% of the cells showed a pore connecting two adjacent vacuoles (Fig 1A), and we never observed more than a single pore in a contact zone.
Figure 1. In vivo visualization of an expanding fusion pore.
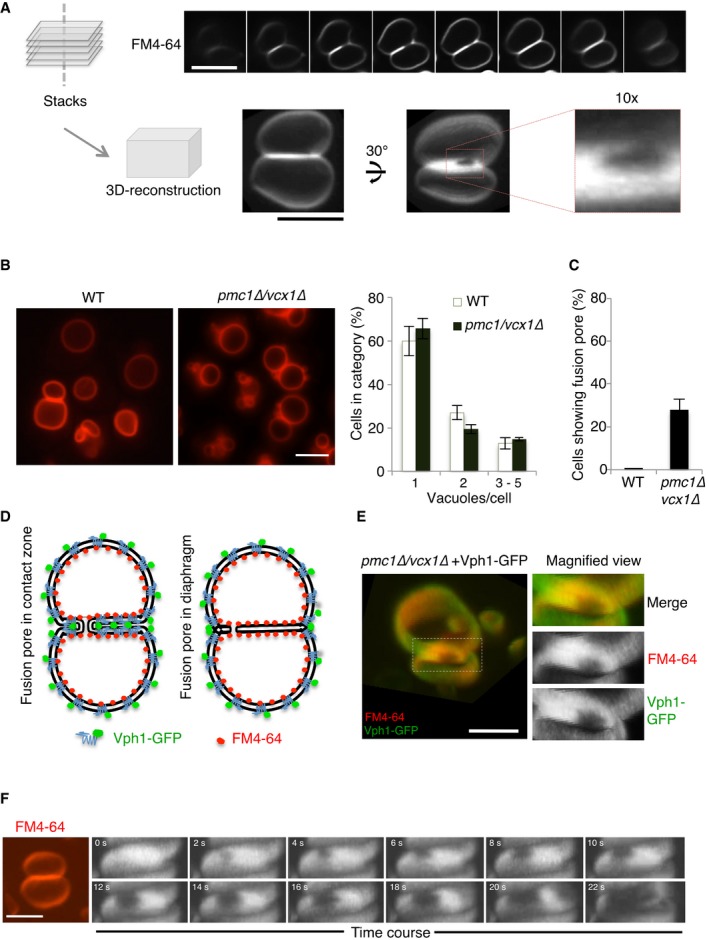
- z‐stacks were acquired from FM4‐64‐labeled vacuoles in wild‐type cells (BJ3505), using a spinning disk microscope (step size 200 nm). 3D reconstructions from these stacks reveal a peripherally located fusion pore. Scale bar: 2 μm.
- Wild‐type (BJ3505) and isogenic pmc1Δ/vcx1Δ mutant cells were labeled with FM4‐64. The number of vacuoles per cell was determined in three independent experiments evaluating 200 cells each. Scale bar: 2 μm.
- Frequency of visible fusion pores. Cells were grown as in (B). The percentage of cells showing visible fusion pore was determined from z‐stacks. Means and SD are shown for 100 stained vacuoles from three independent experiments.
- Schematic view of Vph1‐GFP and FM4‐64 distribution over the vacuolar membranes in the presence of a nanoscopic fusion pore or of an extended hemifusion diaphragm.
- Distribution of Vph1‐GFP and FM4‐64 in vacuole–vacuole contact sites. Vph1‐GFP‐expressing cells, labeled with FM4‐64, were analyzed under a spinning disk confocal microscope equipped with two cameras for the simultaneous acquisition of GFP and FM4‐64 fluorescence signals. Separate channels are shown on the right. The entire contact surface, but not the pore, is accessible to both probes. Scale bar: 2 μm.
- Expansion of a vacuolar fusion pore in real time. pmc1Δ/vcx1Δ cells were labeled with FM4‐64 and immobilized in a 50‐μl flow chamber (Ibidi). The osmotic value of the medium was changed by perfusion with water, using a pump with a flow of 30 μl/s. A frame was acquired every 2 s for a total period of the 30 s, using the laser at minimal intensity.
Source data are available online for this figure.
Osmotic pressure controls vacuolar fusion pores
Membrane tension and osmotic pressure determine the kinetics and the degree of fusion pore expansion (Cohen et al, 1980; Chizmadzhev et al, 1999, 2000; Bretou et al, 2014; Tran et al, 2015; Rousso et al, 2016). Based on this notion, we searched for mutants that show pores in the contact zone with higher frequency. Cells lacking the two main vacuolar Ca2+ importers, Pmc1 and Vcx1, had this property. pmc1Δ vcx1Δ mutants show increased cytosolic Ca2+ concentration, which activates calcineurin, an important controller of osmo‐homeostasis that induces the expression of pumps extruding monovalent cations from the cells (Cyert & Philpott, 2013). This can result in an osmotic imbalance between cytosol and vacuoles. Only 35% of pmc1Δ vcx1Δ cells contain two or more vacuoles (Fig 1B) and could be analyzed for pores in the contact zones. Strikingly, 85% of these contact zones showed pores (Fig 1B and C), which were identified by simultaneous exclusion of FM4‐64 and of a GFP‐tagged transmembrane protein, the V‐ATPase a subunit Vph1 (Fig 1D and E). We always found only a single pore, and it was adjacent to the vertex of the contact zone, which accumulates many fusion‐relevant proteins and lipids (Wang et al, 2002, 2003; Fratti et al, 2004; Karunakaran et al, 2012).
Simulation approaches suggested that fusion pores can open through direct disruption of a fusion stalk, or at the rim of a hemifusion diaphragm (Risselada et al, 2014). Since in vitro studies had provided evidence for extended hemifusion diaphragms between giant unilamellar vesicles (Nikolaus et al, 2010) as well as between tethered vacuoles (Mattie et al, 2017), which were large enough to be detectable by light microscopy, we tested the existence of these structures in living yeast cells. Transmembrane proteins and proteins bound to outer leaflet lipids should be excluded from a hemifusion diaphragm, whereas the lipidic probe FM4‐64 might label the diaphragm (Fig 1D). We found Vph1‐GFP and FM4‐64 to be distributed over the entire contact zone between two vacuoles (Fig 1E). Similar observations were made with all the GFP‐tagged transmembrane proteins (not shown) as well as with proteins binding the outer vacuolar leaflet that we used below (see, e.g., PX‐GFP in Movie EV1). The only non‐labeled areas that we found (mostly in pmc1Δ vcx1Δ mutants) were also devoid of FM4‐64 and we hence consider those as expanded fusion pores. This suggests that, in living cells, vacuoles do not form extended hemifusion diaphragms and favors the notion that vacuolar fusion pores might originate directly from a stalk, or from small hemifusion diaphragms that would escape detection by the technique that we applied.
When the cells were challenged by hypotonic media, their vacuoles fused within 30 s. Time‐lapse microscopy under minimal illumination showed that fusion occurred through gradual expansion of the single existing pore over the entire contact surface (Fig 1F). Formation of lumenal vesicles or the excision of membrane disks, which had been reported previously (Wang et al, 2002), was not observed. We noticed, however, that this phenomenon was triggered upon continuous exposure of the cells to intense illumination from the microscope for 30 s, or upon heat‐stressing the cells at 40°C. Both treatments strongly increased the frequency of lumenal, FM4‐64‐stained membranes (Fig EV1; McNally et al, 2017), which were mobile. When fusion was triggered by hypotonic media for 30 s at the normal growth temperature of 30°C, and only a single snapshot was taken, lumenal fragments were not observed (Fig EV1). The excision of membrane disks or lumenal vesicles thus appears to be thermally nucleated. It may require a transition to more inverted membrane phases (Risselada et al, 2014).
Figure EV1. Effect of osmotic and temperature shocks on vacuole structure in vivo .
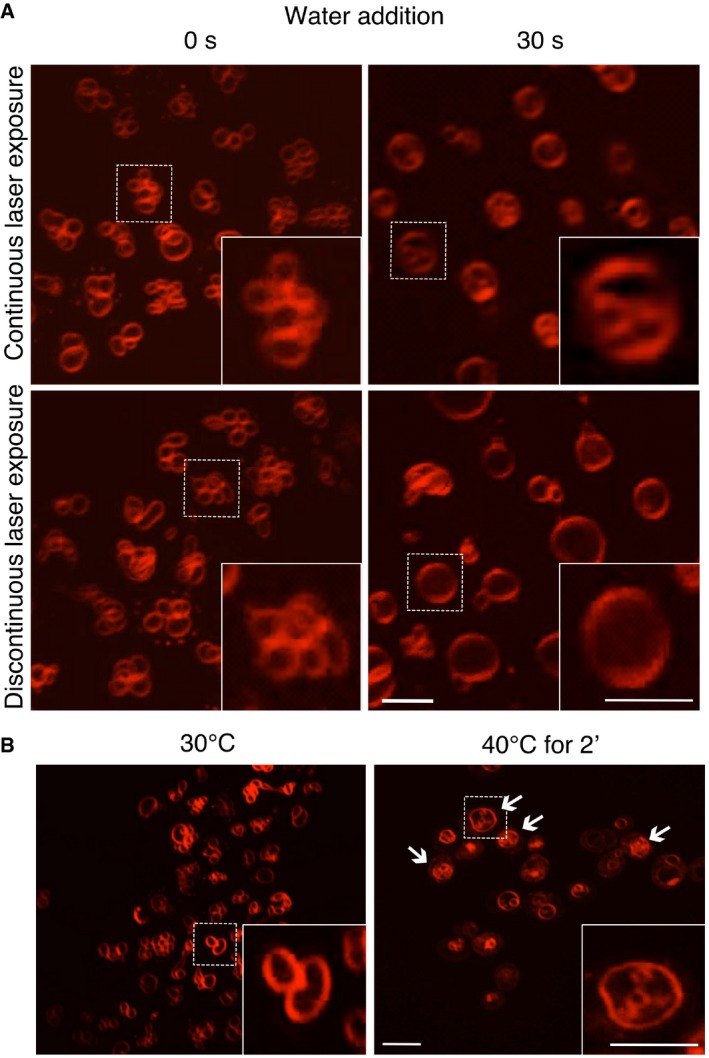
- Effect of excessive excitation light. Vacuole fusion was stimulated in BY4741 cells, labeled with FM4‐64, by adding water. Pictures were acquired either under continuous laser excitation for 30 s, or with only a single laser flash before and 30 s after water addition.
- Effect of elevated temperature. BY4741 cells were labeled with FM4‐64, and vacuole morphology was analyzed by spinning disk confocal microscopy before and after exposure to 40°C for 2 min. Arrows indicate vacuoles with lumenal vesicles.
Tethered yeast vacuoles in living cells exchange lipid but not content
We explored the possibility that also the tethered vacuoles of wild‐type cells, which only very rarely show microscopically visible pores in their contact sites, might be much more advanced in the fusion pathway than we commonly presume and exist in a partially fused state, such as a hemifusion intermediate or a nanoscopic, non‐expanding fusion pore. We labeled vacuoles with FM4‐64, which served as a lipidic tracer to evaluate continuity of vacuolar membranes by fluorescence recovery after photobleaching (FRAP).
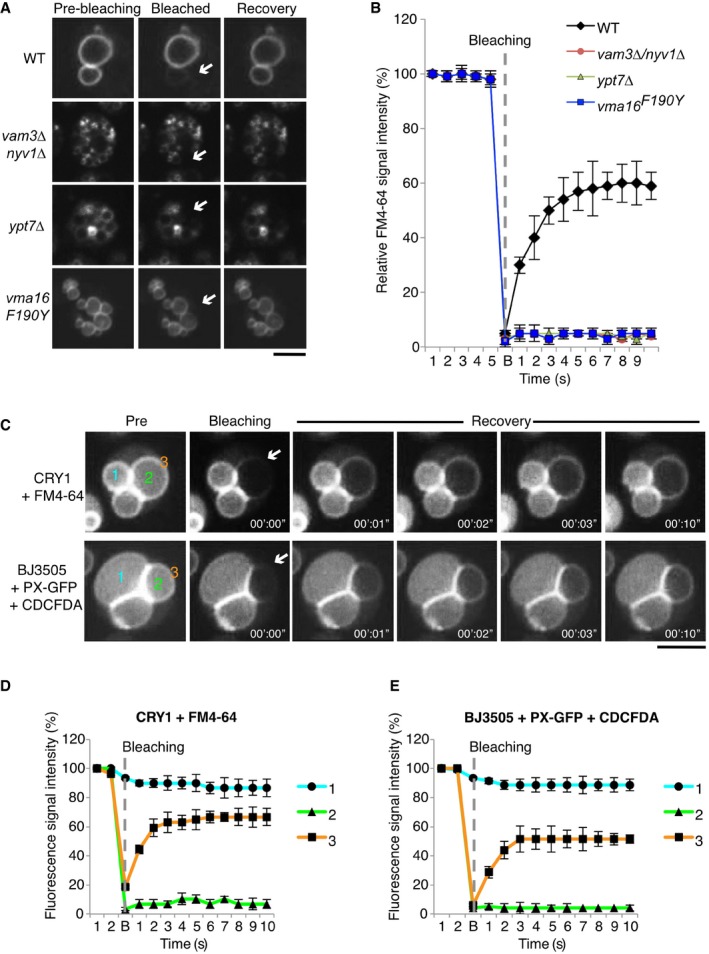
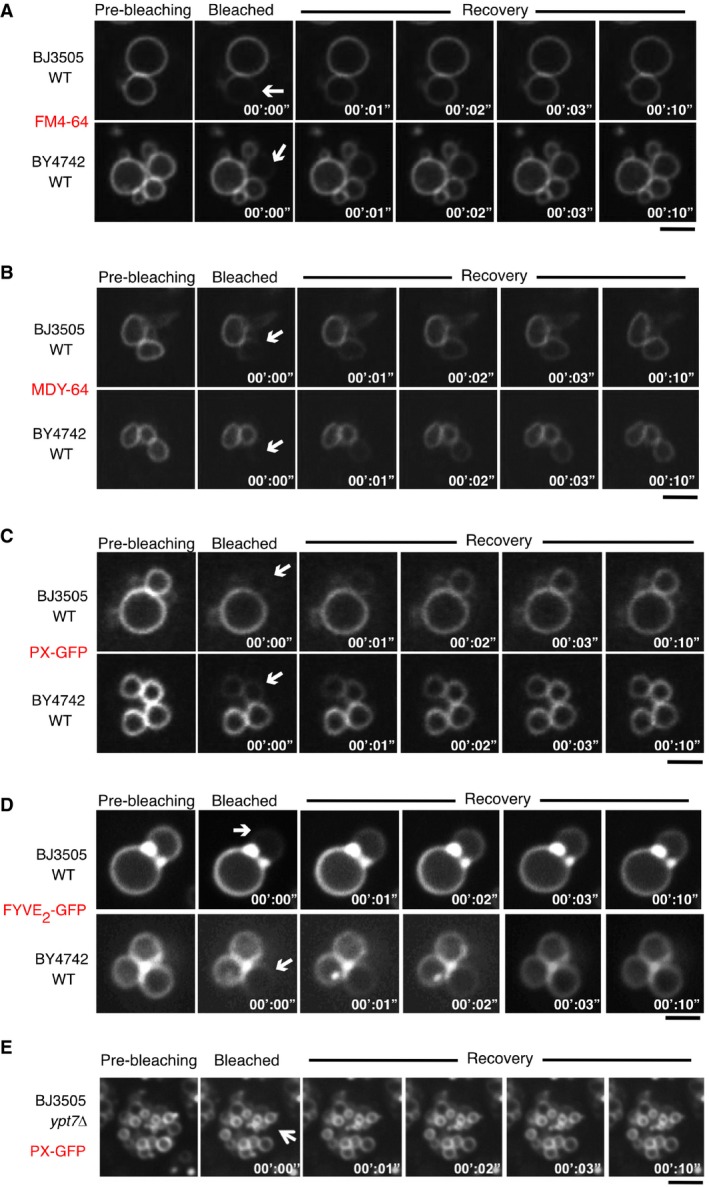
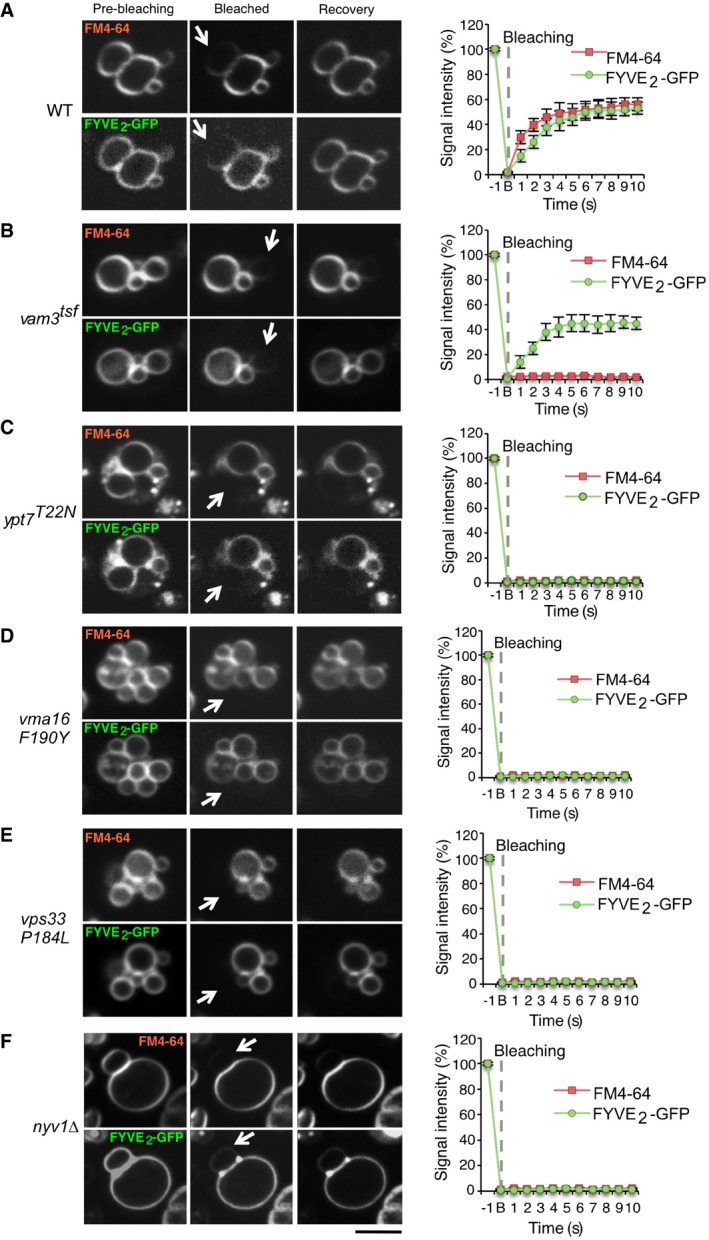
We chose cells showing a vacuole that was in contact with neighboring vacuoles, yet in a sufficiently peripheral position in the cluster to allow selective photobleaching of the FM4‐64 in its membranes by a laser pulse. The FM4‐64 signal could be completely bleached but recovered within a few seconds after the laser pulse (Fig 2A and B). Cells deleted for the vacuolar SNAREs Nyv1 or Vam3, or for the vacuolar Rab‐GTPase Ypt7, which are deficient for lipid and content mixing in vitro and carry numerous small vacuoles in vivo, did not show any recovery. We also analyzed a strain carrying a single amino acid substitution in a subunit of the proteolipid cylinder of the V‐ATPase (vma16 F190Y). In vitro, vma16 F190Y vacuoles dock and form trans‐SNARE complexes, but they are impaired in lipid mixing (Strasser et al, 2011). Consistent with the in vitro data, vacuoles in vma16 F190Y cells did not show fluorescence recovery after photobleaching in vivo (Fig 2A). Transfer of FM4‐64 between tethered wild‐type vacuoles did not depend on the chemical nature of this compound, because similar transfer was observed with other vacuolar lipid probes, such as the lipophilic dye MDY‐64 or a GFP bound to the cytoplasmic leaflet of vacuoles through the PI3P‐binding PX or FYVE domains (Burd & Emr, 1998; Gillooly et al, 2000; Cheever et al, 2001; Fig EV2). Also, the transfer of these lipid probes between vacuoles was suppressed in fusion‐deficient mutants (Fig EV2E for PX‐GFP and see below for FYVE2‐GFP). Together, these observations suggest that transfer of lipid probes between vacuoles does not occur through the cytosol and requires the vacuolar fusion machinery.
Figure 2. In vivo assay for lipid and content mixing of vacuolar membranes.
-
AVacuolar membranes of wild‐type (BY4741), nyv1Δ vam3Δ, ypt7Δ, or vma16 F190Y cells were labeled with the vital dye FM4‐64. A vacuole that was in a sufficiently peripheral location to be selectively photobleached was exposed to a laser pulse (white arrows indicate the bleaching area). Recovery of fluorescence in this area was assayed 10 s later by spinning disk confocal microscopy. Scale bar: 2 μm.
-
BKinetics of FM4‐64 recovery in (A). Means and SD are shown for 20 vacuole clusters from three independent experiments.
-
CIn vivo lipid and content mixing. Vacuoles in living yeast were labeled with the indicated lumenal (CDCFDA) and membrane (FM4‐64 or PX‐GFP) probes. Note that CRY1 cells lack the ADE2 gene and hence naturally accumulate 5‐amino‐1‐(5‐phospho‐D‐ribosyl)imidazole as fluorescent fluid phase marker in the vacuolar lumen. FRAP experiments were performed as in (A) (arrows indicate the bleaching area). (i) Non‐bleached lumenal area. (ii) Bleached lumenal area. (iii) Bleached membrane area. Scale bar: 2 μm.
-
D, EKinetics of fluorescence recovery after photobleaching of the probes in (C). Numbers denote the areas shown in (C): (i) Non‐bleached lumenal area. (ii) Bleached lumenal area. (iii) Bleached membrane area. Means and SD are shown for 20 vacuole clusters from three independent experiments.
Source data are available online for this figure.
Figure EV2. FRAP‐based assay of in vivo lipid mixing with different fluorescent probes.
-
A–EWild‐type cells from two different backgrounds (BJ3505 and BY4741) were labeled with (A) FM4‐64 or (B) MDY‐64, or transformed with expression plasmids for (C) PX‐GFP or (D) FYVE2‐GFP in order to decorate the outer leaflet of the vacuolar membranes. The cells were subjected to FRAP assays as described in Fig 2. White arrows indicate the area of bleaching. (E) Same experiment as in (C), but using BJ ypt7Δ to illustrate that the transfer of PX‐GFP is impaired in fusion‐deficient mutants. Scale bars: 2 μm.
Next, we measured the exchange of two soluble lumenal markers in combination with lipid probes. We used FM4‐64 in combination with an ade2 mutant strain, which lacks the activity of phosphoribosylaminoimidazole carboxylase, an enzyme necessary for de novo synthesis of purines. ade2 mutant cells (in this case in the CRY1 strain) grow well on rich media, but they accumulate brightly fluorescent adenine precursors (5‐amino‐1‐(5‐phospho‐D‐ribosyl)imidazole), which concentrate in the lumen of their vacuoles and provide a convenient vacuolar fluid phase marker (Smirnov et al, 1967; Weisman et al, 1987). Alternatively, we used cells (BJ3505) expressing the lipid probe PX‐GFP, which binds to phosphatidylinositol‐3‐phosphate (PI3P) in the vacuolar membrane (Cheever et al, 2001), and stained them with CDCFDA (5(6)‐carboxy‐2′,7′‐dichlorofluorescein diacetate), which is hydrolyzed by esterases in the vacuolar lumen and hence accumulates there. Both approaches lead to vacuoles with stained membranes and diffuse labeling of the aqueous lumen (Fig 2C). The dye combinations were chosen such that the lumenal and membrane probes could be simultaneously bleached by the same laser. After a laser pulse had bleached both the lumenal and membrane markers, FM4‐64 and PX‐GFP signals in the membrane recovered within 3 s, whereas the lumenal probes showed barely any recovery (Fig 2C–E). The small signal recovery that is visible in the lumenal area most likely represents out‐of‐focus fluorescence stemming from the recovering membrane probe that fills the membrane above and below the imaging plane (this background is visible, for example, in Fig 2A, particularly for smaller vacuoles). Recovery of the lumenal signal is also not limited by restricted diffusion because, when we bleached only a smaller area within a single, very large vacuole, recovery is instantaneous, i.e., too fast to be imaged by our microscopy setup, which has a switch‐time between bleaching and acquisition of around 50 ms. Thus, vacuoles in living yeast cells efficiently exchange lipid markers but not content markers.
Tethered vacuoles are connected by non‐expanding fusion pores
This behavior could indicate either a state of hemifusion, in which the outer leaflets mix but the inner leaflets remain separated, or the presence of a nanoscopic fusion pore, through which both leaflets are connected but which is small enough to restrain the passage of fluorescent lumenal tracers. We tried to distinguish between these possibilities by establishing lipid tracers that allow to selectively probe the outer or inner membrane leaflet. FM4‐64 inserts into the outer leaflet of the plasma membrane and reaches vacuoles by endocytosis (Vida & Emr, 1995), which suggests that it might decorate the inner leaflets of vacuolar membranes. We tested this by placing GFP domains either at the inner or outer surface of the vacuolar membrane. This allows to assay fluorescence energy transfer (FRET) from GFP to FM4‐64 because FM4‐64 has its excitation maximum exactly at the emission wavelength of GFP (Fig 3A). Since FRET diminishes with the inverse 6th power of the distance between donor and acceptor, much more efficient quenching of GFP is expected if the GFP domain resides on the same leaflet as FM4‐64. In order to place GFP at the surface of either leaflet, we fused it to the luminal C‐terminus of the vacuolar transmembrane protein Nyv1 or to C‐terminus of the vacuolar V‐ATPase subunit Vph1, which is placed at the cytosolic face of the membrane (Mazhab‐Jafari et al, 2016; Fig 3B). We compared the fluorescence intensity of these two markers before and after FM4‐64 labeling by FACS. Labeling intensity with FM4‐64 was similar for both strains (Fig 3C–E). However, the fluorescence emission of the lumenal GFP (Nyv1‐GFP) was significantly diminished by the presence of FM4‐64, whereas GFP emission at the cytosolic leaflet (Vph1‐GFP) was not reduced (Fig 3E). This suggests that FM4‐64 is concentrated in the lumenal leaflet of vacuoles.
Figure 3. FRET‐based localization of FM4‐64 at the inner membrane leaflet.
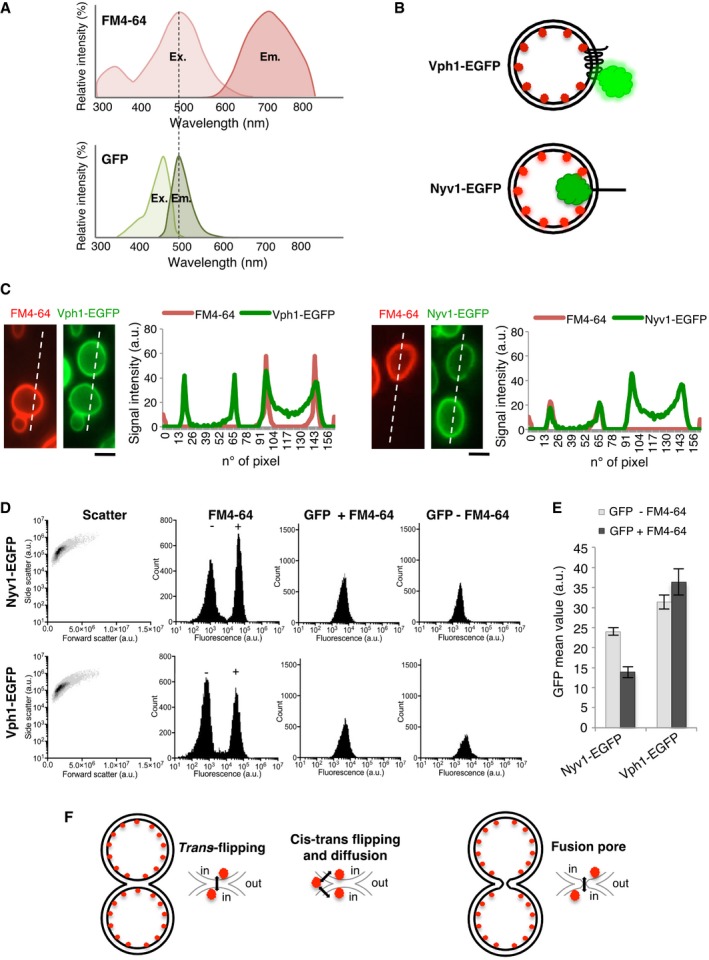
- FM4‐64 and GFP excitation/emission spectra.
- FRET‐based in vivo strategy to distinguish localization of FM4‐64 in the inner or outer leaflets of vacuolar membranes. EGFP tags were added to the cytosolic C‐terminus of Vph1 or to the lumenal C‐terminus of Nyv1.
- Assay by microscopy. Half of two cultures of cells expressing Vph1‐EGFP or Nyv1‐EGFP were labeled with FM4‐64, washed, and mixed with the other, non‐labeled half of the same culture. Cells were analyzed by spinning disk confocal microscopy. The intensities of GFP fluorescence were tracked along the dashed lines and compared between neighboring FM4‐64‐labeled and unlabeled cells.
- FACS analysis. The strains from (C) were labeled as described, washed, and analyzed by FACS. Shown are side (SSC‐A) and forward scatter (FSC‐A), as well as the fluorescence intensity distributions for FM4‐64 and for GFP in the absence or presence of FM4‐64.
- Comparison of the GFP mean fluorescence from FM4‐64‐stained cells and unstained cells (20,000 each).
- Possibilities for FM4‐64 transfer between the inner leaflets of two tethered vacuoles. Flipping between the trans‐leaflets of a hemifusion structure; reversible flipping into the outer leaflet, establishing a minor pool that then transfers through the buffer or through the outer leaflet; or passage through a fusion pore.
Source data are available online for this figure.
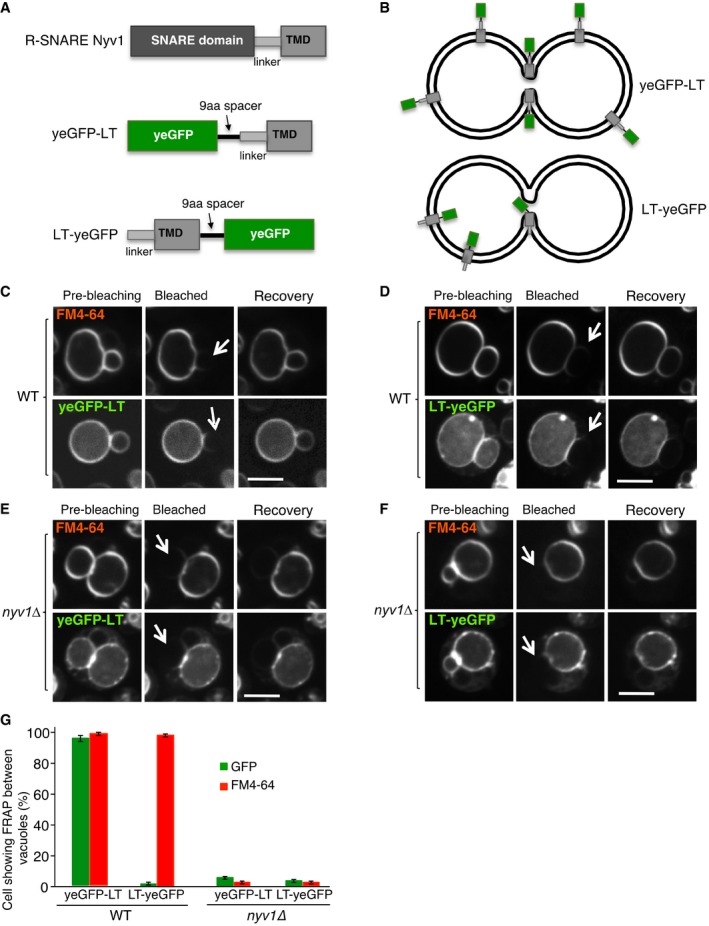
The transfer of FM4‐64 between two vacuoles might then occur through continuity of the inner leaflets, or through the outer leaflets if the probe can flip between the two leaflets (Fig 3F). We developed a reporter that allows to stringently test the continuity of the inner leaflets (Fig 4), based on the following prediction: If the organelles are connected by a nanoscopic fusion pore in which both leaflets are fused, transmembrane proteins might be able to pass between these vacuoles, whereas hemifused membranes would not allow this passage. Passage through the pore should only be possible provided that the transmembrane domains (TMDs) carry no bulky hydrophilic parts that are exposed to the lumen and might hinder their diffusion through the small pore. As a basis for this reporter, we used the TMD of the vacuolar protein Nyv1, because it does not contain hydrophilic sequences at its lumenal, C‐terminal end (Fig 4A and B). A yeGFP domain was added to the cytosolic N‐terminal end of this TMD. FRAP experiments showed that this reporter (yeGFP‐LT) passed freely between tethered vacuoles and behaved similarly as FM4‐64 (Fig 4C and G). An equivalent construct with the TMD of an unrelated vacuolar protein, alkaline phosphatase (GFP‐TMDALP), showed the same behavior (Fig EV3), suggesting that the ability to pass between adjacent vacuoles was independent of the chemical nature of the TMD.
Figure 4. Protein‐based assay for a nanoscopic fusion pore.
-
ASynthetic reporter proteins carrying EGFP either at the lumenal or cytosolic end of the single‐spanning transmembrane domain of Nyv1, which carries no hydrophilic extensions at its lumenal C‐terminus.
-
BThe topology of these constructs in the vacuolar membrane is indicated.
-
C, DFRAP assays for fusion pores. The indicated cells expressing (C) yeGFP‐LT or (D) LT‐yeGFP were labeled with FM4‐64 and subjected to FRAP experiments as in Fig 2. Cells were imaged before and 0 (bleached) or 30 s after photobleaching (recovery). The bleached areas are indicated by an arrow.
-
E, FFRAP assays for fusion pores were performed as in (C, D), but with nyv1Δ cells. Scale bar: 2 μm.
-
GThe histogram reports the fraction of cells showing FRAP. Means and SD are shown from three independent experiments, with 100 cells analyzed in each.
Source data are available online for this figure.
Figure EV3. Passage of a GFP‐fusion with the TMD of the vacuolar alkaline phosphatase (ALP) between vacuoles.
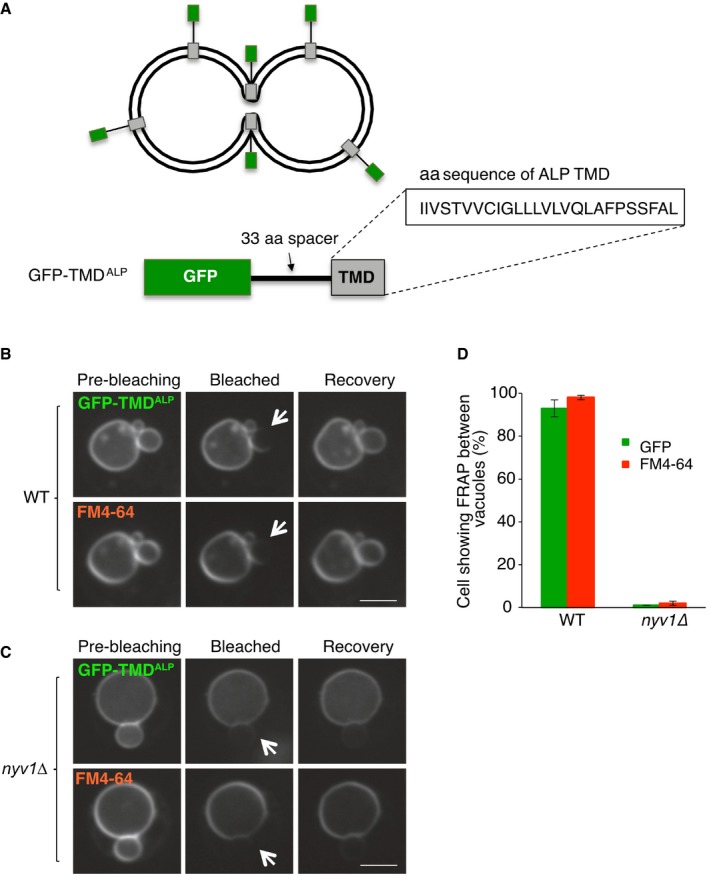
-
A–CThe synthetic reporter protein GFP‐TMDALP was created (A), which carries GFP at the cytosolic, N‐terminal end of the single‐spanning transmembrane domain of ALP, and expressed in (B) wild‐type or (C) isogenic BJ nyv1Δ cells. Cells were labeled with FM4‐64 and subjected to FRAP experiments as in Fig 4. Cells were imaged before and 0 or 30 s after photobleaching. The bleached area is indicated by an arrow. Scale bar: 2 μm.
-
DThe histogram reports the fraction of cells showing FRAP. Means and SD are shown for three independent experiments with 100 cells analyzed for each.
Source data are available online for this figure.
In contrast to the TMDs carrying a cytoplasmic GFP, an analogous fusion protein (LT‐yeGFP), in which the yeGFP domain was attached to the lumenal end of the TMD, did not pass (Fig 4D and G), presumably because its lumenal end is too bulky to pass through the pore. We also tested the effect of smaller lumenal extensions at the C‐terminus of this TMD by adding polar amino acids to yeGFP‐LT (Fig EV4A). Addition of a single serine (yeGFP‐LT+S; Fig EV4B and C) or of a serine/lysine dipeptide (yeGFP‐LT+SK; Fig EV4D) did not affect the passage through the pore. However, the addition of a hexapeptide (yeGFP‐LT+SKADSA; Fig EV4E) began to interfere with the passage, although it did not block it quite as efficiently as the addition of an entire GFP (compare Figs EV4F and 4G). The hexapeptide has a molecular mass of 578 Da, which is in a similar range as the soluble probes 5‐(and‐6)‐carboxy‐2′,7′‐dichlorofluorescein (401 Da; this is the hydrolyzed, vacuolar product of CDCFDA) and 5‐amino‐1‐(5‐phospho‐D‐ribosyl)imidazole (294 Da), which did not pass between adjacent vacuoles either (Fig 2C). The passage of FM4‐64 remained unchanged for all variants. In cells that lacked the vacuolar R‐SNARE, neither yeGFP‐LT nor GFP‐TMDALP or FM4‐64 passed between tethered vacuoles (Fig 4E–G), confirming that their passage depends on the activity of the vacuolar fusion machinery. These results support the notion that seemingly “tethered” vacuoles are in fact connected by a nanoscopic fusion pore. Since this pore does not permit passage of hydrophilic molecules or extensions of around 300‐500 Da, its radius may not exceed ~0.5 nm (see below, Fig 8).
Figure EV4. Effect of small hydrophilic extensions on the TMD of yeGFP‐LT on passage between vacuoles.

-
AThe synthetic reporter protein yeGFP‐LT (used in Fig 4A) was extended at its C‐terminal, lumenal end by adding the peptide sequences marked in blue.
-
B–EFRAP assays for fusion pores. Cells expressing (B) yeGFP‐LT, (C) yeGFP‐LT+S, (D) yeGFP‐LT+SK, or (E) yeGFP‐LT+SKADSA were labeled with FM4‐64 and subjected to FRAP experiments as in Fig 4. Cells were imaged before and 0 or 30 s after photobleaching. The bleached area is indicated by an arrow. Scale bar: 2 μm.
-
FThe histogram reports the fraction of cells showing FRAP. Means and SD are shown for three independent experiments with 100 cells analyzed for each.
Source data are available online for this figure.
Figure 8. The tension‐less fusion pore.
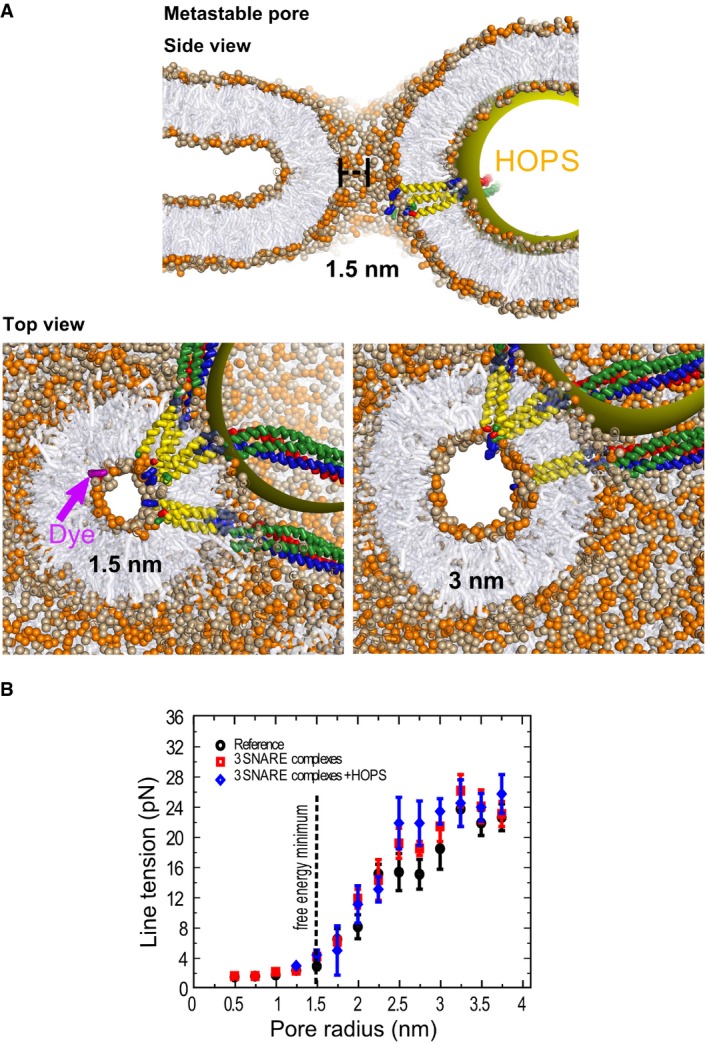
- A tension‐less protein‐lined metastable fusion pore formed between two mixed (3:2, PC:PE) model membranes (POPC head groups colored light brown, POPE head groups colored orange). The radius of the pore is 1.5 nm. The yellow sphere mimics a steric perturbation on the fusion site imposed by HOPS binding to one of the SNARE complexes. The upper panel shows a cross‐section of this pore in side view. The lower panels show side views of cross‐sections through this 1.5 nm pore, which is at the free energy minimum, as well as of a 3 nm pore, which is at the threshold where the line tension converges to a constant value (see B). Notice that the cross‐sectional shape of the pore (shown in top views) remains largely spherical despite the heterogeneity of the fusion site. The top view show also a fluorescent dye molecule (dichlorofluorescein, MW = 401 Da, in purple) to illustrate its scale relative to the 1.5 nm pore.
- Line tension of the fusion pore in pN as function of pore radius and the fusion proteins inserted into it. The black dotted line represents the position of the local minimum. The initial expansion is relatively insensitive to the presence of fusion proteins. Each data point represents the average line tension measured over an ˜600‐ns equilibrium simulation. Error bars are based on block averaging over the obtained data set (the autocorrelation time is ˜30 ns).
We also devised an assay for outer leaflet lipid mixing (Fig 5), which is based on cytosolic expression of GFP fused to FYVE2 or PX domains. These domains bind phosphatidylinositol phosphate (PI3P) in the cytosolic leaflet of vacuoles (Burd & Emr, 1998; Gillooly et al, 2000; Cheever et al, 2001). Whereas FYVE2‐GFP readily diffused between tethered wild‐type vacuoles after photobleaching (Fig 5A), this transfer did not occur in strains carrying the fusion‐deficient allele ypt7 T22N (Fig 5C). ypt7 T22N produces an inactive form of the vacuolar Rab‐GTPase Ypt7, which mimics its GDP‐bound state (Wada et al, 1996). Also, a vma16 F190Y allele did not allow transfer of FYVE2‐GFP in vivo (Fig 5D). This allele produces a pump‐active but fusion‐deficient proteolipid of the V‐ATPase V 0 sector, which impairs lipid mixing but permits trans‐SNARE pairing in vitro (Strasser et al, 2011). Both controls suggest that FYVE2‐GFP transfers between vacuoles by diffusion of the lipid that it is attached to, and not by diffusion through the cytosol. It can hence serve to trace outer leaflet lipid mixing.
Figure 5. Discrimination of inner and outer leaflet mixing.
-
A–FThe indicated yeast strains were transformed with expression plasmids for FYVE2‐GFP, and their vacuolar membranes were labeled with FM4‐64. FRAP was performed as in Fig 2, using a spinning disk microscope equipped with an emission beam splitter and two synchronized cameras, allowing to simultaneously analyze FM4‐64 and GFP fluorescence. The histograms show the kinetics of signal recovery for (A) wild‐type (WT), (B) vam3 tsf, (C) ypt7 T22N, (D) vma16 F190Y, (E) vps33 P184L, and (F) nyv1Δ cells. Scale bar: 2 μm. Arrows indicate the bleaching area. Means and SD are shown for 20 stained vacuoles from three independent experiments.
Source data are available online for this figure.
We used this assay to analyze a thermosensitive version of the vacuolar Qa‐SNARE Vam3 (vam3 tsf). This allele codes for two substitutions in the SNARE domain: I203T and I235N. Both residues are located within the hydrophobic layers (+3 and −6) that mediate the coiled‐coil SNARE interactions. vam3 tsf cells show normal‐sized vacuoles, no significant defects in protein trafficking toward the vacuoles at 25°C (Darsow et al, 1997), and normal levels of Vam3 (Fig EV5). vam3 tsf cells grown at 25°C showed passage of FYVE2‐GFP (Fig 5B), but not of FM4‐64, suggesting that their outer leaflets are fused but the inner leaflets are not fused. This finding also argues against the possibility that FM4‐64 transfer between wild‐type vacuoles (Fig 5A) occurs by flip‐flop of the probe from the inner into the outer leaflet, or by flip‐flop directly between two inner leaflets at a hemifusion site (Fig 3F). FM4‐64 transfer can thus serve as an in vivo assay for fusion between the inner leaflets of vacuoles. Deletion of the vacuolar R‐SNARE Nyv1 or mutation of the SM protein Vps33 prevented transfer of FM4‐64 and FYVE2‐GFP (Fig 5E and F). Thus, vacuolar SNAREs, Vps33, and active Ypt7 are required to accumulate vacuoles in a steady state where both the outer and inner leaflets mix yet a fusion pore does not expand.
Figure EV5. Lack of FM4‐64 transfer in a thermosensitive mutant of the vacuolar Qa‐SNARE Vam3.
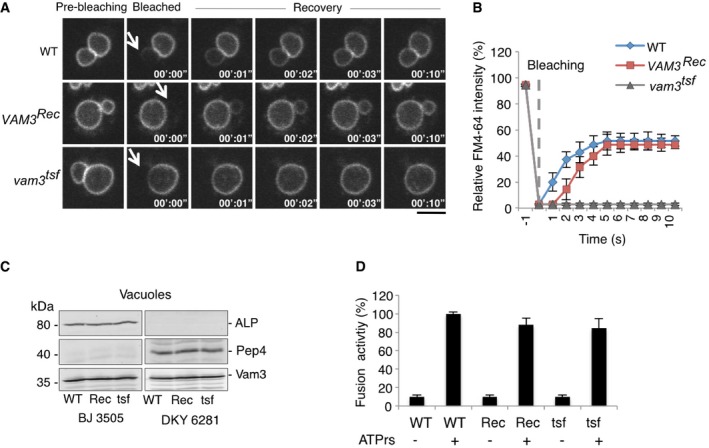
- The indicated cells were labeled with FM4‐64 and analyzed by FRAP as in Fig 2. Dashed white circles indicate the area of bleaching. White arrows indicate the bleached area. Scale bar: 2 μm.
- Kinetics of FM4‐64 recovery, recorded from experiments as in (A). Means and SD are shown from three experiments with 20 stained vacuoles each.
- Vacuoles purified from the indicated strains were analyzed by SDS–PAGE and Western blotting against the reporter proteins for the content mixing assay, the vacuolar alkaline phosphatase Pho8 and the protease Pep4, as well as Vam3.
- Vacuoles were prepared from the indicated strains as in (C) and used for in vitro fusion assay in the absence or presence of ATP. Fusion activity was measured through the activation of Pho8 by Pep4. Means and SD are shown for three independent experiments.
Non‐expanding fusion pores result from complete vacuole fission followed by rapid re‐fusion
Vacuole fission occurs during vacuole transmission into daughter cells, when vacuoles in the mother cells pinch off smaller tubulo‐vesicular structures, which migrate into the daughter cell and fuse there to establish the daughter cell vacuole. Vacuole fission can also be induced by hypertonic media (Weisman, 2003). In both cases, the vacuolar fragments remain associated with each other.
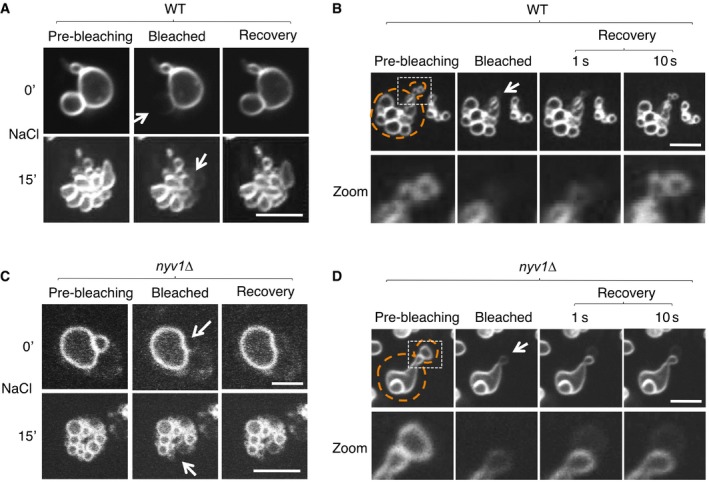
We asked whether vacuoles in these clusters constitutively return to non‐expanded fusion pores after a fission reaction, or whether this transition is delayed and potentially regulated. Hypertonic shock induces vacuole fragmentation within < 5 min, followed by a slow coalescence of the fragments into larger vacuoles as the cells adjust to the osmotic challenge (Bonangelino et al, 2002; LaGrassa & Ungermann, 2005; Michaillat et al, 2012; Zieger & Mayer, 2012; Michaillat & Mayer, 2013). This coalescence becomes prominent after 60 min. We assayed FM4‐64 transfer between vacuoles at different time points after a hypertonic shock (Fig 6). Already 15 min after the induction of vacuole fragmentation, i.e., long before the cells adapted to the osmotic conditions and recovered normal‐sized, large vacuoles, FM4‐64 readily diffused between vacuolar fragments in the clustered vacuolar vesicles (Fig 6A). Dye transfer was even observed within the first 1–2 min after the hypertonic shock, i.e., immediately after formation of the fragments. Also, vacuolar fragments that are formed during vacuole transmission into daughter cells showed FM4‐64 transfer (Fig 6B). This could mean that the vacuoles never undergo complete fission under these conditions, or that the membranes separate completely but re‐fuse rapidly to establish non‐expanding fusion pores. An argument in favor of the latter hypothesis is provided by the observation that vacuoles from nyv1Δ mutants, which lack the vacuolar R‐SNARE Nyv1 and hence show slow fusion in vivo (Baars et al, 2007), did not transfer FM4‐64 between osmotically induced vacuolar fragments (Fig 6C), nor between the vacuolar fragments formed during vacuole transmission (Fig 6D). Thus, a connection by non‐expanding fusion pores appears to represent the default state of vacuoles in a living cell, which is immediately re‐established after a fission event. The cells must then control the full coalescence of vacuoles at the level of fusion pore expansion, suggesting that this terminal step of the fusion reaction might be regulated.
Figure 6. Rapid re‐establishment of membrane continuity after membrane fission.
-
A–DWild‐type (A, B) or nyv1Δ cells (C,D), which lack the vacuolar R‐SNARE Nyv1, were labeled with FM4‐64. Cells were immobilized on a chambered slide and subjected to FRAP experiments as in Fig 2A. (C) Vacuole fission induced by hypertonic shift. FRAP experiments were performed before (0′) or 15 min after addition of NaCl to 0.5 M. The fluorescence images show the vacuoles inside a single cell. (B, D) Cells in S‐phase were selected, which grow a daughter cell and therefore fission their vacuoles into a chain of tubulo‐vesicular structures, part of which are transported into the daughter cell. FRAP experiment on vesicles in the inheritance structure was performed. Arrows indicate the bleaching area, and dashed orange lines the cell cortex. Scale bar: 2 μm.
A single peripheral fusion zone connects vacuoles in vivo
In vitro, many proteins and lipids involved in vacuole fusion concentrate in a vertex ring surrounding the contact zone between vacuoles (Wang et al, 2002; Fratti et al, 2004; Karunakaran et al, 2012; Mattie et al, 2017; McNally et al, 2017). In order to explore in vivo whether vacuoles are connected through a single fusion zone, or by several dispersed ones, we followed the spatial distribution of FM4‐64 FRAP. We measured intensity profiles along a line (Fig 7A and B; red line) parallel to the plane of the vacuole–vacuole contact zone (green dashed line). During the first 100 ms following photobleaching of one of the two partners, FM4‐64 appeared first on one side and only later on the opposite side of the bleached area (Fig 7C). This is consistent with an asymmetrical positioning of the pore relative to the center of the contact zone, because in this case the distance that FM4‐64 has to cover before reaching the measuring line is different for both sides (Fig 7B). Asymmetric recovery was observed in 20% of the cells analyzed. In judging this number, it should be considered that a pore can only give rise to asymmetric recovery in the microscopic image if it is localized close to the vertex and close to the extreme right or left side of the confocal cross‐section of the contact zone, but not if it is located at a vertex location significantly above or below this cross‐section or close to the center of the contact zone (Fig 7D). Therefore, we must stipulate that even if 100% of the contact zones carried a single pore close to the vertex, this could result in a sufficiently lateral position within the confocal imaging plane only along 20–30% of the vertex ring. The observed frequency of around 20% of asymmetric recovery is close to this maximal value, which suggests that the peripheral localization of the fusion site is a rather typical situation. This result also renders the existence of multiple fusion sites, which are distributed along the vertex ring (Wang et al, 2002), an unlikely scenario. Taken together, our results suggest that under standard growth conditions, the vacuoles in a living cell are connected by a nanoscopic fusion pore that is placed close to the vertex of the contact zone.
Figure 7. Asymmetric diffusion of FM4‐64 through the fusion pore.
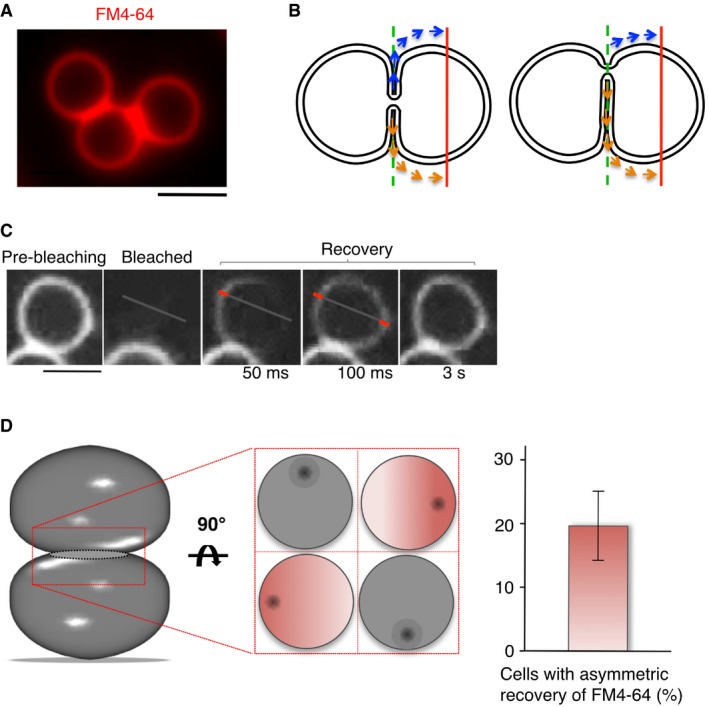
- Wild‐type (BY4741) cells labeled with FM4‐64 show extensive contact zones between vacuoles. Scale bar: 2 μm.
- Schematic view of FM4‐64 diffusion through a small fusion pore located centrally (left panel) or laterally (right panel). The laterally positioned fusion pore leads to diffusion paths of unequal length for fluorescence recovery on both sides of the bleached vacuole. The red line indicates the intersections with the membrane where fluorescence recovery is measured.
- FRAP analysis of FM4‐64‐labeled wild‐type cells was performed by acquiring pictures in continuous acquisition mode after bleaching, for a total period of 5 s. Three representative frames after photobleaching are shown. The bars in the magnified parts of frames 2 and 3 illustrate the positions at which the recovery of FM4‐64 fluorescence was quantified. Scale bar: 2 μm.
- Quantification of recovery experiments in (C). A delay of > 50 ms between the appearance of the signal on both sides of the photobleached vacuole was considered as asymmetric recovery. The histogram shows means and SD from three independent experiments evaluating 50 stained vacuoles each. A Schematic view of the various possible positions of a fusion pore and its consequences for our ability to detect asymmetric FM4‐64 recovery. The contact zone between the two vacuoles is tilted by 90° in the middle panel, which gives four examples for the positioning of the pore (shown as a black dot). Asymmetric recovery could only be detected if the pore is sufficiently far from the center of the contact zone and close to the optical plane that is imaged (the cases marked in red).
Source data are available online for this figure.
Simulation of the behavior of the nanoscopic fusion pore
To gain insight into the properties of the nanoscopic fusion pore, we performed coarse‐grained molecular dynamics simulations of a fusion pore under tension‐less conditions (no osmotic pressure). The pore was modeled with three integrated trans‐SNARE complexes and a mimic of the vacuolar HOPS complex bound to one of them (D'Agostino et al, 2017). The obtained metastable fusion pore has a radius of 1.5 nm (see Fig 8A). Owing to the stiffness of the membrane, the pore features a circular cross‐section, despite the heterogeneous, asymmetric distribution of the proteins surrounding it. Removal of HOPS and SNARE complexes does not affect pore size (~1.5 nm radius in all cases), implying that the structural characteristics of the tension‐less metastable fusion pore, such as the location of its free energy minimum, are mainly determined by membrane properties (black dotted line in Fig 8B). In order to characterize the tension required to expand such an early fusion pore, we calculated the line tension (see Materials and Methods), i.e., the force that the pore interface exerts against expansion, as a function of pore size (see Fig 8B and Materials and Methods). The early fusion pore features a gradual increase in line tension (λ) up to a radius (r) of 3 nm, which then converges to a constant value of ~24 pN, a number that is in agreement with estimations from elastic continuum models (Ryham et al, 2013). The estimated line tension of a fusion pore is thus about three times smaller than the line tension of a regular hole in a flat membrane, being ~74 pN within our model [~40 pN for POPC in atomistic simulations (West et al, 2013)]. A value of 24 pN suggests that a critical membrane tension (σc = λ/r) of ~2 kBT/nm2 or ~8 mN/m would facilitate spontaneous (full) expansion of the fusion pore. This value corresponds well to the membrane tension of 5–7 mN/m that activates the mechanosensitive vacuolar TRP channel Yvc1 (Zhou et al, 2003). Finally, we did not observe that the presence of three SNARE complexes and the additional binding of a HOPS complex eases the early expansion of the fusion pore (Fig 8B). This suggests that active expansion of the pre‐formed pore is either regulated through osmotic pressure or through the forces exerted by a large multiple of fusion constituents (a collective effect). A collective effect could be a plausible scenario because fusion proteins accumulate in a vertex ring around the vacuole–vacuole contact surface (Wang et al, 2002; Fratti et al, 2004), i.e., close to the location of the expanding fusion pore.
At tensions lower than σs, expansion of the pore is energetically unfavorable up to a free energy barrier—being the critical pore radius (rc~λ/σ)—beyond which expansion becomes spontaneous. These estimations model a scenario where an isolated fusion pore radially expands from a central location within the vacuole–vacuole contact zone. However, the fusion pore formed between docked vacuoles expands near the vertex ring of the circular contact zone. Analogous to a pore formed near the rim of a hemifusion diaphragm (a rim‐pore) (Risselada et al, 2014), such an expansion is expected to be energetically less costly and would require a lower tension.
Fusion pore closure is opposed by an increase in bending stress (Ryham et al, 2013) and the unfavorable dehydration of lipid head groups (hydration repulsion) (Smirnova et al, 2013). The resulting, here‐predicted minimal pore size (~1.5 nm) should in principle allow free passage of small molecules, such as the fluorescent lumenal markers that we had used. Since those did, however, not pass the pores between vacuoles, additional factors should constrain pore size in vivo, such as (electrostatic) attractions within the pore interior (Han & Jackson, 2005) or adhesive interactions within the docked contact zone (Hickey & Wickner, 2010; Hernandez et al, 2012; Long et al, 2012; Bharat et al, 2014; Hishida et al, 2017). The latter can originate from tethering factors and electrostatic interactions between the apposed membrane leaflets (Hernandez et al, 2012; Bharat et al, 2014; Hishida et al, 2017). In such a scenario, pore expansion is additionally suppressed because it reduces the amount of favorable contact area between the two adhering leaflets (Long et al, 2012). Furthermore, the difference in chemical potential between interacting cis‐leaflets within the contact zone versus the non‐interacting trans‐leaflets is necessarily compensated via a lateral asymmetry in leaflet population and composition. To model such a compensation, we placed 5% more lipids in the cis‐leaflets than in the trans‐leaflets, while still allowing the membrane to freely adapt its overall area (tension‐less membrane conditions). Indeed, such a leaflet asymmetry can facilitate sub‐nanometer sized pores (Fig 9A), especially when PE‐lipids additionally line the interior of the pore. The non‐expanding nanoscopic fusion pore connecting vacuoles may thus be explained by differences in leaflet population (density) and composition as a consequence of vacuole–vacuole docking.
Figure 9. The non‐expanding fusion pore.
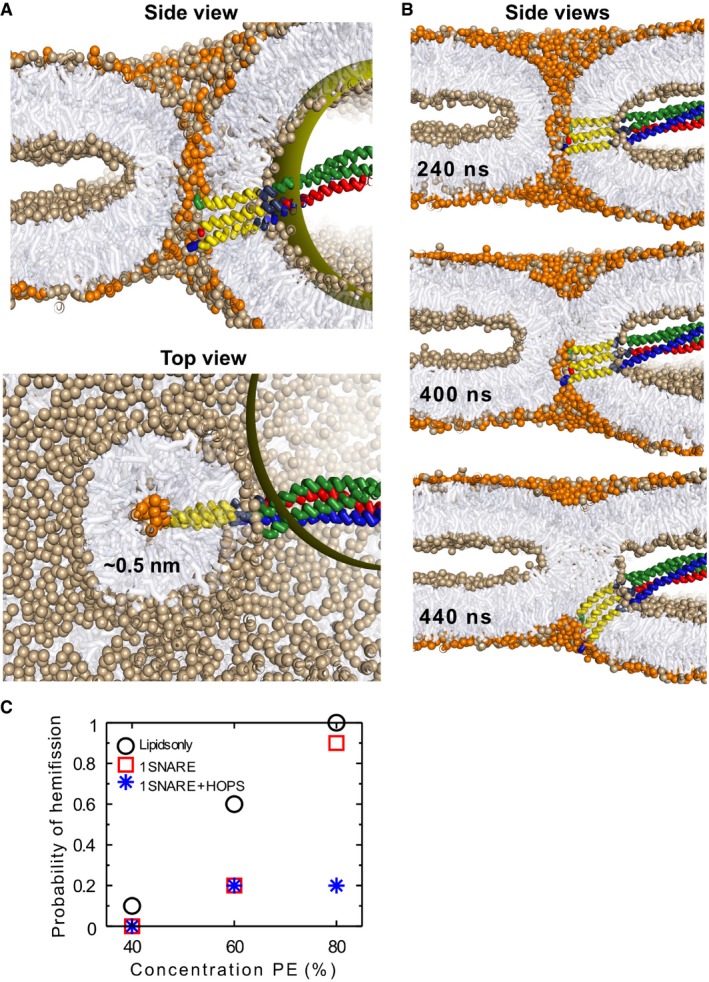
- Asymmetry in lateral leaflet composition and population enforces a fusion pore with a radius of 0.5 nm (POPC head groups colored light brown, POPE colored orange). The panels show cross‐sections, viewed from the side (left) or from the top (right).
- Hemifission event in the presence of a single SNARE complex and in the absence of HOPS. Notice that the SNARE complex is actively expelled from the interior of the pore and bent.
- The graph shows the probability of hemifission after 2 μs for 9 scenarios differing in lipid and protein content of the pore (10 simulations for each scenario). We only vary the concentration of PE‐lipids in the trans‐leaflets and the presence of fusion constituents (lipids only: black circles, 1 SNARE complex: red squares, 1 SNARE complex + HOPS: blue stars). The trans‐leaflets are always comprised of 5% less lipids than the cis‐leaflets. The presence of SNARE complexes and/or HOPS reduces the frequency of hemifission with respect to a system consisting of lipids only.
If such factors actively suppress expansion of the pore, then they may simultaneously enforce its transition back into a stalk structure (hemifission). Such a scenario is illustrated in Fig 9B, where we enforced hemifission by imposing lateral asymmetry (see Materials and Methods). A closing pore actively pushes the SNAREs out of its interior (Fig 9B). This movement should be hindered by the stiffness and the length of the SNARE complex, as well as by its attachment to HOPS, which is anchored in both membranes (Ho & Stroupe, 2015; Lürick et al, 2017). It is therefore plausible that a pore lined by multiple SNARE complexes displays a larger stability against hemifission, in line with experimental observations (Shi et al, 2012; Bao et al, 2018). Furthermore, the large volume of the HOPS complex deforms the fusion site. The steric repulsion that HOPS imposes on the fusion site reduces the effective curvature of the interior of the pore (D'Agostino et al, 2017), which—in analogy to the role of curvature in membrane fusion—stabilizes the pore by opposing formation of a hemifission stalk (Kozlov et al, 2010). Indeed, our 2‐μs simulations (under conditions which strongly favor hemifission) indicate that already the presence of a single SNARE complex with HOPS reduces the probability of pore closure by up to 80% (Fig 9C).
Discussion
Our results suggest a nanoscopic fusion pore as an apparently long‐lived, metastable intermediate in the fusion between two organelles, at which the transition to full fusion and the mixing of content can be regulated according to the physiological status of the cells. Why should the vacuoles in a living yeast cell not only be tethered, but connected by small, metastable fusion pores that do not support content mixing? The load of vacuoles with storage materials, with lysosomal hydrolases and their products, varies greatly, depending on the metabolic state of the cells. Vacuoles are also osmo‐sensitive and can trigger osmo‐compensatory mechanisms through the tension‐sensitive TRP channel Yvc1 (Zhou et al, 2003; Su et al, 2009). Yvc1 releases calcium from vacuoles and activates multiple mechanisms for osmotic adaptation and stress resistance (Cyert & Philpott, 2013). As a second strategy, yeast cells respond to osmotic challenges by fusing their vacuoles or fragmenting them into smaller units. This re‐adjusts the surface‐to‐volume ratio of the vacuoles (Brett & Merz, 2008; Desfougères et al, 2016a), probably to avoid an overload of these hydrolytic compartments, which might lead to their lysis and presumably catastrophic consequences for the cells. Insufficient loading, on the other hand, might eliminate vacuolar membrane tension, which is a critical parameter for the functioning of many channels and transporters (Hamill & Martinac, 2001; Sukharev & Sachs, 2012).
Osmotic pressure and the resulting membrane tension also determine the kinetics and the degree of fusion pore expansion (Cohen et al, 1980; Chizmadzhev et al, 1999, 2000; Bretou et al, 2014; Tran et al, 2015; Rousso et al, 2016). It is striking that activation of the mechanosensitive vacuolar channel Yvc1 requires similar membrane tension as fusion pore expansion. The transition of vacuoles from a nanoscopic pore to full fusion might hence be triggered in a range of membrane tension that is of apparent physiological relevance for this organelle. We propose that this allows the cells to maintain their vacuoles in a metastable equilibrium between lumenal pressure and the energy barrier to fusion pore expansion, which offers an extremely rapid way of adapting the organellar surface‐to‐volume ratio when increased organelle load and membrane tension call for this. The dynamics and reversibility of the metastable fusion pore could thus provide a novel, additional mechanism allowing organelles to adjust the volume of their membrane envelope to the amount of its content.
Our FM4‐64 FRAP experiments suggest that a single fusion zone, which is located close to the vertex of their contact area, connects two vacuoles. This zone might in principle contain a single or multiple fusion pores. Both scenarios are hard to discern by tension stimulated growth since multiple pores will tend to minimize the total line energy by growing one pore at the cost of all others (the contribution of tension to the free energy is irrespective of pore area distribution since it only depends on the total pore area). Moreover, the formation of multiple nanoscopic fusion pores concentrated in a small area should be disfavored because as soon as a first pore has formed it offers a much more relaxing environment for trans‐SNARE complexes than the surrounding tethered membranes. SNARE complexes can re‐orient their transmembrane domains when they integrate into an existing hemifusion structure or pore and should therefore accumulate there (Wu et al, 2017). Since the density of SNAREs on vacuoles is low (around 10–100/μm2) and only a small fraction of them (1–10%) are recovered in tetrameric SNARE complexes (Ungermann et al, 1998; Collins et al, 2005; Zick et al, 2014), depletion of trans‐SNARE complexes from the zone around a nascent fusion pore might suppress the formation of further pores in its vicinity.
We have previously observed that recruitment of large ligands to SNAREs is necessary to induce full fusion of tethered vacuoles in vivo (D'Agostino et al, 2017). Although SNAREs and their ligands do not decrease the interfacial free energy of the pore (line tension), our simulations now provide insights into some factors that contribute to this effect. The steric repulsion imposed by the SNARE/HOPS complex increases the likelihood of the “pore state” with respect to the “stalk state”. Should several SNARE complexes act on a vacuole fusion site cooperatively, which appears to be the case (D'Agostino et al, 2016), this effect should become even more pronounced. We cannot discern whether the observed nano‐pores are truly metastable or whether they reversibly switch back and forth between the two states within the time‐scale of the experiment. The ongoing formation of SNARE complexes may continuously pump energy into such a process and allow more frequent re‐opening even when the stalk state should be favored. The increased probability that fusion sites are in the “pore state”, however, would enhance subsequent nucleated pore expansion via thermal fluctuations or fluctuations in membrane tension (Grafmüller et al, 2009).
It should also be considered that SNARE complexes show a certain stiffness and a tendency to align their TMDs (Stein et al, 2009; Zhang, 2017). Therefore, the immobilized (by squeezing between the apposed membrane leaflets and association with tether proteins), fully zippered SNARE complexes lining a fusion pore may become a safeguard against re‐closure of the pore, revealing a novel aspect that can drive the fusion reaction forward. Here, a significant difference might exist relative to the exceptionally small synaptic vesicles. Due to their high curvature, a SNARE complex should have more freedom to re‐orient itself and escape from the pore. However, the numerous proteins that associate with the neuronal SNARE complex (Rizo & Südhof, 2012), and which themselves interact with the membranes, might continue to restrain the movement of the SNARE complex, at least on the short time scales required to complete exocytosis. Another important difference between the fusion of very small and larger vesicles lies in the size of the contact zone. Whereas this zone is very extensive between adhering vacuoles, synaptic vesicles make rather point‐like contacts and may lack a large adhesion zone around the fusion site (Fernández‐Busnadiego et al, 2010; Imig et al, 2014). Then, the barrier created by membrane adhesion could be much lower for these small vesicles, favoring immediate transition from pore opening to pore expansion.
Materials and Methods
Strains and culture conditions
All strains were grown either in YPD (Yeast extract Peptone Dextrose) in the presence or absence of G418, or in SC (Synthetic complete) dropout medium lacking a nutrient required to select for an auxotrophic marker. Strains used in this study are listed in Table 1. All experiments were performed on cells coming out of cultures that had grown logarithmically overnight, harvested at an OD600 nm of 1–2.
Table 1.
Yeast strains used in the work
| Strain | Genotype | Reference |
|---|---|---|
| BJ3505 | MATa pep4::HIS3 prb1‐Δ 1.6R lys2‐208 trp1‐Δ 101 ura3‐52 gal2 can | Lab stock |
| DKY6281 | MATα pho8::TRP1 leu2‐3 leu2‐112 lys2‐801 suc2‐Δ 9 trp1‐Δ 901 ura3‐52 | Lab stock |
| BY4742 | MATa his3‐1 leu2‐0 met15‐0 ura3‐0 | Euroscarf |
| CRY1 | MATa ade2‐1oc can1‐100 his3‐11,15 leu2‐3112 trp1‐1 ura3‐1 | Lab stock |
| BJ nyv1Δ | BJ3505 Nyv1::natNT2 | Lab stock |
| BJ nyv1Δ + FYVE2‐GFP | BJ3505 Nyv1::natNT2 + pUG36‐FYVE2‐GFP (URA) | This study |
| BJ ypt7(T22N) | BJ3505 Ypt7::Ypt7(T22N) | Lab stock |
| BJ ypt7Δ | BJ3505 Ypt7::natNT2 | Lab stock |
| BY vma16(F190Y) | BY4741 Vma16::natNT2 + pvma16F190Y (HIS3) | Strasser et al, 2011, this study |
| BY vma16(F190Y) + FYVE2‐GFP | BY4741 Vma16::natNT2 + pvma16F190Y(HIS3) + pUG36‐FYVE2‐GFP (URA) | Strasser et al, 2011, this study |
| BJ PX‐GFP | BJ3505 + pUG36‐PX‐GFP (URA) | This study |
| BJ FYVE2‐GFP | BJ3505 + pUG36‐FYVE2‐GFP (URA) | This study |
| BY PX‐GFP | BY4741 + pUG36‐PX‐GFP (URA) | This study |
| BY FYVE2‐GFP | BY4741 + pUG36‐FYVE2‐GFP (URA) | This study |
| BJ Vph1‐EGFP | BJ3505 + pRS416‐Vph1‐EGFP (URA) | Lab stock |
| BJ Nyv1‐EGFP | BJ3505 Nyv1::EGFP (URA) | D'Agostino et al, 2016 |
| BJ Vam3 REC | BJ3505 Vam3::TRP + Vam3 wt (URA) | Lab stock |
| BJ Vam3tsf | BJ3505 Vam3::TRP + Vam3tsf (URA) | Lab stock |
| DKY Vam3 REC | DKY6281 Vam3::KanR + Vam3 wt (URA) | Lab stock |
| DKY Vam3tsf | DKY6281 Vam3:: KanR + Vam3tsf (URA) | Lab stock |
| BJ Vam3tsf + FYVE2‐GFP | BJ3505 Vam3:: KanR + Vam3tsf (TRP) + pUG36‐FYVE2‐GFP (URA) | This study |
| BJ pmc1/vcx1Δ | BJ3505 Pmc1:: KanR, Vcx1::natNT2 | Lab stock |
| BJ pmc1/vcx1Δ + Vph1‐EGFP | BJ3505 Pmc1:: KanR, Vcx1::natNT2 + pRS416‐Vph1‐EGFP (URA) | This study |
| BJ yeGFP‐LT | BJ3505 + pRS416‐yeGFP‐LT (URA) | This study |
| BJ LT‐yeGFP | BJ3505 + pRS416‐LT‐yeGFP (URA) | This study |
| BJ nyv1Δ + yeGFP‐LT | BJ3505 Nyv1::natNT2 + pRS416‐yeGFP‐LT (URA) | This study |
| BJ nyv1Δ + LT‐yeGFP | BJ3505 Nyv1::natNT2 + pRS416‐LT‐yeGFP (URA) | This study |
| BJ vps33(P184L) | BJ3505 Leu2:: KanR; Vps33::natNT2 + pRS415‐Vps33‐P184L (LEU) | Pieren et al, 2010 |
| BJ vps33(P184L) + FYVE2‐GFP | BJ3505 Leu2::KanR; Vps33::natNT2 + pRS415‐Vps33‐P184L (LEU) + pUG36‐FYVE2‐GFP (URA) | This study |
| BJ ypt7Δ + PX‐GFP | BJ3505 ypt7::natNT2 + pUG36‐PX‐GFP (URA) | This study |
| BJ yEGFP‐LT+S | BJ3505 + pRS416‐yEGFP‐LT+S (URA) | This study |
| BJ yEGFP‐LT+SK | BJ3505 + pRS416‐yEGFP‐LT+SK (URA) | This study |
| BJ yEGFP‐LT+SKADSA | BJ3505 + pRS416‐yEGFP‐LT+SKADSA (URA) | This study |
| BJ + GFP‐TMDALP | BJ3505 + pRS416‐GFP‐TMDALP (URA) | This study |
| BJ nyv1Δ + GFP‐TMDALP | BJ3505 Nyv1::natNT2 + pRS416‐GFP‐TMDALP (URA) | This study |
Genetic manipulations
Yeast transformations were carried out using the lithium acetate method. Gene deletions and tagging were performed as previously established (Janke et al 2004; Longtine et al 1998). Primers used are listed in Table 2. yeGFP‐LT‐ or LT‐yeGFP‐expressing plasmids were generated by amplifying yeGFP sequence from the pKT209 vector. Primers were designed to add the TMD (TTATTAACTTTCACTAT TATACTATTTGTAAGTGCTGCTTTCATGTTTTTCTATCTGTGG) and linker (AAGGTCAAAAATATTACG) of the vacuolar R‐SNARE Nyv1 to the N‐ or C‐terminus of yeGFP. PCR products were inserted into the pRS416 vector by using EcoRI and HindIII restriction enzymes. yeGFP‐LT+S‐, +SK‐, or +SKADSA‐expressing plasmids were generated from yeGFP‐LT by PCR amplification of the yeGFP‐LT plasmid with the respective primers listed in Table 2. GFP‐TMDALP‐expressing plasmid was generated by introducing a STOP codon into the GFP‐ALP coding sequence, after the 60th codon of the alkaline phosphatase gene PHO8, i.e., right at the lumenal end of the TMD sequence. This stop codon was introduced by amplifying a pRS426 plasmid expressing a GFP‐Pho8 fusion protein (Cowles et al, 1997) with the primers GFP‐TMDALP (Table 2).
Table 2.
Primers used in this work
| Name | Sequence |
|---|---|
| yeGFP‐LT |
Fw: 5′‐ CCGGAATTCATGTCTAAAGGTGAAGAATTATTCACTGGT‐3′ Rv: 5′‐CCCAAGCTTTTACCACAGATAGAAAAACATGAAAGCAGCACTTACAAATAGTATAATAGTGAAAGTTAATAACGTAATATTTTTGACCTTACCACCACCACCACCACCTTTGTACAATTCATCCATACCATGGGTAATACC‐3′ |
| LT‐yeGFP |
Fw: 5′‐CCGGAATTCATGAAGGTCAAAAATATTACGTTATTAACTTTCACTATTATACTATTTGTAAGTGCTGCTTTCATGTTTTTCTATCTGTGGGGTGGTGGTGGTGGTGGTGGTGGTGGTATGTCTAAAGGTGAAGAATTATTCACTGGT‐3′ Rv: 5′‐CCCAAGCTTTTATTTGTACAATTCATCCATACCATGGG‐3′ |
| yEGFP‐LT +S |
Fw: 5′‐CCGGAATTCATGTCTAAAGGTGAAGAATTATTCACTGGT‐3′ Rv: 5′‐CCCAAGCTTTTAAGACCACAGATAGAAAAACATGAAAGC‐3′ |
| yEGFP‐LT +SK |
Fw: 5′‐CCGGAATTCATGTCTAAAGGTGAAGAATTATTCACTGGT‐3′ Rv: 5′‐CCCAAGCTTTTACTTAGACCACAGATAGAAAAACATGAAAGC‐3′ |
| yEGFP‐LT +SKADSA |
Fw: 5′‐CCGGAATTCATGTCTAAAGGTGAAGAATTATTCACTGGT‐3′ Rv: 5′‐CCCAAGCTTTTAAGCAGAATCAGCCTTAGACCACAGATAGAAAAACATGAAAGC‐3′ |
| GFP‐TMDALP |
Fw: 5′‐CATTTCCAAGCAGTTTTGCATTACGTTAAGCATCACACAAGAAGAAGAATGTC‐3′ Rv: 5′‐GACATTCTTCTTCTTGTGTGATGCTTAACGTAATGCAAAACTGCTTGGAAATG‐3′ |
Cell immobilization and fragmentation assay
Concanavalin A from an aqueous 10 mg/ml stock solution was diluted 10‐fold with water. A drop of 35 μl was spotted onto LabTek eight‐well chambered cover slides (Z734853, Sigma‐Aldrich) and air‐dried. Yeast cells were centrifuged at 2,000 × g for 3 min and resuspended in 25 μl of fresh medium. The cell suspension was spotted on the coated slide and incubated for 5 min at room temperature. After two washing steps with 400 μl of fresh medium, the cells were kept in 200 μl of medium for imaging. An equal volume of medium containing 1 M NaCl was added to induce vacuole fragmentation by a hypertonic shock, yielding a final concentration of 0.5 M NaCl. Pictures were taken with an UltraView Vox confocal spinning disk unit (PerkinElmer‐Cetus, Waltham, MA) connected to an inverted Zeiss microscope (Carl Zeiss, Jena, Germany) equipped with a 100× oil immersion lens with a numerical aperture of 1.41 and two Hamamatsu Flash 4.0V2 cameras.
FM4‐64 staining
Cells were inoculated from a pre‐culture in stationary phase and grown overnight to logarithmic phase (OD600 nm between 0.2 and 0.8). After dilution to OD600 = 0.2 in 1 ml culture, 10 μM FM4‐64 was added from a 10 mM stock in DMSO. Cells were incubated (1 h), followed by three washing steps with medium without FM4‐64 (2 min, 3,000 × g) and a subsequent chase of 1–2 h in medium without FM4‐64. The length of the chase period was varied depending on the endocytotic activity of the strain. Cells for microscopy were grown and stained at 30°C. The temperature was maintained constant during visualization, using an environmental control chamber and an objective heater.
FRAP analysis
FRAP experiments were performed with the photokinesis unit on the Ultraview Vox confocal system as described previously (Coffman et al, 2009; Laporte et al, 2011). The full‐size non‐constricting ring was selected, and the middle slice from the z‐stacks was used for bleaching. After collecting 2 pre‐bleaching images, a selected region of interest (ROI) was bleached to < 80% of the original signal by 20 ms of a 546 or 488 nm laser pulse at maximal intensity. Post‐bleaching images were collected each second or in continuous acquisition mode (> 1 frame/50 ms). After subtracting the background signals (regions from the same field but without any fluorescent signals) and correcting for photobleaching during image acquisition (constitutive bleaching of fluorescence signal from unbleached cells in the same field was measured in parallel and taken into account for measuring fluorescence recovery after photobleaching). The signal intensity of the bleached area was normalized to the mean of its fluorescence intensity before bleaching, which was set to 100%.
Vacuole isolation
BJ3505 and DKY6281 strains carrying tagged SNAREs were grown in YPD (30°C, or 25°C for ts mutants; 225 rpm) to OD600 nm = 1 and harvested (2 min, 4,600 × g). Vacuoles were isolated through hydrolyzing yeast cell walls with lyticase, recombinantly expressed in E. coli RSB805 (kindly provided by Dr. Randy Schekman, Berkeley) and prepared from a periplasmic supernatant (Reese et al, 2005). Harvested cells were resuspended in reduction buffer (30 mM Tris–Cl pH 8.9, 10 mM DTT) and incubated for 5 min at 30 or 25°C. After harvesting as described above, cells were resuspended in 15 ml digestion buffer (600 mM sorbitol, 50 mM K‐phosphate pH 7.5 in YP medium with 0.2% glucose, and 0.1 mg/ml lyticase preparation), incubated for 25 min at 30 or 25°C, and centrifuged (2 min, 3,250 × g, JLA25.5 rotor). Spheroblasts were resuspended in 2 ml 15% Ficoll‐400 in PS buffer (10 mM PIPES/KOH pH 6.8, 200 mM sorbitol) and 250 μl DEAE dextran (0.4 mg/ml in PS buffer). After 2 min of incubation at 30°C, the cells were transferred to SW41 tubes and overlaid with steps of 8%, 4%, and 0% Ficoll‐400 in PS buffer. Cells were centrifuged for 90 min at 4°C and 153,900 × g in a SW41 rotor.
Vacuole fusion
DKY6281 and BJ3505 vacuoles were adjusted to a protein concentration of 0.5 mg/ml and incubated in a volume of 30 μl PS buffer (10 mM PIPES/KOH pH 6.8, 200 mM sorbitol) with 125 mM KCl, 0.5 mM MnCl2, 1 mM DTT. Inhibitors were added before the fusion reaction was started through addition of the ATP‐regenerating system (0.25 mg/ml creatine kinase, 20 mM creatine phosphate, 500 μM ATP, 500 μM MgCl2). After 60 min at 27°C, 25°C or on ice, 1 ml of PS buffer was added, vacuoles were centrifuged (2 min, 20,000 × g, 4°C), resuspended in 500 μl developing buffer (10 mM MgCl2, 0.2% Triton X‐100, 250 mM Tris–HCl pH 8.9, 1 mM p‐nitrophenylphosphate), and incubated for 5 min at 27°C. The reactions were stopped with 500 μl 1 M glycine pH 11.5, and the OD was measured at 405 nm.
Flow cytometry analysis
Cells were inoculated from a pre‐culture in stationary phase and grown overnight to logarithmic phase (OD600 nm between 0.2 and 0.8). After dilution to OD600 = 0.2 in 1 ml culture, cells were stained with FM4‐64. FM4‐64‐stained and non‐stained cells were mixed in order to have GFP+/FM4‐64+ and GFP+/FM4‐64− cells in the same tube for simultaneous measuring. Data were acquired with a FACSCanto flow cytometer (BD Biosciences) and analyzed using FlowJo software (Tree Star).
3D reconstruction
Overnight cultures were diluted to OD600 = 0.2 in 1 ml, stained for FM4‐64, and immobilized onto LabTek eight‐well chambered cover slides. The temperature was maintained constant (30°C) during visualization, using an environmental control chamber and an objective heater. Z‐stacks were acquired using a piezo focus drive (step size set to 200 nm). 3D reconstruction was performed by using Bitplane IMARIS suite 6.3.1.
Statistics in biological experiments
Where data were averaged, the samples stem from independent experiments with independent preparations of vacuoles or cells; that is, they represent biological replicates. Significance of differences has been evaluated through Student's t‐test. Differences are only mentioned and interpreted as such if P < 0.005.
Molecular dynamics
Simulation model and settings
The molecular dynamics simulations were performed with the GROMACS simulation package (Hess et al, 2008), version 4.5.7. We used the MARTINI coarse‐grained model (Marrink et al, 2007; Monticelli et al, 2008) to simulate the lipids, amino acids, and solvent. In all simulations, the system was coupled to a constant temperature bath using the “V‐rescale” algorithm with a relaxation time of 1.0 ps. All simulations were performed at a temperature of 293 K. Periodic boundary conditions were applied to simulate bulk behavior. The time step used in the simulation was 20 fs. The dielectric constant in the simulations was εr = 15. The neighbor list was updated every 10 simulation steps. The pressure was weakly coupled to 1 bar (Berendsen pressure coupling) with a relaxation time of 1.0 ps.
Modeling the vacuolar SNARE complex and HOPS
The vacuole SNARE complex was modeled using the MARTINI model for proteins (Monticelli et al, 2008), which qualitatively captures the chemical nature of each individual amino acid and includes the secondary structure. For NYV1, the modeled sequence is “IGDATEDQIKDVIQIMNDNIDKFLERQERVSLLVDKTSQLNSSSNKFRRKAVNIKEIMWW[QKVKN]ITLLTFTIILFVSAAFMFFYLW”, for VAM3: “TIIHQERSQQIGRIHTAVQEVNAIFHQLGSLVKEQGEQVTTIDENISHLHDNMQNANKQLTRA[DQHQRDRNK]CGKVTLIIIIVVCMVVLLAVLS”, for VTI1: “IDDDQRQQLLSNHAILQKSGDRLKDASRIANETEGIGSQIMMDLRSQRETLENARQTLFQADSYVDKSIKTLKTMTR[RLVANK]FISYAIIAVLILLILLVLFSKFK”, and for VAM7 “MQMVRDQEQELVALHRIIQAQRGLALEMNEELQTQNELLTALEDDVDNTGRRLQIANKKARHF”. Here, the brackets [] depict the defined linker regions. The resolved, previously simulated structure of the neuronal SNARE complex was used as a template structure for the vacuolar SNARE complex. To this aim, we applied an external field, using a self‐modified version of Gromacs, to drive the structure of the vacuole SNARE complex toward the known structure of the neuronal SNARE complex based on the known alignment. All residues are defined alpha‐helical except for the defined SNARE linkers. We modeled all of the three SNAREs as helixes in agreement with the resolved post‐fusion structure of the Neuronal SNARE complex (Stein et al, 2009).
The “soluble” HOPS is modeled by a soft harmonic repulsive potential, V(r) = Kforce(RHOPS‐r)2 if r < RHOPS else V(r) = 0, where V(r) is the potential energy (Kforce = 50 kJ nm−2 mol−1, RHOPS = 7 nm) as a function of r, i.e., the distance from the geometrical center of “HOPS”. The “HOPS” potential only acts on the carbon tails and glycerol groups of the lipids. Solvent can freely enter and pass “HOPS” in order to conserve ongoing interactions between the SNAREs. The geometrical center of HOPS is restrained in space via harmonic position restrains (Kforce = 1,000 kJ nm−2 mol−1). In addition, fifteen backbone atoms of VAM3 (GLY218—ASP232) are harmonically restrained to conserve the relative position of the SNARE complex with respect to HOPS and to simulate a torsional restraining effect of the binding pocket on the SNARE complex.
Fluorescent dye molecule
The parameterization of the fluorescent dye 5‐(and‐6)‐carboxy‐2′,7′‐dichlorofluorescein (hydrolyzed form of 5‐(and 6)‐carboxy‐2′,7′‐dichlorofluorescein diacetate) is based on a building block approach used within the Martini coarse‐grained model. Bond and angle potentials were matched to distributions of the underlying atomistic structure following the protocol found on the official Martini website (http://cgmartini.nl). The initial atomistic structure was obtained using the Automated force field Topology Builder (ATB) (Malde et al, 2011). The atomistic simulations were performed using the Gromacs simulation package 4.6.4 and the GROMOS 54A7 with a 2‐fs timestep, v‐rescale thermostat, and Parrinello‐Rahman barostat (tau_t = 0.1, T = 300, tau_P = 0.5, compressibility = 4.6e‐5). This coarse‐grained parameterization is only meant to give a semi‐qualitative description of its molecular dimension relative to the fusion pore.
Membrane simulation setups
The here‐simulated systems were based on one of our previous works (D'Agostino et al, 2017). For the line tension calculations, tension‐less membrane conditions were ensured by cutting the periodicity of the membranes along the x‐dimension which allows free adaption of membrane area, free lipid flip‐flops via the created membrane edges, and free flux of solvent toward the inter‐membrane space. The “asymmetric” membranes were periodically coupled in xy‐dimension since the leaflet compositions must be conserved. In such a case, the xy‐dimension was coupled to pressure bath of 1 bar to ensure on overall tension‐less membrane conditions. Only one SNARE complex was present in these systems. An overview of the here‐simulated systems is presented in Table 3.
Table 3.
Simulation systems
| Setup: | Number (#) of POPC | No. of POPE | No. of Solvent | Size (nm3) | t (μs) |
|---|---|---|---|---|---|
| Line tension calculation (Fig 8B) | 8,171 (60%) | 5,450 (40%) | 497,809 | 67 × 40 × 29 | 2 |
| Asymmetric setups: | # Lipids trans‐versus cis‐leaflet | # POPE trans‐versus cis‐leaflet | # Solvent | Size (nm3) | t (μs) |
|---|---|---|---|---|---|
| 40% PE (small pore, Fig 9A) | 5,262:5,542 | 2,282:0 | 399,628 | 45 × 37 × 37 | 2 |
| 60% PE | 5,262:5,542 | 3,282:0 | 399,628 | 45 × 37 × 37 | 2 |
| 80% PE (hemifission, Fig 9B) | 5262:5542 | 4,282:0 | 399,628 | 45 × 37 × 37 | 2 |
Calculation of line tension
The line tension is calculated by imposing a cylindrically shaped soft harmonic repulsive potential V(r) on the carbon tails and glycerol parts of the lipids. Notable, the center of the pore is a particle (mass of 1,000 u), which experiences a resultant force Σf i only because of the potential V(r). Here, V(r) = 0 if r – Rpore > 0 and V(r) = 1/2 Kforce (Rpore ‐r)2 otherwise (K force = 50 kJ nm−2 mol−1). The “pore” particle is coupled to the equations of motion to allow free translation of the (growing) pore with respect to the translationally fixed HOPS‐SNARE complex. The radial force, dV/dr, exerted by the pore interface opposes the line tension λ and conserves a constant radius of the fusion pore. Since λ is the projection of force along the pore interface, λ = 1/(2π) * (dV/dr), λ can be obtained from the ensemble average (dV/dr)av of the measured radial force. For r < Rpore, the line tension cannot be defined. The measured apparent line tension in this regime results from the translational entropy of the (soft) pore particle which decreases when r approaches r < Rpore and its kinetic energy (1 kBT).
Author contributions
AM conceived the study. MD'A, HJR, and AM designed the research. MD'A, VC‐M, and LJE carried out experiments. HJR conceived and performed modeling and simulations. AM, HJR, and AM analyzed the data and wrote the paper.
Conflict of interest
The authors declare that they have no conflict of interest.
Supporting information
Expanded View Figures PDF
Movie EV1
Source Data for Expanded View
Review Process File
Source Data Figure 1
Source Data Figure 2
Source Data Figure 3
Source Data Figure 4
Source Data Figure 5
Source Data Figure 7
Acknowledgements
We thank Véronique Comte and Andrea Schmidt for assistance, Scott Emr for strains, and the members of our laboratory for comments on the manuscript. This work was supported by grants from the SNSF to AM and from the Vidi (NWO 723.016.005) and the life@nano programs to HJR. The simulations were performed with resources provided by the North‐German Supercomputing Alliance (HLRN).
The EMBO Journal (2018) 37: e99193
See also: https://doi.org/10.15252/embj.2018100656 (October 2018)
References
- Alpadi K, Kulkarni A, Namjoshi S, Srinivasan S, Sippel KH, Ayscough K, Zieger M, Schmidt A, Mayer A, Evangelista M, Quiocho FA, Peters C (2013) Dynamin‐SNARE interactions control trans‐SNARE formation in intracellular membrane fusion. Nat Commun 4: 1704 [DOI] [PMC free article] [PubMed] [Google Scholar]
- Baars TL, Petri S, Peters C, Mayer A (2007) Role of the V‐ATPase in regulation of the vacuolar fission‐fusion equilibrium. Mol Biol Cell 18: 3873–3882 [DOI] [PMC free article] [PubMed] [Google Scholar]
- Bao H, Das D, Courtney NA, Jiang Y, Briguglio JS, Lou X, Roston D, Cui Q, Chanda B, Chapman ER (2018) Dynamics and number of trans‐SNARE complexes determine nascent fusion pore properties. Nature 554: 260–263 [DOI] [PMC free article] [PubMed] [Google Scholar]
- Bharat TAM, Malsam J, Hagen WJH, Scheutzow A, Söllner TH, Briggs JAG (2014) SNARE and regulatory proteins induce local membrane protrusions to prime docked vesicles for fast calcium‐triggered fusion. EMBO Rep 15: 308–314 [DOI] [PMC free article] [PubMed] [Google Scholar]
- Bonangelino CJ, Nau JJ, Duex JE, Brinkman M, Wurmser AE, Gary JD, Emr SD, Weisman LS (2002) Osmotic stress‐induced increase of phosphatidylinositol 3,5‐bisphosphate requires Vac14p, an activator of the lipid kinase Fab1p. J Cell Biol 156: 1015–1028 [DOI] [PMC free article] [PubMed] [Google Scholar]
- Bretou M, Jouannot O, Fanget I, Pierobon P, Larochette N, Gestraud P, Guillon M, Emiliani V, Gasman S, Desnos C, Lennon‐Duménil A‐M, Darchen F (2014) Cdc42 controls the dilation of the exocytotic fusion pore by regulating membrane tension. Mol Biol Cell 25: 3195–3209 [DOI] [PMC free article] [PubMed] [Google Scholar]
- Brett CL, Merz AJ (2008) Osmotic regulation of Rab‐mediated organelle docking. Curr Biol 18: 1072–1077 [DOI] [PMC free article] [PubMed] [Google Scholar]
- Burd CG, Emr SD (1998) Phosphatidylinositol(3)‐phosphate signaling mediated by specific binding to RING FYVE domains. Mol Cell 2: 157–162 [DOI] [PubMed] [Google Scholar]
- Cheever ML, Sato TK, de Beer T, Kutateladze TG, Emr SD, Overduin M (2001) Phox domain interaction with PtdIns(3)P targets the Vam7 t‐SNARE to vacuole membranes. Nat Cell Biol 3: 613–618 [DOI] [PubMed] [Google Scholar]
- Chen A, Leikina E, Melikov K, Podbilewicz B, Kozlov MM, Chernomordik LV (2008) Fusion‐pore expansion during syncytium formation is restricted by an actin network. J Cell Sci 121: 3619–3628 [DOI] [PMC free article] [PubMed] [Google Scholar]
- Chizmadzhev YA, Kumenko DA, Kuzmin PI, Chernomordik LV, Zimmerberg J, Cohen FS (1999) Lipid flow through fusion pores connecting membranes of different tensions. Biophys J 76: 2951–2965 [DOI] [PMC free article] [PubMed] [Google Scholar]
- Chizmadzhev YA, Kuzmin PI, Kumenko DA, Zimmerberg J, Cohen FS (2000) Dynamics of fusion pores connecting membranes of different tensions. Biophys J 78: 2241–2256 [DOI] [PMC free article] [PubMed] [Google Scholar]
- Coffman VC, Nile AH, Lee I‐J, Liu H, Wu J‐Q (2009) Roles of formin nodes and myosin motor activity in Mid1p‐dependent contractile‐ring assembly during fission yeast cytokinesis. Mol Biol Cell 20: 5195–5210 [DOI] [PMC free article] [PubMed] [Google Scholar]
- Cohen FS, Zimmerberg J, Finkelstein A (1980) Fusion of phospholipid vesicles with planar phospholipid bilayer membranes. II. Incorporation of a vesicular membrane marker into the planar membrane. J Gen Physiol 75: 251–270 [DOI] [PMC free article] [PubMed] [Google Scholar]
- Collins KM, Thorngren NL, Fratti RA, Wickner WT (2005) Sec17p and HOPS, in distinct SNARE complexes, mediate SNARE complex disruption or assembly for fusion. EMBO J 24: 1775–1786 [DOI] [PMC free article] [PubMed] [Google Scholar]
- Cowles CR, Odorizzi G, Payne GS, Emr SD (1997) The AP‐3 adaptor complex is essential for cargo‐selective transport to the yeast vacuole. Cell 91: 109–118 [DOI] [PubMed] [Google Scholar]
- Cyert MS, Philpott CC (2013) Regulation of cation balance in Saccharomyces cerevisiae . Genetics 193: 677–713 [DOI] [PMC free article] [PubMed] [Google Scholar]
- D'Agostino M, Risselada HJ, Mayer A (2016) Steric hindrance of SNARE transmembrane domain organization impairs the hemifusion‐to‐fusion transition. EMBO Rep 17: 1590–1608 [DOI] [PMC free article] [PubMed] [Google Scholar]
- D'Agostino M, Risselada HJ, Lürick A, Ungermann C, Mayer A (2017) A tethering complex drives the terminal stage of SNARE‐dependent membrane fusion. Nature 551: 634–638 [DOI] [PubMed] [Google Scholar]
- Darsow T, Rieder SE, Emr SD (1997) A multispecificity syntaxin homologue, Vam3p, essential for autophagic and biosynthetic protein transport to the vacuole. J Cell Biol 138: 517–529 [DOI] [PMC free article] [PubMed] [Google Scholar]
- Desfougères Y, Neumann H, Mayer A (2016a) Organelle size control ‐ increasing vacuole content activates SNAREs to augment organelle volume through homotypic fusion. J Cell Sci 129: 2817–2828 [DOI] [PubMed] [Google Scholar]
- Desfougères Y, Vavassori S, Rompf M, Gerasimaite R, Mayer A (2016b) Organelle acidification negatively regulates vacuole membrane fusion in vivo . Sci Rep 6: 29045 [DOI] [PMC free article] [PubMed] [Google Scholar]
- Fernández‐Busnadiego R, Zuber B, Maurer UE, Cyrklaff M, Baumeister W, Lucic V (2010) Quantitative analysis of the native presynaptic cytomatrix by cryoelectron tomography. J Cell Biol 188: 145–156 [DOI] [PMC free article] [PubMed] [Google Scholar]
- Fratti RA, Jun Y, Merz AJ, Margolis N, Wickner W (2004) Interdependent assembly of specific regulatory lipids and membrane fusion proteins into the vertex ring domain of docked vacuoles. J Cell Biol 167: 1087–1098 [DOI] [PMC free article] [PubMed] [Google Scholar]
- Gao Y, Zorman S, Gundersen G, Xi Z, Ma L, Sirinakis G, Rothman JE, Zhang Y (2012) Single reconstituted neuronal SNARE complexes zipper in three distinct stages. Science 337: 1340–1343 [DOI] [PMC free article] [PubMed] [Google Scholar]
- Gillooly DJ, Morrow IC, Lindsay M, Gould R, Bryant NJ, Gaullier JM, Parton RG, Stenmark H (2000) Localization of phosphatidylinositol 3‐phosphate in yeast and mammalian cells. EMBO J 19: 4577–4588 [DOI] [PMC free article] [PubMed] [Google Scholar]
- Grafmüller A, Shillcock J, Lipowsky R (2009) The fusion of membranes and vesicles: pathway and energy barriers from dissipative particle dynamics. Biophys J 96: 2658–2675 [DOI] [PMC free article] [PubMed] [Google Scholar]
- Hamill OP, Martinac B (2001) Molecular basis of mechanotransduction in living cells. Physiol Rev 81: 685–740 [DOI] [PubMed] [Google Scholar]
- Han X, Jackson MB (2005) Electrostatic Interactions between the syntaxin membrane anchor and neurotransmitter passing through the fusion pore. Biophys J 88: L20–L22 [DOI] [PMC free article] [PubMed] [Google Scholar]
- Hernandez JM, Stein A, Behrmann E, Riedel D, Cypionka A, Farsi Z, Walla PJ, Raunser S, Jahn R (2012) Membrane fusion intermediates via directional and full assembly of the SNARE complex. Science 336: 1581–1584 [DOI] [PMC free article] [PubMed] [Google Scholar]
- Hernandez JM, Kreutzberger AJB, Kiessling V, Tamm LK, Jahn R (2014) Variable cooperativity in SNARE‐mediated membrane fusion. Proc Natl Acad Sci USA 111: 12037–12042 [DOI] [PMC free article] [PubMed] [Google Scholar]
- Hess B, Kutzner C, van der Spoel D, Lindahl E (2008) GROMACS 4: algorithms for highly efficient, load‐balanced, and scalable molecular simulation. J Chem Theory Comput 4: 435–447 [DOI] [PubMed] [Google Scholar]
- Hickey CM, Wickner W (2010) HOPS initiates vacuole docking by tethering membranes before trans‐SNARE complex assembly. Mol Biol Cell 21: 2297–2305 [DOI] [PMC free article] [PubMed] [Google Scholar]
- Hishida M, Nomura Y, Akiyama R, Yamamura Y, Saito K (2017) Electrostatic double‐layer interaction between stacked charged bilayers. Phys Rev E 96: 633 [DOI] [PubMed] [Google Scholar]
- Ho R, Stroupe C (2015) The HOPS/class C Vps complex tethers membranes by binding to one Rab GTPase in each apposed membrane. Mol Biol Cell 26: 2655–2663 [DOI] [PMC free article] [PubMed] [Google Scholar]
- Imig C, Min S‐W, Krinner S, Arancillo M, Rosenmund C, Südhof TC, Rhee J, Brose N, Cooper BH (2014) The morphological and molecular nature of synaptic vesicle priming at presynaptic active zones. Neuron 84: 416–431 [DOI] [PubMed] [Google Scholar]
- Karunakaran S, Sasser T, Rajalekshmi S, Fratti RA (2012) SNAREs, HOPS, and regulatory lipids control the dynamics of vacuolar actin during homotypic fusion. J Cell Sci 125: 1683–1692 [DOI] [PubMed] [Google Scholar]
- Kozlov MM, McMahon HT, Chernomordik LV (2010) Protein‐driven membrane stresses in fusion and fission. Trends Biochem Sci 35: 699–706 [DOI] [PMC free article] [PubMed] [Google Scholar]
- Kozlov MM, Chernomordik LV (2015) Membrane tension and membrane fusion. Curr Opin Struct Biol 33: 61–67 [DOI] [PMC free article] [PubMed] [Google Scholar]
- Janke C, Magiera MM, Rathfelder N, Taxis C, Reber S, Maekawa H, Moreno‐Borchart A, Doenges G, Schwob E, Schiebel E, Knop M (2004) A versatile toolbox for PCR‐based tagging of yeast genes: new fluorescent proteins, more markers and promoter substitution cassettes. Yeast 21: 947–962 [DOI] [PubMed] [Google Scholar]
- LaGrassa TJ, Ungermann C (2005) The vacuolar kinase Yck3 maintains organelle fragmentation by regulating the HOPS tethering complex. J Cell Biol 168: 401–414 [DOI] [PMC free article] [PubMed] [Google Scholar]
- Lai Y, Diao J, Liu Y, Ishitsuka Y, Su Z, Schulten K, Ha T, Shin Y‐K (2013) Fusion pore formation and expansion induced by Ca2+ and synaptotagmin 1. Proc Natl Acad Sci USA 110: 1333–1338 [DOI] [PMC free article] [PubMed] [Google Scholar]
- Laporte D, Coffman VC, Lee I‐J, Wu J‐Q (2011) Assembly and architecture of precursor nodes during fission yeast cytokinesis. J Cell Biol 192: 1005–1021 [DOI] [PMC free article] [PubMed] [Google Scholar]
- Long R, Hui C‐Y, Jagota A, Bykhovskaia M (2012) Adhesion energy can regulate vesicle fusion and stabilize partially fused states. J R Soc Interface 9: 1555–1567 [DOI] [PMC free article] [PubMed] [Google Scholar]
- Longtine MS, McKenzie A, Demarini DJ, Shah NG, Wach A, Brachat A, Philippsen P, Pringle JR (1998) Additional modules for versatile and economical PCR‐based gene deletion and modification in Saccharomyces cerevisiae . Yeast 14: 953–961 [DOI] [PubMed] [Google Scholar]
- Lürick A, Gao J, Kuhlee A, Yavavli E, Langemeyer L, Perz A, Raunser S, Ungermann C (2017) Multivalent Rab interactions determine tether‐mediated membrane fusion. Mol Biol Cell 28: 322–332 [DOI] [PMC free article] [PubMed] [Google Scholar]
- Malde AK, Zuo L, Breeze M, Stroet M, Poger D, Nair PC, Oostenbrink C, Mark AE (2011) An Automated Force Field Topology Builder (ATB) and Repository: Version 1.0. J Chem Theory Comput 7: 4026–4037 [DOI] [PubMed] [Google Scholar]
- Marrink SJ, Risselada HJ, Yefimov S, Tieleman DP, de Vries AH (2007) The MARTINI force field: coarse grained model for biomolecular simulations. J Phys Chem B 111: 7812–7824 [DOI] [PubMed] [Google Scholar]
- Mattie S, McNally EK, Karim MA, Vali H, Brett CL (2017) How and why intralumenal membrane fragments form during vacuolar lysosome fusion. Mol Biol Cell 28: 309–321 [DOI] [PMC free article] [PubMed] [Google Scholar]
- Mayer A, Wickner W, Haas A (1996) Sec18p (NSF)‐driven release of Sec17p (alpha‐SNAP) can precede docking and fusion of yeast vacuoles. Cell 85: 83–94 [DOI] [PubMed] [Google Scholar]
- Mayer A, Wickner W (1997) Docking of yeast vacuoles is catalyzed by the Ras‐like GTPase Ypt7p after symmetric priming by Sec18p (NSF). J Cell Biol 136: 307–317 [DOI] [PMC free article] [PubMed] [Google Scholar]
- Mazhab‐Jafari MT, Rohou A, Schmidt C, Bueler SA, Benlekbir S, Robinson CV, Rubinstein JL (2016) Atomic model for the membrane‐embedded VO motor of a eukaryotic V‐ATPase. Nature 539: 118–122 [DOI] [PMC free article] [PubMed] [Google Scholar]
- McNally EK, Karim MA, Brett CL (2017) Selective lysosomal transporter degradation by organelle membrane fusion. Dev Cell 40: 151–167 [DOI] [PubMed] [Google Scholar]
- Michaillat L, Baars TL, Mayer A (2012) Cell‐free reconstitution of vacuole membrane fragmentation reveals regulation of vacuole size and number by TORC1. Mol Biol Cell 23: 881–895 [DOI] [PMC free article] [PubMed] [Google Scholar]
- Michaillat L, Mayer A (2013) Identification of genes affecting vacuole membrane fragmentation in Saccharomyces cerevisiae . PLoS ONE 8: e54160 [DOI] [PMC free article] [PubMed] [Google Scholar]
- Monticelli L, Kandasamy SK, Periole X, Larson RG, Tieleman DP, Marrink S‐J (2008) The MARTINI coarse‐grained force field: extension to proteins. J Chem Theory Comput 4: 819–834 [DOI] [PubMed] [Google Scholar]
- Nikolaus J, Stöckl M, Langosch D, Volkmer R, Herrmann A (2010) Direct visualization of large and protein‐free hemifusion diaphragms. Biophys J 98: 1192–1199 [DOI] [PMC free article] [PubMed] [Google Scholar]
- Orr A, Wickner W, Rusin SF, Kettenbach AN, Zick M (2015) Yeast vacuolar HOPS, regulated by its kinase, exploits affinities for acidic lipids and Rab:GTP for membrane binding and to catalyze tethering and fusion. Mol Biol Cell 26: 305–315 [DOI] [PMC free article] [PubMed] [Google Scholar]
- Peters C, Bayer MJ, Bühler S, Andersen JS, Mann M, Mayer A (2001) Trans‐complex formation by proteolipid channels in the terminal phase of membrane fusion. Nature 409: 581–588 [DOI] [PubMed] [Google Scholar]
- Peters C, Baars TL, Buhler S, Mayer A (2004) Mutual control of membrane fission and fusion proteins. Cell 119: 667–678 [DOI] [PubMed] [Google Scholar]
- Pieren M, Schmidt A, Mayer A (2010) The SM protein Vps33 and the t‐SNARE H(abc) domain promote fusion pore opening. Nat Struct Mol Biol 17: 710–717 [DOI] [PubMed] [Google Scholar]
- Pieren M, Desfougères Y, Michaillat L, Schmidt A, Mayer A (2015) Vacuolar SNARE protein transmembrane domains serve as nonspecific membrane anchors with unequal roles in lipid mixing. J Biol Chem 290: 12821–12832 [DOI] [PMC free article] [PubMed] [Google Scholar]
- Price A, Seals D, Wickner W, Ungermann C (2000) The docking stage of yeast vacuole fusion requires the transfer of proteins from a cis‐SNARE complex to a Rab/Ypt protein. J Cell Biol 148: 1231–1238 [DOI] [PMC free article] [PubMed] [Google Scholar]
- Reese C, Mayer A (2005) Transition from hemifusion to pore opening is rate limiting for vacuole membrane fusion. J Cell Biol 171: 981–990 [DOI] [PMC free article] [PubMed] [Google Scholar]
- Reese C, Heise F, Mayer A (2005) Trans‐SNARE pairing can precede a hemifusion intermediate in intracellular membrane fusion. Nature 436: 410–414 [DOI] [PubMed] [Google Scholar]
- Risselada HJ, Smirnova Y, Grubmüller H (2014) Free energy landscape of rim‐pore expansion in membrane fusion. Biophys J 107: 2287–2295 [DOI] [PMC free article] [PubMed] [Google Scholar]
- Rizo J, Südhof TC (2012) The membrane fusion enigma: SNAREs, Sec1/Munc18 proteins, and their accomplices‐guilty as charged? Annu Rev Cell Dev Biol 28: 279–308 [DOI] [PubMed] [Google Scholar]
- Rousso T, Schejter ED, Shilo B‐Z (2016) Orchestrated content release from Drosophila glue‐protein vesicles by a contractile actomyosin network. Nat Cell Biol 18: 181–190 [DOI] [PubMed] [Google Scholar]
- Ryham RJ, Ward MA, Cohen FS (2013) Teardrop shapes minimize bending energy of fusion pores connecting planar bilayers. Phys Rev E 88: 693 [DOI] [PMC free article] [PubMed] [Google Scholar]
- Ryham RJ, Klotz TS, Yao L, Cohen FS (2016) Calculating transition energy barriers and characterizing activation states for steps of fusion. Biophys J 110: 1110–1124 [DOI] [PMC free article] [PubMed] [Google Scholar]
- Shi L, Shen Q‐T, Kiel A, Wang J, Wang H‐W, Melia TJ, Rothman JE, Pincet F (2012) SNARE proteins: one to fuse and three to keep the nascent fusion pore open. Science 335: 1355–1359 [DOI] [PMC free article] [PubMed] [Google Scholar]
- Shin W, Ge L, Arpino G, Villarreal SA, Hamid E, Liu H, Zhao W‐D, Wen PJ, Chiang H‐C, Wu L‐G (2018) Visualization of membrane pore in live cells reveals a dynamic‐pore theory governing fusion and endocytosis. Cell 173: 934–945.e12 [DOI] [PMC free article] [PubMed] [Google Scholar]
- Smirnov MN, Smirnov VN, Budowsky EI, Inge‐Vechtomov SG, Serebrjakov NG (1967) Red pigment of adenine‐deficient yeast Saccharomyces cerevisiae . Biochem Biophys Res Commun 27: 299–304 [DOI] [PubMed] [Google Scholar]
- Smirnova YG, Aeffner S, Risselada HJ, Salditt T, Marrink SJ, Muller M, Knecht V (2013) Interbilayer repulsion forces between tension‐free lipid bilayers from simulation. Soft Matter 9: 10705–10718 [Google Scholar]
- Stein A, Weber G, Wahl MC, Jahn R (2009) Helical extension of the neuronal SNARE complex into the membrane. Nature 460: 525–528 [DOI] [PMC free article] [PubMed] [Google Scholar]
- Strasser B, Iwaszkiewicz J, Michielin O, Mayer A (2011) The V‐ATPase proteolipid cylinder promotes the lipid‐mixing stage of SNARE‐dependent fusion of yeast vacuoles. EMBO J 30: 4126–4141 [DOI] [PMC free article] [PubMed] [Google Scholar]
- Su Z, Zhou X, Loukin SH, Saimi Y, Kung C (2009) Mechanical force and cytoplasmic Ca(2+) activate yeast TRPY1 in parallel. J Membr Biol 227: 141–150 [DOI] [PubMed] [Google Scholar]
- Sukharev S, Sachs F (2012) Molecular force transduction by ion channels: diversity and unifying principles. J Cell Sci 125: 3075–3083 [DOI] [PMC free article] [PubMed] [Google Scholar]
- Tran DT, Masedunskas A, Weigert R, Ten Hagen KG (2015) Arp2/3‐mediated F‐actin formation controls regulated exocytosis in vivo . Nat Commun 6: 10098 [DOI] [PMC free article] [PubMed] [Google Scholar]
- Tse FW, Iwata A, Almers W (1993) Membrane flux through the pore formed by a fusogenic viral envelope protein during cell fusion. J Cell Biol 121: 543–552 [DOI] [PMC free article] [PubMed] [Google Scholar]
- Ungermann C, Nichols BJ, Pelham HR, Wickner W (1998) A vacuolar v‐t‐SNARE complex, the predominant form in vivo and on isolated vacuoles, is disassembled and activated for docking and fusion. J Cell Biol 140: 61–69 [DOI] [PMC free article] [PubMed] [Google Scholar]
- Vida TA, Emr SD (1995) A new vital stain for visualizing vacuolar membrane dynamics and endocytosis in yeast. J Cell Biol 128: 779–792 [DOI] [PMC free article] [PubMed] [Google Scholar]
- Wada Y, Ohsumi Y, Kawai E, Ohsumi M (1996) Mutational analysis of Vam4/Ypt7p function in the vacuolar biogenesis and morphogenesis in the yeast, Saccharomyces cerevisiae . Protoplasma 191: 126–135 [Google Scholar]
- Wang L, Seeley ES, Wickner W, Merz AJ (2002) Vacuole fusion at a ring of vertex docking sites leaves membrane fragments within the organelle. Cell 108: 357–369 [DOI] [PubMed] [Google Scholar]
- Wang L, Merz AJ, Collins KM, Wickner W (2003) Hierarchy of protein assembly at the vertex ring domain for yeast vacuole docking and fusion. J Cell Biol 160: 365–374 [DOI] [PMC free article] [PubMed] [Google Scholar]
- Weisman LS, Bacallao R, Wickner W (1987) Multiple methods of visualizing the yeast vacuole permit evaluation of its morphology and inheritance during the cell cycle. J Cell Biol 105: 1539–1547 [DOI] [PMC free article] [PubMed] [Google Scholar]
- Weisman LS (2003) Yeast vacuole inheritance and dynamics. Annu Rev Genet 37: 435–460 [DOI] [PubMed] [Google Scholar]
- West A, Ma K, Chung JL, Kindt JT (2013) Simulation studies of structure and edge tension of lipid bilayer edges: effects of tail structure and force‐field. J Phys Chem A 117: 7114–7123 [DOI] [PubMed] [Google Scholar]
- Wu Z, Bello OD, Thiyagarajan S, Auclair SM, Vennekate W, Krishnakumar SS, O'Shaughnessy B, Karatekin E (2017) Dilation of fusion pores by crowding of SNARE proteins. Elife 6: e22964 [DOI] [PMC free article] [PubMed] [Google Scholar]
- Zhang Y (2017) Energetics, kinetics, and pathway of SNARE folding and assembly revealed by optical tweezers. Protein Sci 26: 1252–1265 [DOI] [PMC free article] [PubMed] [Google Scholar]
- Zhao W‐D, Hamid E, Shin W, Wen PJ, Krystofiak ES, Villarreal SA, Chiang H‐C, Kachar B, Wu L‐G (2016) Hemi‐fused structure mediates and controls fusion and fission in live cells. Nature 534: 548–552 [DOI] [PMC free article] [PubMed] [Google Scholar]
- Zhou X‐L, Batiza AF, Loukin SH, Palmer CP, Kung C, Saimi Y (2003) The transient receptor potential channel on the yeast vacuole is mechanosensitive. Proc Natl Acad Sci USA 100: 7105–7110 [DOI] [PMC free article] [PubMed] [Google Scholar]
- Zick M, Wickner WT (2014) A distinct tethering step is vital for vacuole membrane fusion. Elife 3: e03251 [DOI] [PMC free article] [PubMed] [Google Scholar]
- Zick M, Stroupe C, Orr A, Douville D, Wickner WT (2014) Membranes linked by trans‐SNARE complexes require lipids prone to non‐bilayer structure for progression to fusion. Elife 3: e01879 [DOI] [PMC free article] [PubMed] [Google Scholar]
- Zieger M, Mayer A (2012) Yeast vacuoles fragment in an asymmetrical two‐phase process with distinct protein requirements. Mol Biol Cell 23: 3438–3449 [DOI] [PMC free article] [PubMed] [Google Scholar]
- Zimmerberg J, Blumenthal R, Sarkar DP, Curran M, Morris SJ (1994) Restricted movement of lipid and aqueous dyes through pores formed by influenza hemagglutinin during cell fusion. J Cell Biol 127: 1885–1894 [DOI] [PMC free article] [PubMed] [Google Scholar]
Associated Data
This section collects any data citations, data availability statements, or supplementary materials included in this article.
Supplementary Materials
Expanded View Figures PDF
Movie EV1
Source Data for Expanded View
Review Process File
Source Data Figure 1
Source Data Figure 2
Source Data Figure 3
Source Data Figure 4
Source Data Figure 5
Source Data Figure 7