

Abstract
Spinocerebellar ataxia type 8 (SCA8) is caused by a bidirectionally transcribed CTG·CAG expansion that results in the in vivo accumulation of CUG RNA foci, an ATG‐initiated polyGln and a polyAla protein expressed by repeat‐associated non‐ATG (RAN) translation. Although RAN proteins have been reported in a growing number of diseases, the mechanisms and role of RAN translation in disease are poorly understood. We report a novel toxic SCA8 polySer protein which accumulates in white matter (WM) regions as aggregates that increase with age and disease severity. WM regions with polySer aggregates show demyelination and axonal degeneration in SCA8 human and mouse brains. Additionally, knockdown of the eukaryotic translation initiation factor eIF3F in cells reduces steady‐state levels of SCA8 polySer and other RAN proteins. Taken together, these data show polySer and WM abnormalities contribute to SCA8 and identify eIF3F as a novel modulator of RAN protein accumulation.
Keywords: eIF3F, polyserine, RAN translation, spinocerebellar ataxia type 8 (SCA8), white matter
Subject Categories: Molecular Biology of Disease, Neuroscience
Introduction
Spinocerebellar ataxia type 8 (SCA8) is a dominantly inherited neurodegenerative disease caused by a CTG·CAG microsatellite expansion mutation (Koob et al, 1999; Moseley et al, 2006). SCA8 most frequently presents as an adult‐onset disease characterized by limb and gait ataxia, dysarthria, and nystagmus (Day et al, 2000; Zeman et al, 2004), but infantile‐ and juvenile‐onset cases and cases with cognitive and psychiatric symptoms have also been reported (Felling & Barron, 2005; Lilja et al, 2005). The SCA8 mutation is bidirectionally expressed producing both CAG (ATXN8) and CUG (ATXN8OS) expansion transcripts (Moseley et al, 2006). Both transcripts are thought to contribute to disease by RNA and protein gain‐of‐function (GOF) mechanisms. CUG expansion transcripts form RNA foci that sequester MBNL proteins leading to RNA GOF effects (Daughters et al, 2009). In addition, SCA8 CAG expansion transcripts have been shown to result in the expression and accumulation of an ATG‐initiated polyglutamine expansion protein and a repeat‐associated non‐ATG (RAN) polyalanine expansion protein in brains of SCA8 BAC mice and SCA8 autopsy tissue (Moseley et al, 2006; Zu et al, 2011).
RAN translation has been shown to occur in seven different repeat expansion diseases (SCA8, SCA31, DM1, DM2, HD, FXTAS, and ALS/FTD; Zu et al, 2011, 2013, 2017; Ash et al, 2013; Mori et al, 2013; Todd et al, 2013; Bañez‐Coronel et al, 2015; Ishiguro et al, 2017). While the demonstration that sense and antisense RAN proteins accumulate in a growing number of diseases suggests they contribute to these disorders, the pathogenic consequences of RAN proteins are not yet clear. Understanding the common themes of RAN translation across multiple disorders will provide insight into the molecular mechanisms of these disorders.
Here, we report a novel toxic SCA8 RAN polySer protein that accumulates in SCA8 patient autopsy tissue and SCA8 BAC transgenic mice. This SCA8 RAN polySer protein accumulates in white matter regions that show demyelination and axonal degeneration. The preferential white matter distribution of the SCA8 RAN polySer protein and elevated expression of eIF3F in white matter regions led to the identification of eIF3F as a mammalian translation initiation factor able to regulate RAN protein levels in vitro. In summary, these data suggest a model in which a novel RAN polySer protein causes white matter abnormalities that contribute to SCA8 and demonstrate that RAN protein levels can be modulated independent of AUG‐initiated proteins.
Results
ATXN8 transcript is expressed at a higher level than ATXN8OS in SCA8 mice cerebellum
To explore the relative contribution of the ATXN8 and ATXN8OS transcripts in SCA8, we measured the relative abundance of these transcripts in cerebellum from SCA8 BAC transgenic mice. SCA8 mice express the full‐length human ATXN8 and ATXN8OS genes from a BAC transgene that includes flanking regions to allow for the endogenous spatiotemporal expression patterns of the transgenes (Moseley et al, 2006). RNA sequencing reads of ATXN8 and ATXN8OS transcripts were mapped back to a region of the human reference genome containing ATXN8 and ATXN8OS plus 10 kb of upstream and downstream flanking sequence. ATXN8OS expression was calculated based on the number of reads that map to exons B, C, and D which do not overlap the ATXN8 sequence. Reads in the last intron of ATXN8OS which overlaps ATXN8 were used to differentiate the two transcripts and to calculate the relative levels of ATXN8 (Fig 1A). These data show that ATXN8 transcripts are expressed ~7.5‐fold higher than ATXN8OS transcripts in SCA8 mouse cerebellum (P < 0.0001; Fig 1B).
Figure 1. Novel polySer RAN protein encoded by the higher expressing ATXN8 transcript in SCA8.
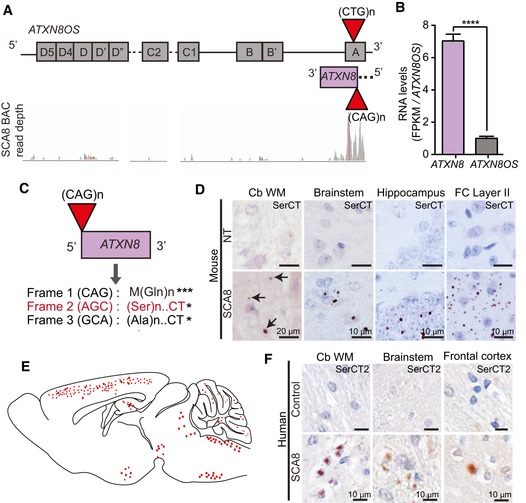
- Schematic diagram of ATXN8OS (top strand) and ATXN8 (bottom strand). RNA‐Seq read coverage visualized by Integrative Genomic Viewer across the ATXN8/ATXN8OS locus is depicted.
- Bar graph showing relative mRNA levels of ATXN8 and ATXN8OS. FPKM values for each transcript are normalized to FPKM value for ATXN8OS. (****P < 0.0001; mean ± SEM; unpaired t‐test) FPKM, fragments per kilo base of transcript per million mapped reads.
- Known and predicted homopolymeric protein expressed across SCA8 CAG expansion (ATXN8) transcripts. * Represent stop codons.
- Immunohistochemistry of 10‐ to 12‐month‐old end‐stage SCA8 BAC mice brain tissue shows accumulation of novel polySer RAN protein (detected by unique antibody to the polySer protein C terminus, α‐SerCT) in cerebellar white matter, brainstem, hippocampus, and layer II of the frontal cortex. Representative polySer aggregates are indicated by black arrows. No aggregates are found in age‐matched non‐transgenic (NT) littermates (n = 6 for each cohort).
- Schematic of a sagittal section of mouse brain shows the distribution of polySer RAN protein in SCA8 BAC expansion mice. Red circles represent variable size and frequency of polySer aggregates throughout different brain regions.
- Immunohistochemistry of human SCA8 autopsy tissue (n = 4–7) shows accumulation of novel polySer RAN protein in cerebellar white matter, brainstem, and frontal cortex.
Novel polySer RAN proteins accumulate in SCA8 human and mouse brain
Because ATXN8 transcripts are expressed at higher levels than ATXN8OS, and at levels sufficient for the accumulation of AUG‐initiated polyGln (M‐polyGln; Moseley et al, 2006) and RAN polyAla expansion proteins (Zu et al, 2011), we developed antibodies to test the hypothesis that RAN polySer proteins accumulate in SCA8 and contribute to disease. RAN translation of the ATXN8 expansion in the AGC frame is predicted to produce a polySer RAN protein followed by a unique 42 amino acid C‐terminal region (Figs 1C and EV1A). We generated two rabbit polyclonal antibodies, α‐SerCT and α‐SerCT2, directed at different non‐overlapping peptide sequences within the unique C‐terminal region downstream of the predicted SCA8 polySer protein (Fig EV1A). The specificity of the antibodies was validated by immunofluorescence (IF) and protein blots of transfected cells expressing epitope‐tagged polySer with the predicted C‐terminal sequence (Fig EV1B and C).
Figure EV1. Validation of rabbit polyclonal α‐SerCT and α‐SerCT2 antibodies.
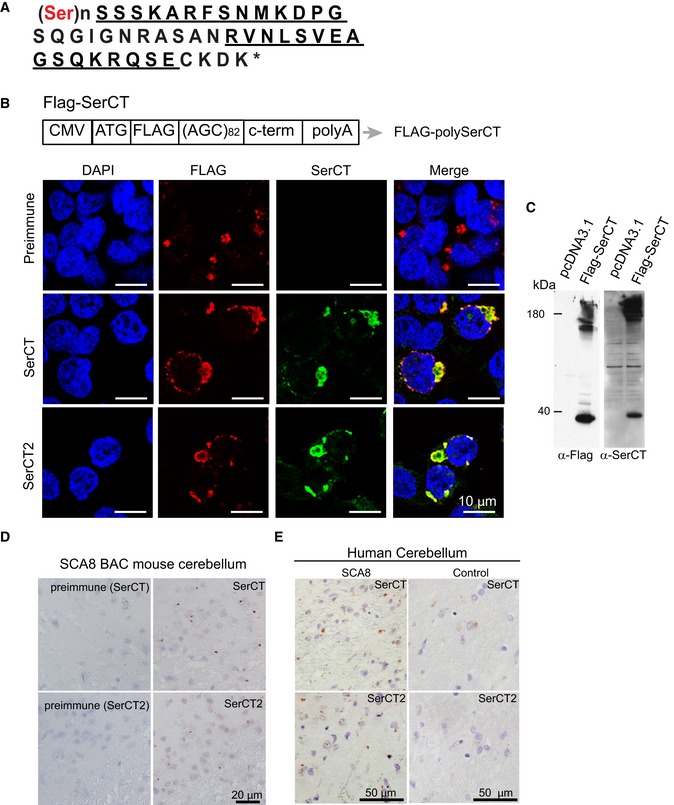
- Amino acid sequence of predicted polySer RAN protein with the unique C terminus. Peptide sequences used to generate rabbit polyclonal antibodies are underlined.
- Schematic diagram of FLAG‐SerCT construct expressing an ATG‐initiated N‐terminal FLAG‐tagged polySer expansion protein followed by its endogenous C‐terminal sequence. Co‐localization of immunofluorescence (IF) staining using α‐FLAG (red) and α‐SerCT and α‐SerCT2 (green) in HEK293T cells transfected with FLAG‐SerCT but not preimmune serum.
- Immunoblots showing detection of recombinant polySer protein using α‐FLAG (left) and α‐SerCT (right) in the lysates of HEK293T cells transfected with FLAG‐SerCT (second lanes) but not pcDNA3.1 (first lanes).
- Immunochemistry of SCA8 mouse brain using α‐SerCT and α‐SerCT2 (left panels) antibodies shows similar punctate aggregates. Aggregates are not detected with respective preimmune sera (right panels).
- Immunochemistry using both α‐SerCT and α‐SerCT2 detect similar aggregates in SCA8 human autopsy tissue but not control cerebellum.
Source data are available online for this figure.
Next, we tested whether the predicted polySer RAN proteins could be detected in vivo by immunohistochemistry (IHC). We found robust positive staining in both SCA8 mouse and human autopsy tissue. Although both α‐SerCT antibodies showed similar punctate staining, α‐SerCT was used for IHC analyses of SCA8 BAC mouse tissue as it showed less background reactivity. In SCA8 BAC mice, we detected widespread punctate aggregates of variable size in brain regions primarily affected in the disease, including the cerebellum and brainstem (Fig 1D). In addition to hindbrain regions, robust protein accumulation is found throughout layers II and III of the cerebral cortex, the dentate gyrus, and CA regions of the hippocampus and the midbrain (e.g., Fig 1D and E). Aggregates can show perinuclear localization or punctate staining throughout the brain regions. No similar staining is found in age‐matched non‐transgenic (NT) control animals (Fig 1D and E) or in SCA8 animals with preimmune serum (Fig EV1D).
Both antibodies were also able to detect polySer aggregates in patient autopsy tissue. However, because α‐SerCT2 showed less non‐specific reactivity in human tissue, α‐SerCT2 was used for subsequent IHC on human tissue (Fig EV1E). Examination of seven SCA8 human autopsy cases shows similar aggregates in the cerebellum, brainstem, and cortex but not in unaffected or disease controls (Fig 1F, Table 1).
Table 1.
Summary of polySer staining in SCA8 and control autopsy tissue
| Case | Age | Sex | SCA8 Repeat | PMI | Cerebellum | Brainstem | Frontal Cortex | |
|---|---|---|---|---|---|---|---|---|
| SCA8 | 1 | 80 | F | 104 | 28 | +++ | ++ | + |
| 2 | 74 | F | 109 | 11.5 | +++ | + | + | |
| 3 | 85 | F | 91 | 8 | ++ | + | n.d | |
| 4 | 76 | M | 197 | 4.5 | + | n.d | + | |
| 5 | 83 | M | 7 | +++ | ++ | − | ||
| 6 | 59 | F | 790 | +++ | n.d | + | ||
| 7 | 60 | F | 105 | 10 | +++ | n.d | n.d | |
| CTRL | 1 | n.d | n.d | − | ||||
| 2 | n.d | n.d | − | |||||
| 3 | 40 | M | 6 | − | − | − | ||
| 4 | 45 | F | 20 | − | − | n.d | ||
| HD | 1 | 46 | F | 7 | − | − | ||
| HDL2 | 1 | 41 | F | 3 | − | − | − | |
| SCA2 | 1 | 56 | F | 3.5 | − | n.d | n.d | |
| SCA5 | 1 | M | − | − | n.d | |||
| SCA7 | 1 | 59 | F | 22 | − | n.d | n.d | |
| DM1 | 1 | 68 | F | − | − | − |
RAN staining: −, negative; +, low‐intensity staining; ++, moderate intensity; +++, frequent and intense; ++++, highly frequent positive cells with high‐intensity staining. SCA8, spinocerebellar ataxia type 8; CTRL, control; HD, Huntington disease; HDL2, Huntington disease like‐2; SCA2, spinocerebellar ataxia type 2; SCA5, spinocerebellar ataxia type 5; SCA7, spinocerebellar ataxia type 7; DM1, myotonic dystrophy type 1; n.d, not determined; M, male; F, female; PMI, post‐mortem interval.
Taken together, these data demonstrate that ATXN8 transcripts express a novel homopolymeric polySer RAN protein which accumulates as aggregates in multiple brain regions in SCA8 mice and human autopsy tissue.
RAN PolySer and M‐polyGln proteins show distinct patterns of accumulation
To better understand SCA8 pathology, we compared the distribution of the polySer RAN protein with the previously characterized AUG‐initiated M‐polyGln expansion protein. Although both proteins are expressed from ATXN8 transcripts, their distribution patterns in the cerebellum are strikingly different. IHC performed on serial cerebellar sections shows polyGln, but not RAN polySer aggregates accumulate in Purkinje cell nuclei. In contrast, we detected polySer but not polyGln aggregates in the molecular layer and oligodendrocyte‐rich subcortical and deep cerebellar white matter regions (Fig 2A). In the cortex, hippocampus, and brainstem, polyGln and polySer aggregates are often found in close proximity; however, they are detected as discrete aggregates. Double‐labeling of polyGln and RAN polySer by IF shows no overlap in signal in the frontal cortex, brainstem (pons), or hippocampus. These data suggest that polySer and polyGln aggregates are found in different cells or different cellular compartments in these brain regions. PolyGln staining in these regions is primarily nuclear. In contrast, polySer aggregates show a perinuclear localization (Fig 2B). Double‐labeling experiments show polyGln inclusions are primarily found in NeuN‐positive neurons, while the majority of polySer aggregates do not co‐localize with NeuN‐positive neurons (Fig 2C). To further clarify the cellular localization of RAN polySer, we performed double‐labeling IF of polySer and CNPase, a marker of oligodendrocytes, and show that polySer aggregates located in the white matter are close to or within oligodendrocytes/myelinated axons (Fig EV2). Similarly, in humans SCA8 polySer and polyGln proteins accumulate in distinct cerebellar regions, with polySer found primarily in the deep cerebellar white matter and polyGln in Purkinje cell nuclei (Fig 2D). Despite this, there are some differences in the appearance of polySer in human post‐mortem tissue and SCA8 BAC mouse brain. These differences may be due to the end stage of disease in the human cases and to differences in tissue handling and processing including post‐mortem delay and the severity of disease at endpoint in human cases.
Figure 2. Distribution differences of polySer and polyGln proteins in SCA8 BAC mouse and human autopsy brains.
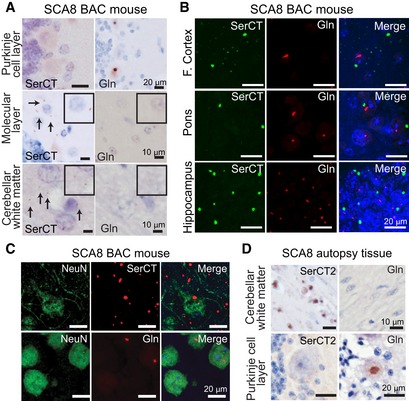
- Immunohistochemistry (IHC) of end‐stage SCA8 BAC mouse cerebellum shows that polySer but not polyGln is found in the molecular layer and cerebellar white matter and that polyGln but not polySer accumulates in Purkinje cells. Representative polySer aggregates are indicated by black arrows. Inset: higher magnification of molecular layer and white matter.
- IF double staining shows no co‐localization of polyGln and polySer in frontal cortex, pons, or hippocampus of end‐stage SCA8 BAC mice.
- IF double staining of end‐stage SCA8 BAC frontal cortex shows exclusive localization of polyGln (mouse α‐Gln, red, bottom panel) in neurons (rabbit α‐NeuN, green, bottom panel). In contrast, polySer (Rabbit α‐SerCT, red, top panel) shows widespread accumulation in the frontal cortex including within neurons (mouse α‐NeuN, green, top panel).
- IHC of SCA8 human cerebellum shows that polySer accumulates in the white matter but not in the Purkinje cells (left panels), while polyGln accumulates in Purkinje cells but not cerebellar white matter (right panels).
Figure EV2. PolySer aggregates show perinuclear localization in CNPase positive regions.
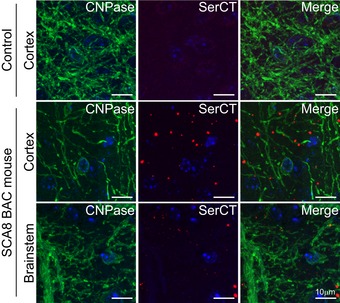
Immunofluorescence of CNPase, polySer (SerCT), and DAPI in non‐transgenic (top) and SCA8 BAC cortex (middle), along with SCA8 BAC brainstem (bottom).
In summary, SCA8 polySer and polyGln proteins, which are expressed from alternative reading frames of the ATXN8 transcripts, show strikingly distinct patterns of accumulation. These data suggest cell‐specific factors that affect reading frame selection or protein turnover may lead to differences in the regional and cellular accumulation patterns of these proteins.
SCA8 polySer aggregates increase with age and disease progression
The SCA8 BAC mice begin to show severe neurological phenotypes at 4 months of age including marked rotarod deficits and hindlimb stiffness. These phenotypes progressively worsen to include inactivity, generalized wasting, kyphosis, priapism resulting in premature death at ~6 months of age (Moseley et al, 2006). To better model the late stages of SCA8 in our mice, we provided supportive care, including an accessible gel‐diet and water source. These simple changes substantially extended the life span of the mice to ~10–12 months of age.
We performed IHC at different ages to address how polySer RAN protein aggregates change over time and disease progression (Fig 3A). To do this, we identified regions that showed polySer aggregates at 2 months of age and quantified the number of polySer aggregates in these regions at 2, 6, and 10 months of age. At 2 months, when SCA8 animals show no overt cage behavior phenotypes, IHC showed very small, pin‐like polySer aggregates that were found infrequently in brainstem regions including the vestibular nuclei and cuneate nuclei but not detectable in the cerebellum or hippocampus. At 6 months of age, when marked phenotypes are apparent and would be fatal without supportive care, the size and the number of polySer RAN aggregates in the brainstem substantially increase and small aggregates are now apparent throughout the frontal cortex. At ~10 months of age, when animals show advanced end‐stage disease, polySer aggregates were larger in size and more abundant in both the brainstem and frontal cortex. Quantification of polySer aggregates in the motor cortex and brainstem (vestibular nucleus and cuneate nucleus) showed an increase in aggregates from 2–10 and 6–10 months of age (Fig 3A).
Figure 3. PolySer accumulation increases with age and severity of disease.
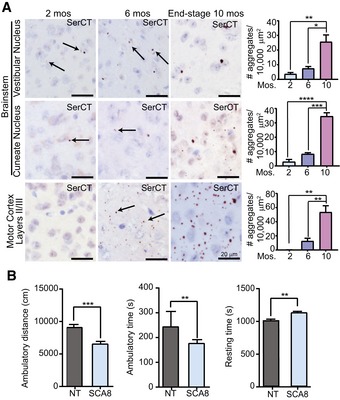
- Representative images of the vestibular nucleus (upper panels), cuneate nucleus (middle panels), and motor cortex layers II/III (lower panels) of SCA8 BAC mice at 2 months (left panels), 6 months (middle panels), and end‐stage (10 months, right panels) stained with α‐SerCT. Representative aggregates are indicated by black arrows. Corresponding quantifications of polySer aggregates for each region on the right (n = 3; mean ± SEM; one‐way ANOVA with Tukey's post hoc test; *P < 0.025, **P < 0.005, ***P < 0.0005, ****P < 0.0001)
- Open field analysis of 2‐month‐old animals shows a significant decrease in ambulatory distance (cm) and ambulatory time (s) and a significant increase in resting time (s) (NT n = 19, SCA8 BAC n = 23, **P < 0.01, ***P < 0.001; mean ± SEM; unpaired t‐test).
Although there were no overt cage behavior abnormalities at 2 months of age, small punctate polySer aggregates were detected in the vestibular and cuneate nuclei of the brainstem. Because these nuclei are associated with proprioception and gait, we examined 2‐month‐old SCA8 mice for early signs of disease using open field and DigiGait tests. Open field analysis showed decreased ambulatory distance and time and increased resting time in 2‐month SCA8 mice compared to age‐matched NT controls (Fig 3B). Additionally, SCA8 animals showed significant differences in 13 DigiGait parameters including abnormal gait symmetry and decreased propulsion time (Table 2). Although motor abnormalities can be associated with muscle pathology, previous reports did not detect expression of ATXN8 or ATXN8OS transcripts in muscle of SCA8 BAC mice (Moseley et al, 2006), suggesting that these phenotypes are due to CNS features of the disease.
Table 2.
Gait parameters from DigiGait in SCA8 BAC (forelimb only unless noted) are indicated along with corresponding P‐value
| Parameters (38 in total) | Units | NT Average ± SEM | SCA8 Average ± SEM | NT vs. SCA8 difference | SCA8 BAC Tg vs. NT |
|---|---|---|---|---|---|
| # Parameters P ≤ 0.05 | 13 | ||||
| # Parameters P < 0.01 | 3 | ||||
| # Parameters P ≤ 0.05 in forelimb & hindlimb | 2 | ||||
| Swing | (s) | 0.086 ± 0.002 | 0.083 ± 0.001 | −0.00 | ns |
| Swing/Stride | (%) | 36.227 ± 0.392 | 36.650 ± 0.370 | +0.42 | ns |
| Brake | (s) | 0.058 ± 0.002 | 0.050 ± 0.002 | +0.00 | ns |
| Brake/Stride | (%) | 24.415 ± 0.600 | 26.366 ± 0.720 | +1.95 | ↑* |
| Propel | (s) | 0.093 ± 0.002 | 0.083 ± 0.002 | −0.01 | ↓*** Fore; * Hind |
| Propel/Stride | (%) | 39.346 ± 0.703 | 36.984 ± 0.750 | −2.36 | ↓* |
| Stance | (s) | 0.151 ± 0.002 | 0.143 ± 0.002 | −0.01 | ↓* |
| Stance/Stride | (%) | 63.773 ± 0.392 | 63.350 ± 0.370 | −0.42 | ns |
| Stride | (s) | 0.237 ± 0.004 | 0.225 ± 0.003 | −0.01 | ↓* |
| Brake/Stance | (%) | 38.323 ± 0.948 | 41.631 ± 1.120 | +3.31 | ↑* |
| Propel/Stance | (%) | 61.677 ± 0.948 | 58.369 ± 1.120 | −3.31 | ↓* |
| Stance/Swing | (real#) | 1.773 ± 0.030 | 1.734 ± 0.027 | −0.04 | ns |
| Stride Length | (cm) | 5.200 ± 0.084 | 4.956 ± 0.068 | −0.24 | ↓* |
| Stride Frequency | (steps/s) | 4.346 ± 0.073 | 4.578 ± 0.068 | +0.23 | ↑* |
| Paw Angle | (deg) | 0.758 ± 1.878 | −0.156 ± 1.626 | −0.91 | ns |
| Absolute Paw Angle | (deg) | 8.950 ± 0.684 | 8.700 ± 0.527 | −0.25 | ns |
| Paw Angle Variability | (deg) | 4.715 ± 0.307 | 5.381 ± 0.202 | +0.67 | ns |
| Stance Width | (cm) | 1.308 ± 0.040 | 1.394 ± 0.038 | +0.09 | ns |
| Step Angle | (deg) | 63.231 ± 1.635 | 60.081 ± 2.653 | −3.15 | ns |
| Stride Length Variability | (cm) | 1.011 ± 0.043 | 1.147 ± 0.048 | +0.14 | ↑* |
| Stance Width Variability | (cm) | 0.442 ± 0.027 | 0.510 ± 0.036 | +0.07 | ns |
| Step Angle Variability | (deg) | 17.796 ± 1.393 | 19.978 ± 1.776 | +2.18 | ns |
| # Steps | (real #) | 20.154 ± 0.710 | 21.750 ± 0.980 | +1.60 | ns |
| Stride Length CV | (CV %) | 19.522 ± 0.894 | 23.311 ± 1.081 | +3.79 | ↑** |
| Stance Width CV | (CV %) | 33.938 ± 2.440 | 36.279 ± 2.295 | +2.34 | ns |
| Step Angle CV | (CV %) | 28.923 ± 2.743 | 35.864 ± 3.804 | +6.94 | ns |
| Swing Duration CV | (CV %) | 19.604 ± 0.829 | 21.488 ± 1.265 | +1.84 | ns |
| Paw Area at Peak Stance | (cm2) | 0.185 ± 0.006 | 0.193 ± 0.005 | +0.01 | ns |
| Paw Area Variability at Peak Stance | (cm2) | 0.020 ± 0.002 | 0.023 ± 0.002 | 0.00 | ns |
| Stance Factor | (real #) | 0.995 ± 0.014 | 1.003 ± 0.019 | +0.01 | ns |
| Gait Symmetry | (real #) | 1.002 ± 0.004 | 1.024 ± 0.006 | +0.02 | ↓** Fore; ** Hind |
| MAX dA/dT | (cm2/s) | 11.722 ± 0.400 | 12.144 ± 0.334 | +0.42 | ns |
| MIN dA/dT | (cm2/s) | −3.065 ± 0.094 | −3.223 ± 0.130 | −0.16 | ns |
| Overlap Distance | (cm) | −0.072 ± 0.290 | −0.243 ± 0.360 | −0.17 | ns |
| Paw Placement Positioning | (cm) | 0.033 ± 0.067 | 0.098 ± 0.070 | +0.06 | ns |
| Ataxia Coefficient | (real #) | 0.734 ± 0.042 | 0.900 ± 0.046 | +0.17 | ↑* |
| Midline Distance | (cm) | −1.786 ± 0.048 | −1.724 ± 0.049 | +0.06 | ns |
| Axis Distance | (cm) | 0.023 ± 0.129 | 0.010 ± 0.120 | −0.01 | ns |
#, number; ↑, upregulated; ↓, downregulated; CV, coefficient of variation; ns, P ≥ 0.05; *P ≤ 0.05; **P ≤ 0.01; ***P ≤ 0.001; NT n = 13; SCA8 BAC n = 16.
In summary, polySer aggregates increase with age and disease progression in SCA8 mice. Initial sites of polySer accumulation in the brainstem of 2‐month‐old mice are consistent with the early motor abnormalities found in these animals.
RAN polySer‐positive white matter regions show degenerative phenotypes
Previously, we focused our neuropathological assessment of the SCA8 BAC mice on the cerebellar Purkinje cell, granule cell, and molecular layers, which all appeared relatively normal (Moseley et al, 2006). Our detection of polySer in white matter regions of the brain led us to more thoroughly examine white matter regions in SCA8 for neuropathological changes. H&E staining of cerebellar sections from severely affected SCA8 mice showed widespread vacuolization of the subcortical and deep cerebellar white matter regions compared to NT controls (Fig 4A). Because vacuolization can be caused by lipid loss during ethanol dehydration (Wells & Wells, 1989), this observation suggested the possibility that the SCA8 mice have underlying white matter pathology that makes it more sensitive to vacuole formation (Kuwamura et al, 2002; Garman, 2011; Cognat et al, 2014). To test white matter integrity in SCA8, we examined serial cerebellum and brainstem sections for demyelination and axonal degeneration in the polySer‐positive regions. Luxol fast blue (LFB) staining shows demyelination in both the cerebellum and brainstem from SCA8 mice compared to NT controls. Additionally, IHC using an antibody against total neurofilament H (SMI‐32) shows evidence of axonal degeneration (Fig 4A).
Figure 4. SCA8 BAC mice and human autopsy tissue show white matter abnormalities at sites of polySer accumulation.
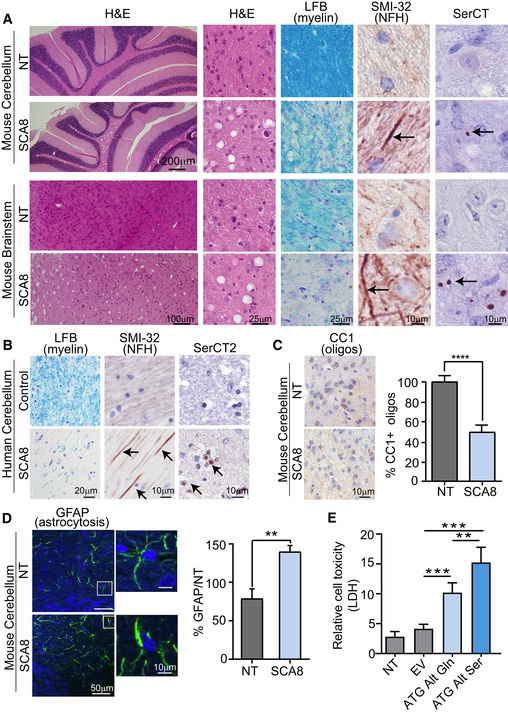
- Disease‐specific sensitivity to vacuolization after prolonged storage in ethanol shown by H&E in cerebellar white matter and brainstem of 10‐ to 12‐month‐old end‐stage SCA8 BAC mice but not in age‐matched NT controls (n = 3) (panels 1&2). Demyelination shown by luxol fast blue staining (LFB) (panel 3) and axonal degeneration shown by α‐SMI‐32 (panel 4; degenerated axons are indicated by black arrows) observed in sites of polySer accumulation shown by α‐SerCT (panel 5; representative aggregates are indicated by black arrows) in deep cerebellar white matter and brainstem in SCA8 BAC mice (lower panels) but not in NT mice (upper panels) (n = 3).
- Demyelination shown by luxol fast blue staining (LFB) (panel 1) and axonal degeneration shown by α‐SMI‐32 (panel 2) observed sites of polySer accumulation shown by α‐SerCT2 (panel 3) in deep cerebellar white matter was found in SCA8 autopsy tissue but not in control brains (n = 3).
- Immunohistochemistry using CC1 (α‐APC) antibody shows significantly lower numbers of mature oligodendrocytes in SCA8 BAC mice compared to NT mice (NT n = 5, SCA8 BAC n = 5; **** P < 0.0001; mean ± SEM; unpaired t‐test).
- Immunofluorescence using α‐GFAP antibody shows significant increase in astrogliosis in SCA8 BAC mice compared to NT mice (NT n = 3, SCA8 BAC n = 3, **P < 0.01; mean ± SEM; unpaired t‐test).
- Cell death measured by lactase dehydrogenase (LDH) assay in T98 cells transfected with codon replacement constructs expressing polyGln (light blue) or polySer (dark blue). NT, nontransfected; EV, empty vector (n = 5, **P < 0.003; ***P < 0.0003; mean ± SEM; unpaired t‐test).
Similar changes were found in human autopsy tissue, with evidence for demyelination and axonal degeneration in deep cerebellar white matter (Fig 4B). These sites of white matter pathology are positive for RAN polySer, but not for polyGln (Fig 4B) and are consistent with white matter abnormalities previously found by imaging and neuropathology in SCA8 patients (Kumar & Miller, 2008; Kim et al, 2013; Yokoyama et al, 2014). In contrast, brain regions that did not show polySer aggregates in SCA8 BAC mouse cerebellum (Fig EV3A) and human cortical white matter (Fig EV3B) did not show evidence of demyelination.
Figure EV3. No polySer aggregates in unaffected white matter regions of SCA8 BAC mouse cerebellum and SCA8 human autopsy brains.
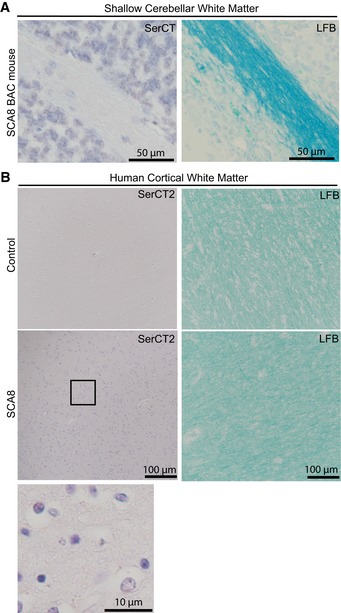
- White matter integrity visualized by luxol fast blue (LFB) staining (right) and polySer aggregates detected by α‐SerCT antibody (left).
- White matter integrity visualized by luxol fast blue (LFB) staining (right) and polySer aggregates detected by α‐SerCT2 antibody (left) in control (top) and SCA8 (bottom and enlarged panel) human autopsy tissue.
To further characterize the oligodendrocyte abnormalities in the polySer‐positive white matter regions, we performed IHC using a cytoplasmic marker of mature oligodendrocytes (CC1) in SCA8 mice. Consistent with the demyelination shown above, these data show a decreased number of mature oligodendrocytes in the deep cerebellar white matter regions of SCA8 animals compared to controls (Fig 4C).
Additionally, GFAP staining of the deep cerebellar white matter regions shows evidence for reactive astrogliosis in SCA8 compared to NT animals with a 50% increase in relative GFAP staining (Fig 4D). Reactive astrogliosis has been implicated in a wide range of neurodegenerative diseases and is often observed in demyelinated lesions within white matter (Schmahmann et al, 2008).
Because we observed degenerative phenotypes in white matter regions where polySer, but not polyGln, aggregates are found, we next tested the cellular toxicity of SCA8 polyGln and polySer expansion proteins independent of each other using ATG‐initiated codon replacement constructs: ATG‐Alt‐Gln and ATG‐Alt‐Ser. We generated alternative codon constructs by selecting different nucleotide sequences that encode the same polyGln or polySer expansion proteins but are unable to form the RAN‐permissive hairpin structure (Zu et al, 2011) and, instead, only express ATG‐initiated polyGln or polySer expansion proteins. These alternative codon, non‐hairpin forming transcripts allow us to study the toxic effects of individual homopolymeric proteins independent of CAG RNA gain‐of‐function effects and effects of other RAN proteins (Bañez‐Coronel et al, 2015). The ATG‐Alt‐Ser construct includes an ATG‐initiation codon, 107 serine‐encoding codons (TCT‐TCC), and the unique C‐terminal region after the repeat tract. Similarly, the ATG‐Alt‐Gln construct has an ATG‐initiation codon followed by 107 glutamine‐encoding repeats (CAA) and is followed by multiple stop codons mimicking the endogenous mutant SCA8 polyGln protein. It has previously been shown that alternative codon constructs used to encode polyGln and polySer produce polyGln and polySer proteins, respectively (Bañez‐Coronel et al, 2015).
After demonstrating that the ATG‐Alt‐Gln and ATG‐Alt‐Ser constructs express comparable levels of RNA (Fig EV4A), we measured relative levels of cell death using the lactate dehydrogenase (LDH) assay (Korzeniewski & Callewaert, 1983). LDH is a cytoplasmic enzyme, and its release into the media is an indicator of lost membrane integrity and cell death. T98 glial cells expressing polyGln or polySer showed significant increases in cell death compared to empty vector (P < 0.00025). Interestingly, T98 cells expressing polySer showed increased cell death compared to cells expressing polyGln (P < 0.0025; Fig 4E).
Figure EV4. eIF3F knockdown does not affect minigene RNA expression levels.
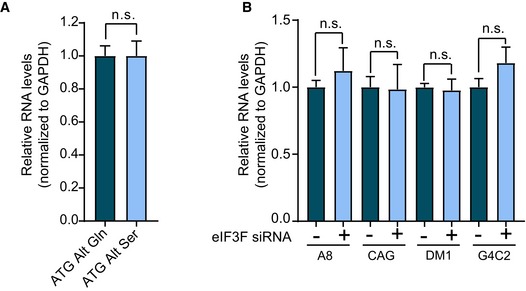
- Bar graph showing relative minigene expression measured by qRT–PCR in cells transfected with the codon replacement constructs expressing polyGln (dark blue) or polySer (light blue; n = 5, n.s. no significance; mean ± SEM; unpaired t‐test).
- Bar graph showing relative minigene expression measured by qRT–PCR in cells co‐transfected with the various repeat expansion and control (dark blue) or eIF3F (light blue) targeting siRNA (n = 5; n.s. no significance; mean ± SEM; unpaired t‐test).
Taken together, these data show that RAN polySer‐positive white matter regions in SCA8 mice have demyelination, axonal degeneration, oligodendrocyte loss, and astrogliosis. Furthermore, in vitro studies show polySer expansion proteins are toxic to glial cells independent of the CAG expansion transcripts.
RAN protein levels decreased by knockdown of eIF3F
The accumulation of the SCA8 polySer RAN protein and previously reported HD and DM2 RAN proteins (Bañez‐Coronel et al, 2015; Zu et al, 2017) in white matter regions suggests that RAN translation may be more efficient in specific cell types or brain regions. This raises the possibility that cells within white matter regions express one or more factors that favor RAN translation. RAN‐transactivating factors (RAN‐TAFs) could function like IRES trans‐acting factors (ITAFs) that facilitate translation from IRES sequences (Holcik & Sonenberg, 2005).
The eukaryotic translation factor, eIF3F, was of interest to us as a possible RAN‐TAF because the full‐length transcript isoform (ENST00000309828.4) was reported to be elevated in white matter compared to gray matter brain regions (Mills et al, 2013). It has also been shown that increased levels of eIF3F can downregulate canonical translation (Shi et al, 2006) and that eIF3F binds structured IRES sequences (Zhou et al, 2008) similar to those that undergo RAN translation. To investigate whether Eif3f expression is higher in white matter than in gray matter, we performed qRT–PCR comparing tease‐separated cerebellar white and gray matter from SCA8 BAC mice. To confirm an enrichment of oligodendrocytes in white matter samples, myelin basic protein (MBP) was measured by qRT–PCR. After confirmation of MBP white matter enrichment (Fig EV5A), we performed qRT–PCR and show Eif3f transcripts have a twofold increase in SCA8 BAC cerebellar white matter compared to gray matter (Fig 5A). We also evaluated levels of ATXN8 RNA in cerebellar gray and white matter and found no significant difference in the expression of ATXN8 transcripts (Fig EV5B), indicating that changes in ATXN8 RNA expression are unlikely to contribute to the increased polySer aggregate accumulation in white matter regions. The elevated Eif3f levels observed in cerebellar white matter, which shows robust polySer aggregation, are consistent with the possibility that eIF3F increases RAN translation leading to the accumulation of RAN polySer protein in white matter.
Figure EV5. MBP is enriched in white matter regions and ATXN8 shows no regional specific expression in SCA8 BAC mouse brain.
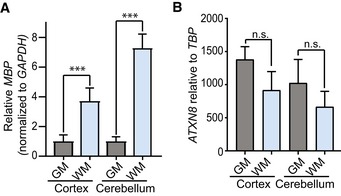
- qRT–PCR of MBP in cerebellar white and gray matter regions shows increased expression of MBP in cerebellar white matter compared to cerebellar gray matter (n = 3; ***P < 0.001; mean ± SEM; unpaired t‐test).
- qRT–PCR of AXTN8 in cortical and cerebellar white and gray matter shows no difference in ATXN8 RNA expression levels (n = 3; n.s. no significance; mean ± SEM; unpaired t‐test).
Figure 5. Mammalian translation factor eIF3F is upregulated in symptomatic SCA8 BAC mice and can regulate RAN translation.
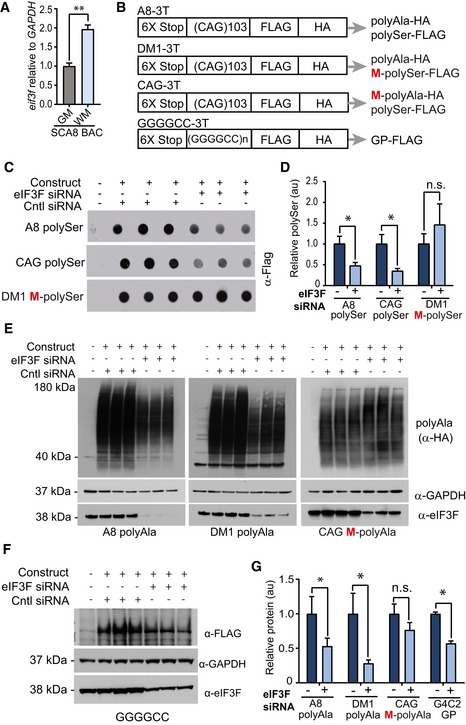
- qRT–PCR showing Eif3f expression levels are increased twofold in SCA8 cerebellar white matter compared to SCA8 cerebellar gray matter (n = 3, **P < 0.01; mean ± SEM; unpaired t‐test).
- Schematic diagram showing constructs used for eIF3F knockdown experiments. All constructs have a tag in each reading frame. Red M indicates methionine (ATG) initiated reading frames.
- Dot blot detection of polySer expression in using α‐FLAG antibody showing decrease in RAN polySer but not ATG‐polySer when HEK293 cells are co‐transfected with eIF3F siRNA.
- Quantification of polySer detection (n = 5, *P < 0.01; n.s. no significance; mean ± SEM; unpaired t‐test).
- Detection of polyAla expression using α‐HA antibody showing decrease in RAN polyAla but not ATG‐polyAla when HEK293 cells are co‐transfected with eIF3F siRNA.
- Detection of polyGP expression using α‐FLAG antibody showing a decrease in RAN polyGP when HEK293 cells are co‐transfected with eIF3F siRNA.
- Quantification of polyAla and polyGP detection (n = 5, *P < 0.01; n.s. no significance; mean ± SEM; unpaired t‐test).
Source data are available online for this figure.
To explore the possible role of eIF3F as a RAN‐TAF, we tested the effects of eIF3F knockdown on protein accumulation in HEK293T cells expressing expansion proteins with or without an ATG‐initiation codon (Fig 5B). First, we tested the effects of eIF3F knockdown on polySer protein accumulation using minigenes with or without an ATG‐initiation codon in the polySer frame. siRNA knockdown of eIF3F decreased steady‐state levels of RAN polySer proteins expressed from CAG constructs that do not contain an ATG‐initiation codon in the polySer frame. PolySer from the A8 and CAG constructs were reduced by 53% (P < 0.05) and 66% (P < 0.01), respectively. In contrast, eIF3F knockdown did not affect polySer levels in cells transfected with the DM1‐3T construct, which contains an ATG‐initiation codon in the polySer frame (Fig 5C and D).
Similarly, eIF3F knockdown in cells expressing constructs without an ATG‐initiation codon in the polyAla reading frame (A8 and DM1) decreased steady‐state levels of polyAla RAN proteins by 47% (P < 0.05) and 72% (P < 0.05), respectively. Similar to the polySer results, eIF3F knockdown in the presence of an ATG‐initiation codon (CAG‐3T) did not decrease polyAla accumulation (Fig 5E and G). In summary, these data show eIF3F modulates steady‐state levels of RAN, but not ATG‐initiated polySer and polyAla proteins.
Next, we tested whether eIF3F also affects RAN proteins expressed from the ALS/FTD causing GGGGCC repeats. Protein levels of glycine–proline (GP) from a GGGGCC expansion construct were measured by protein blotting. Similar to the results with the CAG expansion, eIF3F knockdown decreased levels of GP by 43% (P < 0.05; Fig 5F and G). Quantitative RT–PCR showed that eIF3F knockdown did not affect the levels of mRNA expressed from any of the minigene constructs (Fig EV4B).
Taken together, these data show that eIF3F knockdown can reduce steady‐state levels of RAN proteins in multiple reading frames and across CAG and G4C2 repeat motifs.
Discussion
Here, we describe a novel CAG‐encoded polySer RAN protein and provide evidence that it contributes to SCA8 pathology. First, we show SCA8 RAN polySer is found in affected brain regions of mouse and human autopsy tissue, including the cerebellum and brainstem. Second, although both proteins are expressed from CAG expansion transcripts, the SCA8 RAN polySer shows a distinct distribution pattern in the white matter compared to the previously described ATG‐initiated polyGln protein, which accumulates in neurons. Third, SCA8 polySer RAN protein accumulation increases with age and disease progression in SCA8 BAC expansion mice. Fourth, white matter regions with RAN polySer staining show demyelination, axonal degeneration, and astrogliosis suggesting a role for SCA8 polySer RAN in neurodegeneration by loss of white matter integrity. Finally, we found that eiF3F, a mammalian translation factor, is expressed at higher levels in cerebellar white matter compared to gray matter. Interestingly, in vitro knockdown of eIF3F reduces RAN but not AUG‐initiated expansion proteins, suggesting eIF3F may underlie the white matter‐specific RAN protein accumulation now observed in several repeat expansion diseases (SCA8, DM2 and HD).
In addition to our current report of polySer, we previously reported the accumulation of RNA foci, polyAla, and polyGln proteins in SCA8 BAC mice and patient autopsy tissue. Initially, it was demonstrated that polyGln accumulates in Purkinje and pontine neuronal nuclei (Moseley et al, 2006). The present work extends the molecular characterization of SCA8 by showing polyGln aggregates are also found in the frontal cortex, pons, and hippocampus (Fig 2B), and are consistently located in neuronal nuclei (Fig 2C). RAN polyAla staining was previously reported in Purkinje cell soma and dendritic processes (Zu et al, 2011), and CUG RNA foci were detected in Purkinje cells, molecular layer interneurons, and Bergmann glia (Daughters et al, 2009). Additional studies are needed to investigate the brain distribution of polyAla and possible antisense RAN proteins.
Here, we provide the first in vivo evidence of a novel RAN polySer protein, which accumulates in white matter regions. This led to the discovery that SCA8 mice have widespread white matter abnormalities, which are first found in the cerebellum and brainstem. White matter degeneration phenotypes found in severely affected SCA8 mice raises the possibility that SCA8 initially involves myelin loss and axonal degeneration followed by loss of Purkinje cells and other neurons. Consistent with this hypothesis, sensory symptoms, including proprioception deficits indicative of polyneuropathy in patients, suggest neuronal loss in SCA8 may be triggered by a distal to proximal dying‐back axonopathy (Gupta & Jankovic, 2009). It is also possible that the white matter abnormalities seen in SCA8 mice are early neurodegenerative features of the disease and that RAN protein accumulation in white matter regions triggers these abnormalities. At later stages of disease in the SCA8 mice and human autopsy tissue, RAN polySer aggregates are also found throughout the frontal cortex and hippocampus, a finding consistent with cognitive abnormalities in SCA8 patients (Juvonen et al, 2000; Stone et al, 2001; Zeman et al, 2004; Baba et al, 2005).
Similar to SCA8, RAN protein accumulation in white matter regions and white matter abnormalities have also been reported in HD (Bohanna et al, 2011; Bañez‐Coronel et al, 2015) and DM2 (Ogata et al, 1998; Minnerop et al, 2011; Zu et al, 2017). Whether glial cells express RAN proteins or they respond to degeneration of neuronal processes is not clear. In HD, glial‐specific expression of the expansion mutation results in the development of neurodegenerative phenotypes, highlighting the role of glia in disease (Huang et al, 2015). This model and additional animal models that selectively express expansion mutations in glial cells will be important for understanding the effects of RAN proteins on glia in repeat expansion diseases.
The greater level of SCA8 polySer toxicity compared to polyGln that we see in cell culture is consistent with previous findings in HD (Bañez‐Coronel et al, 2015). The high toxicity of these homopolymeric polySer proteins suggests that they contribute to the white matter abnormalities found in the polySer‐positive regions in both SCA8 and HD. The toxicity of SCA8 and HD polySer expansion proteins may be related to the propensity of these residues for post‐translational modifications. For example, phosphorylation of serine residues in the microtubule‐associated protein tau (MAPT) and TAR DNA binding proteins (TDP‐43) causes toxic protein GOF effects in several neurodegenerative diseases (Sreedharan et al, 2008; Golde et al, 2010). Given the fact that bidirectional expression and RAN translation are found in a growing number of diseases, it is possible that polySer toxicity could also play a role in other CAG/CTG repeat expansion disorders including SCA1, SCA2, SCA3, SCA6, SCA12, SCA17, SBMA, DRPLA, and DM1.
Protein translation machinery in eukaryotes is well conserved; however, the components of this machinery vary between cell types and developmental stages (Sauert et al, 2015). The preferential accumulation of SCA8 RAN polySer and several other RAN proteins in white matter regions (Bañez‐Coronel et al, 2015; Zu et al, 2017) suggests that RAN translation may be favored by one or more translation factors expressed in white matter. In vanishing white matter disease, mutations in the eukaryotic translation initiation factor eIF2B cause selective effects on glial cells (van der Knaap et al, 2006). Here, we demonstrate that reducing the levels of the mammalian eukaryotic translation initiation factor eIF3F decreases steady‐state levels of several RAN but not AUG‐initiated expansion proteins in cell culture.
Taken together, these data support a model in which protein translation from reading frames containing upstream AUG start codons initiates using met‐tRNAi met and the canonical protein translational machinery. In contrast, RAN translation which does not require an AUG start codon is sensitive to eIF3F levels. The AUG codon present in the polyGln reading frame could therefore explain the cell‐type distribution difference between AUG‐initiated polyGln and RAN proteins in both SCA8 and HD.
Because regulation of translation initiation plays a critical role in cellular homeostasis, global effects of any therapeutic perturbation on translation initiation machinery will need to be assessed carefully. While our results suggest that eIF3F plays a role in RAN translation and may be a therapeutic target for multiple microsatellite expansion disorders, it will be important to determine the potential risks and benefits of reduced eIF3F activity in brain. Additionally, more studies are required to understand the mechanism by which eIF3F regulates RAN translation.
The mammalian eIF3 complex is the largest initiation complex compromising 13 non‐identical subunits (Hinnebusch, 2006). Among these, five “core” subunits (eIF3a, eIF3b, eIF3c, eIF3g, eIF3i) are conserved in yeast translation machinery and have also been shown to be sufficient for translation of mammalian transcripts (Naranda et al, 1994; Hinnebusch, 2006). The remaining “noncore” subunits including eIF3f appear to play a regulatory role in canonical and IRES translation initiation (Hashem et al, 2013; Cate, 2017). Consistent with a non‐essential role for eIF3F, a gene‐trap screen in two human cell lines identified a number of eIF3 subunit genes (eIF3A, eIF3B, eIF3D, eIF3I, eIF3J, eIF3M) but not eIF3F as important for optimal fitness (Blomen et al, 2015). While the specific functions of eIF3F are not well understood, the loss of eIF3F has been reported to contribute to tumorigenesis (Shi et al, 2006) and to induce muscle atrophy (Csibi et al, 2008). It has also been reported that the eIF3 complex binds to structured 5′ UTRs and recruits mRNAs directly to ribosomes independent of canonical scanning machinery (Lee et al, 2015). In our cell culture experiments, eIF3F knockdown was sufficient to decrease steady‐state levels of RAN polySer and RAN polyAla, but did not reduce levels of ATG‐initiated polySer or ATG‐initiated polyAla proteins suggesting eIF3F may preferentially affect RAN proteins and could provide an opportunity to target RAN translation without interfering with canonical translation. Future studies in animal models and the generation and characterization of eIf3f knockout mice will be important to determine whether eIF3F/eIf3f knockdown can selectively reduce RAN protein accumulation without deleterious effects on protein homeostasis. Additional studies are also needed to understand how eIF3F affects RAN translation and whether these effects are direct or indirect.
In summary, we provide compelling evidence for the accumulation of a novel, toxic SCA8 polySer RAN protein that forms aggregates, which increase with age and disease severity. These polySer aggregates preferentially accumulate in WM regions that show demyelination and axonal degeneration. Additionally, we identify eIF3F as a translation initiation factor that selectively regulates RAN but not canonical translation and provides a novel entry point into identifying the RAN translation machinery.
Materials and Methods
DNA constructs and siRNAs
The FLAG‐polySerCT construct was generated by subcloning ATNX8 genomic sequence containing a CAG expansion of 82 repeats with 188 bp of downstream sequence into p3X FLAG‐myc‐CMV‐24 vector (Sigma, St. Louis, MO) in the CAG direction. The genomic DNA used to generate this clone was amplified by PCR using genomic DNA from the SCA8 BAC expansion mice (2,878) and using a 5′ primer (5′ AGC TGA AGC TTG TTA AAA GAA GAT AAT ATA TTT AAA AAA TGC AG 3′) containing an added HindIII restriction enzyme site and the 3′ primer (5′ AGT CTG AAT TCC CTA GTT CTT GGC TCC AGA CTA AC 3′) containing an added EcoRI restriction enzyme site. The 5′ primer also contains a T/G base substitution to avoid the insertion of a stop codon in AGC reading frame between N‐terminal FLAG and the repeat tract. The PCR product was cut with HindIII/EcoRI and cloned into p3X FLAG‐myc‐CMV‐24 cut with the same enzymes. The presence of the N‐terminal FLAG epitope tag in the polySer (AGC) frame, 82 CAG repeats, and 3′ flanking region spanning the first stop codon within polySer frame was confirmed by Sanger sequencing.
ATG‐3T, A8‐3T, DM1‐3T, and GGGGCC‐3T were previously generated and described (Zu et al, 2011, 2013).
siRNA targeting human eIF3F and a control non‐targeting siRNA were ordered from GE Dharmacon (Lafayette, CO; control siRNA: D‐002810‐01‐05, eIF3F:J‐019535‐10).
To assess toxicity of individual RAN proteins, ATG‐initiated non‐hairpin forming alternative codon minigenes were generated and synthesized by IDT Technologies and subcloned into pcDNA3.1‐3T vector in frame with the 3′ FLAG tag. PolyGln is encoded by CAA repeats, and polySer is encoded by TCT‐TCC. To better imitate the SCA8 RAN proteins, the C‐terminal region of the polySer protein is included after the polyprotein stretch. The polyGln protein is directly followed by several stop codons, therefore, polyGln does not have a unique C‐terminal sequence.
Cell culture and transfections
HEK293T cells, which express high levels of RAN proteins (Zu et al, 2011), were cultured in DMEM supplemented with 10% fetal bovine serum (FBS) and incubated at 37°C in a humid atmosphere containing 5% CO2. Plasmid and siRNA transfections were done with Lipofectamine 2000 (Invitrogen, Carlsbad, CA) according to manufacturer's instructions. Cells were collected 48 h post‐transfection for subsequent analysis. For KD experiments, HEK293T cells were transfected with 30 nM siRNA using Lipofectamine 2000. Twenty‐four hours post‐transfection, repeat containing plasmid and 30 nM siRNA were co‐transfected. Cells were collected 48 h after the first second round of transfection.
LDH cytotoxicity assay
Cell toxicity was measured in T98 cells and assessed by measuring lactate dehydrogenase (LDH) released into the medium by dying cells (CytoTox 96 Nonradioactive Cytotoxicity Assay, Promega, Madison, WI) following the manufacturer's protocol. Absorbance was recorded at 490 nm, and total LDH release was measured by lysing the cells with 1% Triton X‐100. LDH determinants were measured in three independent experiments and each experiment performed in quintuplicates for each condition (Korzeniewski & Callewaert, 1983).
Real‐time quantitative PCR
Quantification of transcript levels in cells transiently transfected with triple‐tagged constructs was performed using the 5′FLAG (5′ GAT TAC AAG GAC GAC GAC GAC 3′) and 3′HIS (5′ ATG GTC ATG GTG ATG ATG ACC 3′) primers. Control reactions were performed using human β‐actin forward (5′ TCG TGC GTG ACA TTA AGG AG 3′) and human β‐actin reverse (5′ GAT CTT CAT TGT GCT GGG TG 3′) primers.
eIF3F and MBP in white matter vs. gray matter were measured using Bio‐Rad PrimePCR SYBR Green Assay primers (Bio‐Rad, Hercules, CA). Detection of ATXN8 in SCA8 BAC mouse was previously described in Moseley et al, 2006.
Production of rabbit polyclonal antibodies
The polyclonal rabbit antibodies against polySer RAN protein were generated by New England Peptide (NEP, Gardner, MA). Rabbit antisera were raised against synthetic peptides Ac‐CRVNLSVEAGSQKRQSE‐amide and Ac‐CSSSKARFSNMKD‐amide for α‐SerCT (NEP, Project #1306, Rabbit #F3672) and α‐SerCT2 (NEP, Project #2953, Rabbit #I2108), respectively.
Human autopsy tissue
Control and SCA8 autopsy tissue were collected at the University of Minnesota and the University of Florida with informed consent of patients or their relatives and approval of respective institutional review boards.
Mouse samples
Mice used in this study were housed and treated in accordance with the NIH Guide for the Care and Use of Laboratory Animals. All animal studies were approved by Animal Care and Use Committee at the University of Florida. Previously described SCA8 BAC transgenic lines on the FVB background (BAC EXP2, 2878) were used (Moseley et al, 2006). Hemizygous mice with the SCA8 BAC transgene were by genotyped by PCR as previously described (Moseley et al, 2006). Due to severe motor dysfunction that SCA8 BAC expansion mice exhibit after 5 months of age, additional food (GelDiet, Clear H2O, Westbrook, MA) was provided in the bottom of the cage for animals > 5 months. For histological analysis, animals were anesthetized using 100 mg of ketamine and 20 mg of xylazine per kg of body weight and perfused through the ascending aorta with 15 ml of isotonic saline, followed by 10 ml of 10% buffered formalin. For total RNA isolation, mice were euthanized by CO2 inhalation followed by cervical dislocation.
Gait analysis
Digital video images of the mouse paws were collected with a high‐speed video camera set up beneath the transparent belt of a motorized treadmill (DigiGait™ Imaging system, Mouse Specifics, Framingham, MA). SCA8 BAC mice and their littermates were tested at 2 months of age. Each mouse was allowed to explore the treadmill and habituate to the task for 1 min with the motor speed set to 12 cm/s. Motor speed was increased to 22 cm/s for data collection. Approximately 5‐s of video recording in which the mouse walked straight ahead in a constant relative position with respect to the camera was used for analysis. Data from each paw were analyzed with DigiGait automated gait analysis software, and the 45 parameters measured by the software are outlined in Table 2 (Mouse Specifics).
Open field analysis
Open field analysis was performed by testing mouse behavior during a 30‐min session in a completely dark 17″ × 17″ open chamber (Med Associates, Inc., Fairfax, VT). Mice were allowed to acclimate to the testing room for approximately 2 h before the start of analysis. Mice were then placed in the center of the darkened activity‐monitoring chamber. Data were analyzed with Activity Monitor software (Med Associates, Inc.; Bolivar et al, 2000).
Immunofluorescence
Polyclonal rabbit antibodies were tested in vitro for their specificity to recombinant SCA8 polySer RAN. HEK293T cells were cultured on coverslips in six‐well tissue‐culture plates and transfected with the FLAG‐polySerCT plasmid the next day. Forty‐eight hours post‐transfection, cells were fixed in 4% paraformaldehyde in PBS for 20 min and permeabilized in 0.5% Triton X‐100 in PBS for 10 min on ice. The coverslips were blocked in 1% normal goat serum (NGS) in PBS for 30 min. After blocking, the cells were incubated for 1 h at room temperature in blocking solution containing the α‐FLAG (1:200; A8592, Sigma) primary antibodies and α‐SerCT polyclonal antibodies (1:1,000). The coverslips were washed three times in PBS and incubated for 1 h at 37°C in blocking solution containing secondary antibodies. Goat α‐mouse conjugated to Cy3 (Jackson ImmunoResearch, West Grove, PA) and goat α‐rabbit conjugated to Alexa Fluor 488 (Invitrogen) were used at a dilution of 1:200. Slides were washed three times for 5 min in 1× PBS, mounted with Prolong Diamond Antifade Mounting Medium with DAPI (Invitrogen), and coverslipped. Mouse α‐NeuN antibody (ABN78A4, Millipore Sigma, Burlington, MA) was used for co‐staining with custom rabbit polyclonal α‐SerCT antibody, and rabbit α‐NeuN antibody (ab104225, Abcam, Cambridge, MA) was used for co‐staining with mouse 1C2 antibody (MAB1574, Millipore Sigma).
Immunofluorescence using α‐GFAP or α‐CNPase was performed on fixed mouse brain sections. The sections were deparaffinized in xylene and rehydrated through an alcohol gradient. Heat‐induced antigen retrieval was performed in 10 mM citrate buffer (pH = 6.0). Non‐specific binding was blocked using 2% FBS solution in 1× PBS. Rabbit polyclonal α‐GFAP antibody (1:1,000; Biogenex, Fremont, CA) and α‐CNPase (1:200; ab6319, Abcam) were applied at 4°C overnight. The sections were washed three times in 1× PBS, and α‐rabbit antibody conjugated to Alexa Fluor 488 (Invitrogen) was used at a dilution of 1:200. Slides were washed three times for 5 min in 1× PBS, mounted with Prolong Diamond Antifade Mounting Medium with DAPI (Invitrogen), and coverslipped. Images were taken with a Leica confocal microscope (Leica Microsystems, Wetzlar, Germany).
Histology and immunohistochemistry
For the detection of polySer RAN proteins using the C‐terminal antibodies and the fresh‐frozen mouse brain tissue, the following protocol was used. Brains were collected and frozen in 2‐methylbutane cooled with liquid nitrogen. Seven‐micrometer sagittal sections were cut using cryostat and fixed in 10% buffered formalin for 15 min. Endogenous peroxidase block was performed in 3% H2O2 methanol for 5 min. To block non‐specific binding a non‐serum block (Biocare Medical, Pacheco, CA) was applied for 15 min. Primary antisera were applied in 1:10 non‐serum block at 4°C overnight at the following dilutions; α‐SerCT (1:10,000), α‐SerCT2 (1:5,000), or corresponding preimmune sera at the same dilutions. The sections were washed three times in 1× PBS and biotin‐labeled rabbit secondary antibody (Biolegend, San Diego, CA) applied at room temperature for 30 min. A horseradish peroxidase‐conjugated linking reagent (Biolegend) was applied for 30 min at room temperature, and detection was performed by exposure to vector nova red substrate kit (Vector Laboratories, Inc., Burlingame, CA). For counterstaining, hematoxylin solution (Vector Laboratories, Inc.) was applied for 20‐s. Slides were dehydrated in graded ethanol and xylene solutions and mounted using CytoSeal 60 (Electron Microscopy Sciences, Hatfield, PA).
For detection of polySer RAN protein in fixed brain tissue, animals were perfused transcardially with 1× PBS and 10% buffered formalin. Brains were collected and stored in 10% formalin for 24 h and later removed into 70% ethanol. After histological processing and paraffin embedding, seven‐micrometer sagittal sections were cut using a microtome. Sections were deparaffinized in xylene (15 min two times) and rehydrated through an alcohol gradient (10 min at each step). Sections were then treated with the following antigen retrieval steps: first, 1 μg/ml proteinase K treatment in 1 mM CaCl2, 50 mM Tris buffer (pH = 7.6) for 30 min at 37°C; second, pressure cooked in 10 mM EDTA (pH = 6.5) for 15 min using microwave as a heat source; and third, 95% formic acid treatment for 5 min (Kai et al, 2012). Endogenous peroxidase was blocked in 3% H2O2 methanol for 10 min. To block non‐specific binding, a non‐serum block (Biocare Medical, Pacheco, CA) was applied for 15 min. Primary antisera were applied in 1:10 non‐serum block at 4°C overnight with α‐SerCT (1:10,000), α‐SerCT2 (1:5,000), or corresponding preimmune sera in the same concentrations. The sections were washed three times in 1× PBS and biotin‐labeled rabbit secondary antibody (Biolegend) applied at room temperature for 30 min. A horseradish peroxidase‐conjugated linking reagent was applied for 30 min at room temperature and detection was performed by exposure to the Vector Red Substrate Kit (Vector Laboratories, Inc.). Hematoxylin solution was applied for 20‐s (Vector Laboratories, Inc.).
Immunostaining experiments using α‐APC CC1 (1:1,000; Calbiochem, San Diego, CA), α‐SMI‐32 (1:3,000; Covance, Princeton, NJ), and α‐FLAG (1:1,000; Sigma) antibodies were performed in similar way as above except that a milder heat‐induced antigen retrieval was performed in 10 mM citrate buffer (pH = 6.0) using a steamer instead of pressure cooker. For hematoxylin and eosin staining, seven micron mouse and human brain sections were deparaffinized in xylene and dehydrated through graded ethanol. The slides were then soaked in hematoxylin (Sigma) for 1 min and washed in running distilled water for 10 min. Next, the slides were immersed in Eosin Y (Sigma) for 30 s and washed in distilled water for 10 min. The slides were rehydrated and coverslipped before visualization.
For luxol fast blue (LFB) staining, 7 μm mouse and human brain sections were deparaffinized in xylene and hydrated to 95% ethyl alcohol. The sections were left in LFB solution (0.1% luxol fast blue in 95% ethyl alcohol) at 56°C overnight. The next day, slides were rinsed in 95% ethyl alcohol and distilled water. Subsequently, the slides were differentiated in the lithium carbonate solution and 70% ethyl alcohol (30 s, each) and washed in distilled water. The slides were counterstained in the cresyl violet solution (0.1% cresyl violet in distilled water) for 40 s, rinsed in distilled water. The slides were rehydrated and coverslipped before visualization. Images were captured with an Olympus BX51 light microscope.
Statistical analysis
Statistical significance was assessed by the unpaired Student's t‐test. LDH toxicity assays were corrected for multiple comparisons. Statistics were performed using the software package Prism 5 (GraphPad Software Inc, GraphPad Software, Inc., La Jolla, CA).
Protein blotting
Cells were lysed with RIPA (150 mM NaC1, 1% sodium deoxycholate, 1% Triton X‐100, 50 mM Tris–HCl; pH = 7.5) buffer with proteinase inhibitors (Roche) at 4°C with shaking for 30 min. Genomic DNA was sheared with a 21‐gauge needle, and lysates were centrifuged at 4°C at 15,000 g for 15 min. Protein in the soluble fraction of the lysates was quantified by Bradford assay (Bio‐Rad, Hercules, CA). Lysates were run 4–12% Bis‐Tris gel (Bio‐Rad) and transferred to nitrocellulose membrane. Membranes were blotted with the antibodies at 4°C shaking overnight: α‐FLAG‐HRP (1:3,000; Sigma), α‐HA (1:2,000; Sigma), α‐GAPDH (1:10,000, Millipore, Burlington, MA), α‐polySer1 (1:10,000, custom antibody) in 1% milk in phosphate‐buffered saline with Tween 20 (PBST). Membranes were washed in PBST for 5 min three times and incubated in secondary antibody solutions conjugated to horseradish peroxidase (1:2,500; GE Healthcare, Lafayette, CO) for 45 min at room temperature. Membranes were washed again in PBST and developed with the application of the substrate for enhanced chemiluminescence (ECL) for 1 min (PerkinElmer, Waltham, MA).
Insoluble pellets were resuspended in 2% SDS and incubated at 65°C. Resulting SDS soluble fraction was immobilized onto nitrocellulose membranes with Bio‐Dot 96‐well microfiltration system (Bio‐Rad) under vacuum. The membranes were washed with PBST and blotted using the same protocol as Western blotting.
RNA isolation
Whole cerebellum was removed, cut into pieces, and lysed in TRI reagent (Invitrogen). Total RNA was isolated using chloroform extraction and precipitated using isopropanol. The RNA pellet was washed with 70% ethanol in DEPC water and dissolved in 30 μl of DEPC water. Any contaminant genomic DNA was removed using Turbo DNase I (Thermo Fisher, Waltham, MA). RNA quantification was performed using Nanodrop and Quant‐iT™ Ribogreen RNA Assay Kits (Thermo Fisher).
High‐throughput cDNA sequencing
The integrity of RNA samples obtained from three SCA8 BAC expansion and three non‐transgenic control mice was assessed using 2100 Bioanalyzer (Agilent, Santa Clara, CA), and samples with RNA integrity number (RIN) > 8 were used for further analysis. Single‐stranded cDNA libraries were prepared at New York Genome Centre (NYGC, New York, NY). The libraries were sequenced using Illumina Hiseq2500 platform generating paired reads of 125 bp.
RNA‐Seq analysis
To compare expression levels of ATXN8 and ATXN8OS, the human reference sequence containing ATXN8OS and 10 kb upstream and downstream sequence was indexed using HiSat2 (Kim et al, 2015). This indexed sequence was then used as the reference genome, and raw reads generated by RNA‐Seq were fed into HiSat2 aligner. The resulting alignments to the ATXN8/ATXN8OS locus were visualized by Integrated Genomic Viewer (Robinson et al, 2011). Fragment per kilobase million (FPKM) of ATXN8 and ATXN8OS was calculated by normalizing the read count mapped to gene‐specific regions of ATXN8 and ATXN8OS to the length. The difference was calculated by dividing both FPKM values by ATXN8OS FPKM value. This analysis was done on three biological replicates, and statistical significance was calculated using an unpaired t‐test.
Author contributions
FA and LPWR conceived the project. FA, BAP, HKS, MB‐C, and TZ conducted experiments. FA, BAP, TZ, ETW, ATY, HKS, and MB‐C analyzed data. HF, HBC, JCT, CAR, SHS, TA, TR, and LPWR provided human autopsy tissue. FA, BAP, and LPWR wrote the manuscript. All authors discussed the results and commented on the manuscript.
Conflict of interest
F.A., T.Z., and L.P.W.R. have patents pending on RAN translation.
Supporting information
Expanded View Figures PDF
Source Data for Expanded View
Review Process File
Source Data for Figure 5
Acknowledgements
We thank the families that donated tissue for making this research possible. This work was funded by the National Ataxia Foundation (L.P.W.R.) and the NIH (5R37NS040389‐13) (L.P.W.R.), a University of Florida Alumni Fellowship (F.A.), an NIH T32 Training Grant (NS082168) (B.A.P.), the 1‐Florida ADRC (NIH P50 AG047266‐01A1) (A.T.Y), and the Johns Hopkins University Alzheimer's Disease Research Center (NIH P50AG05146) (J.C.T. and C.A.R).
The EMBO Journal (2018) 37: e99023
References
- Ash PE, Bieniek KF, Gendron TF, Caulfield T, Lin WL, Dejesus‐Hernandez M, van Blitterswijk MM, Jansen‐West K, Paul JW III, Rademakers R, Boylan KB, Dickson DW, Petrucelli L (2013) Unconventional translation of C9ORF72 GGGGCC expansion generates insoluble polypeptides specific to c9FTD/ALS. Neuron 77: 639–646 [DOI] [PMC free article] [PubMed] [Google Scholar]
- Baba Y, Uitti RJ, Farrer MJ, Wszolek ZK (2005) Sporadic SCA8 mutation resembling corticobasal degeneration. Parkinsonism Relat Disord 11: 147–150 [DOI] [PubMed] [Google Scholar]
- Bañez‐Coronel M, Ayhan F, Tarabochia AD, Zu T, Perez BA, Tusi SK, Pletnikova O, Borchelt DR, Ross CA, Margolis RL, Yachnis AT, Troncoso JC, Ranum LP (2015) RAN translation in Huntington disease. Neuron 88: 667–677 [DOI] [PMC free article] [PubMed] [Google Scholar]
- Blomen VA, Májek P, Jae LT, Bigenzahn JW, Nieuwenhuis J, Staring J, Sacco R, van Diemen FR, Olk N, Stukalov A, Marceau C, Janssen H, Carette JE, Bennett KL, Colinge J, Superti‐Furga G, Brummelkamp TR (2015) Gene essentiality and synthetic lethality in haploid human cells. Science 350: 1092–1096 [DOI] [PubMed] [Google Scholar]
- Bohanna I, Georgiou‐Karistianis N, Sritharan A, Asadi H, Johnston L, Churchyard A, Egan G (2011) Diffusion tensor imaging in Huntington's disease reveals distinct patterns of white matter degeneration associated with motor and cognitive deficits. Brain Imaging Behav 5: 171–180 [DOI] [PubMed] [Google Scholar]
- Bolivar VJ, Caldarone BJ, Reilly AA, Flaherty L (2000) Habituation of activity in an open field: a survey of inbred strains and F1 hybrids. Behav Genet 30: 285–293 [DOI] [PubMed] [Google Scholar]
- Cate JH (2017) Human eIF3: from ‘blobology’ to biological insight. Philos Trans R Soc Lond B Biol Sci 372: 20160176 [DOI] [PMC free article] [PubMed] [Google Scholar]
- Cognat E, Cleophax S, Domenga‐Denier V, Joutel A (2014) Early white matter changes in CADASIL: evidence of segmental intramyelinic oedema in a pre‐clinical mouse model. Acta Neuropathol Commun 2: 49 [DOI] [PMC free article] [PubMed] [Google Scholar]
- Csibi A, Tintignac LA, Leibovitch MP, Leibovitch SA (2008) eIF3‐f function in skeletal muscles: to stand at the crossroads of atrophy and hypertrophy. Cell Cycle 7: 1698–1701 [DOI] [PubMed] [Google Scholar]
- Daughters RS, Tuttle DL, Gao W, Ikeda Y, Moseley ML, Ebner TJ, Swanson MS, Ranum LP (2009) RNA gain‐of‐function in spinocerebellar ataxia type 8. PLoS Genet 5: e1000600 [DOI] [PMC free article] [PubMed] [Google Scholar]
- Day JW, Schut LJ, Moseley ML, Durand AC, Ranum LP (2000) Spinocerebellar ataxia type 8: clinical features in a large family. Neurology 55: 649–657 [DOI] [PubMed] [Google Scholar]
- Felling RJ, Barron TF (2005) Early onset of ataxia in a child with a pathogenic SCA8 allele. Pediatr Neurol 33: 136–138 [DOI] [PubMed] [Google Scholar]
- Garman RH (2011) Histology of the central nervous system. Toxicol Pathol 39: 22–35 [DOI] [PubMed] [Google Scholar]
- Golde TE, Petrucelli L, Lewis J (2010) Targeting Abeta and tau in Alzheimer's disease, an early interim report. Exp Neurol 223: 252–266 [DOI] [PMC free article] [PubMed] [Google Scholar]
- Gupta A, Jankovic J (2009) Spinocerebellar ataxia 8: variable phenotype and unique pathogenesis. Parkinsonism Relat Disord 15: 621–626 [DOI] [PubMed] [Google Scholar]
- Hashem Y, des Georges A, Dhote V, Langlois R, Liao HY, Grassucci RA, Pestova TV, Hellen CU, Frank J (2013) Hepatitis‐C‐virus‐like internal ribosome entry sites displace eIF3 to gain access to the 40S subunit. Nature 503: 539–543. [DOI] [PMC free article] [PubMed] [Google Scholar]
- Hinnebusch AG (2006) eIF3: a versatile scaffold for translation initiation complexes. Trends Biochem Sci 31: 553–562 [DOI] [PubMed] [Google Scholar]
- Holcik M, Sonenberg N (2005) Translational control in stress and apoptosis. Nat Rev Mol Cell Biol 6: 318–327 [DOI] [PubMed] [Google Scholar]
- Huang B, Wei W, Wang G, Gaertig MA, Feng Y, Wang W, Li X‐J, Li S (2015) Mutant huntingtin downregulates myelin regulatory factor‐mediated myelin gene expression and affects mature oligodendrocytes. Neuron 85: 1212–1226 [DOI] [PMC free article] [PubMed] [Google Scholar]
- Ishiguro T, Sato N, Ueyama M, Fujikake N, Sellier C, Kanegami A, Tokuda E, Zamiri B, Gall‐Duncan T, Mirceta M, Furukawa Y, Yokota T, Wada K, Taylor JP, Pearson CE, Charlet‐Berguerand N, Mizusawa H, Nagai Y, Ishikawa K (2017) Regulatory role of RNA chaperone TDP‐43 for RNA misfolding and repeat‐associated translation in SCA31. Neuron 94: 108–124 e107 [DOI] [PMC free article] [PubMed] [Google Scholar]
- Juvonen V, Hietala M, Päivärinta M, Rantamäki M, Hakamies L, Kaakkola S, Vierimaa O, Penttinen M, Savontaus ML (2000) Clinical and genetic findings in Finnish ataxia patients with the spinocerebellar ataxia 8 repeat expansion. Ann Neurol 48: 354–361 [PubMed] [Google Scholar]
- Kai H, Shin R‐W, Ogino K, Hatsuta H, Murayama S, Kitamoto T (2012) Enhanced antigen retrieval of amyloid β immunohistochemistry: re‐evaluation of amyloid β pathology in Alzheimer disease and its mouse model. J Histochem Cytochem 60: 761–769 [DOI] [PMC free article] [PubMed] [Google Scholar]
- Kim JS, Son TO, Youn J, Ki CS, Cho JW (2013) Non‐ataxic phenotypes of SCA8 mimicking amyotrophic lateral sclerosis and Parkinson disease. J Clin Neurol 9: 274–279 [DOI] [PMC free article] [PubMed] [Google Scholar]
- Kim D, Langmead B, Salzberg SL (2015) HISAT: a fast spliced aligner with low memory requirements. Nat Methods 12: 357–360 [DOI] [PMC free article] [PubMed] [Google Scholar]
- van der Knaap MS, Pronk JC, Scheper GC (2006) Vanishing white matter disease. Lancet Neurol 5: 413–423 [DOI] [PubMed] [Google Scholar]
- Koob MD, Moseley ML, Schut LJ, Benzow KA, Bird TD, Day JW, Ranum LP (1999) An untranslated CTG expansion causes a novel form of spinocerebellar ataxia (SCA8). Nat Genet 21: 379–384 [DOI] [PubMed] [Google Scholar]
- Korzeniewski C, Callewaert DM (1983) An enzyme‐release assay for natural cytotoxicity. J Immunol Methods 64: 313–320 [DOI] [PubMed] [Google Scholar]
- Kumar N, Miller GM (2008) White matter hyperintense lesions in genetically proven spinocerebellar ataxia 8. Clin Neurol Neurosurg 110: 65–68 [DOI] [PubMed] [Google Scholar]
- Kuwamura M, Maeda M, Kuramoto T, Kitada K, Kanehara T, Moriyama M, Nakane Y, Yamate J, Ushijima T, Kotani T, Serikawa T (2002) The myelin vacuolation (mv) rat with a null mutation in the attractin gene. Lab Invest 82: 1279–1286 [DOI] [PubMed] [Google Scholar]
- Lee ASY, Kranzusch PJ, Cate JHD (2015) eIF3 targets cell‐proliferation messenger RNAs for translational activation or repression. Nature 522: 111–114 [DOI] [PMC free article] [PubMed] [Google Scholar]
- Lilja A, Hämäläinen P, Kaitaranta E, Rinne R (2005) Cognitive impairment in spinocerebellar ataxia type 8. J Neurol Sci 237: 31–38 [DOI] [PubMed] [Google Scholar]
- Mills JD, Kavanagh T, Kim WS, Chen BJ, Kawahara Y, Halliday GM, Janitz M (2013) Unique transcriptome patterns of the white and grey matter corroborate structural and functional heterogeneity in the human frontal lobe. PLoS One 8: e78480 [DOI] [PMC free article] [PubMed] [Google Scholar]
- Minnerop M, Weber B, Schoene‐Bake JC, Roeske S, Mirbach S, Anspach C, Schneider‐Gold C, Betz RC, Helmstaedter C, Tittgemeyer M, Klockgether T, Kornblum C (2011) The brain in myotonic dystrophy 1 and 2: evidence for a predominant white matter disease. Brain 134: 3530–3546 [DOI] [PMC free article] [PubMed] [Google Scholar]
- Mori K, Weng SM, Arzberger T, May S, Rentzsch K, Kremmer E, Schmid B, Kretzschmar HA, Cruts M, Van Broeckhoven C, Haass C, Edbauer D (2013) The C9orf72 GGGGCC repeat is translated into aggregating dipeptide‐repeat proteins in FTLD/ALS. Science 339: 1335–1338 [DOI] [PubMed] [Google Scholar]
- Moseley ML, Zu T, Ikeda Y, Gao W, Mosemiller AK, Daughters RS, Chen G, Weatherspoon MR, Clark HB, Ebner TJ, Day JW, Ranum LP (2006) Bidirectional expression of CUG and CAG expansion transcripts and intranuclear polyglutamine inclusions in spinocerebellar ataxia type 8. Nat Genet 38: 758–769 [DOI] [PubMed] [Google Scholar]
- Naranda T, MacMillan SE, Hershey JW (1994) Purified yeast translational initiation factor eIF‐3 is an RNA‐binding protein complex that contains the PRT1 protein. J Biol Chem 269: 32286–32292 [PubMed] [Google Scholar]
- Ogata A, Terae S, Fujita M, Tashiro K (1998) Anterior temporal white matter lesions in myotonic dystrophy with intellectual impairment: an MRI and neuropathological study. Neuroradiology 40: 411–415 [DOI] [PubMed] [Google Scholar]
- Robinson JT, Thorvaldsdóttir H, Winckler W, Guttman M, Lander ES, Getz G, Mesirov JP (2011) Integrative genomics viewer. Nat Biotechnol 29: 24–26 [DOI] [PMC free article] [PubMed] [Google Scholar]
- Sauert M, Temmel H, Moll I (2015) Heterogeneity of the translational machinery: Variations on a common theme. Biochimie 114: 39–47 [DOI] [PMC free article] [PubMed] [Google Scholar]
- Schmahmann JD, Smith EE, Eichler FS, Filley CM (2008) Cerebral white matter: neuroanatomy, clinical neurology, and neurobehavioral correlates. Ann N Y Acad Sci 1142: 266–309 [DOI] [PMC free article] [PubMed] [Google Scholar]
- Shi J, Kahle A, Hershey JWB, Honchak BM, Warneke JA, Leong SPL, Nelson MA (2006) Decreased expression of eukaryotic initiation factor 3f deregulates translation and apoptosis in tumor cells. Oncogene 25: 4923–4936 [DOI] [PubMed] [Google Scholar]
- Sreedharan J, Blair IP, Tripathi VB, Hu X, Vance C, Rogelj B, Ackerley S, Durnall JC, Williams KL, Buratti E, Baralle F, de Belleroche J, Mitchell JD, Leigh PN, Al‐Chalabi A, Miller CC, Nicholson G, Shaw CE (2008) TDP‐43 mutations in familial and sporadic amyotrophic lateral sclerosis. Science 319: 1668–1672 [DOI] [PMC free article] [PubMed] [Google Scholar]
- Stone J, Smith L, Watt K, Barron L, Zeman A (2001) Incoordinated thought and emotion in spinocerebellar ataxia type 8. J Neurol 248: 229–232 [DOI] [PubMed] [Google Scholar]
- Todd PK, Oh SY, Krans A, He F, Sellier C, Frazer M, Renoux AJ, Chen KC, Scaglione KM, Basrur V, Elenitoba‐Johnson K, Vonsattel JP, Louis ED, Sutton MA, Taylor JP, Mills RE, Charlet‐Berguerand N, Paulson HL (2013) CGG repeat‐associated translation mediates neurodegeneration in fragile X tremor ataxia syndrome. Neuron 78: 440–455 [DOI] [PMC free article] [PubMed] [Google Scholar]
- Wells GA, Wells M (1989) Neuropil vacuolation in brain: a reproducible histological processing artefact. J Comp Pathol 101: 355–362 [DOI] [PubMed] [Google Scholar]
- Yokoyama T, Ishiyama M, Hasegawa K, Uchihara T, Yagishita S (2014) Novel neuronal cytoplasmic inclusions in a patient carrying SCA8 expansion mutation. Neuropathology 34: 27–31 [DOI] [PubMed] [Google Scholar]
- Zeman A, Stone J, Porteous M, Burns E, Barron L, Warner J (2004) Spinocerebellar ataxia type 8 in Scotland: genetic and clinical features in seven unrelated cases and a review of published reports. J Neurol Neurosurg Psychiatry 75: 459–465 [DOI] [PMC free article] [PubMed] [Google Scholar]
- Zhou M, Sandercock AM, Fraser CS, Ridlova G, Stephens E, Schenauer MR, Yokoi‐Fong T, Barsky D, Leary JA, Hershey JW, Doudna JA, Robinson CV (2008) Mass spectrometry reveals modularity and a complete subunit interaction map of the eukaryotic translation factor eIF3. Proc Natl Acad Sci USA 105: 18139–18144 [DOI] [PMC free article] [PubMed] [Google Scholar]
- Zu T, Gibbens B, Doty NS, Gomes‐Pereira M, Huguet A, Stone MD, Margolis J, Peterson M, Markowski TW, Ingram MA, Nan Z, Forster C, Low WC, Schoser B, Somia NV, Clark HB, Schmechel S, Bitterman PB, Gourdon G, Swanson MS et al (2011) Non‐ATG‐initiated translation directed by microsatellite expansions. Proc Natl Acad Sci USA 108: 260–265 [DOI] [PMC free article] [PubMed] [Google Scholar]
- Zu T, Liu Y, Bañez‐Coronel M, Reid T, Pletnikova O, Lewis J, Miller TM, Harms MB, Falchook AE, Subramony SH, Ostrow LW, Rothstein JD, Troncoso JC, Ranum LP (2013) RAN proteins and RNA foci from antisense transcripts in C9ORF72 ALS and frontotemporal dementia. Proc Natl Acad Sci USA 110: E4968–E4977 [DOI] [PMC free article] [PubMed] [Google Scholar]
- Zu T, Cleary JD, Liu Y, Bañez‐Coronel M, Bubenik JL, Ayhan F, Ashizawa T, Xia G, Clark HB, Yachnis AT, Swanson MS, Ranum LPW (2017) RAN translation regulated by muscleblind proteins in myotonic dystrophy type 2. Neuron 95: 1292–1305 e1295 [DOI] [PMC free article] [PubMed] [Google Scholar]
Associated Data
This section collects any data citations, data availability statements, or supplementary materials included in this article.
Supplementary Materials
Expanded View Figures PDF
Source Data for Expanded View
Review Process File
Source Data for Figure 5