Abstract
The fidelity of protein synthesis is largely dominated by the accurate recognition of transfer RNAs (tRNAs) by their cognate aminoacyl-tRNA synthetases. Aminoacylation of each tRNA with its cognate amino acid is necessary to maintain the accuracy of genetic code input. Aminoacylated tRNAMet functions in both initiation and elongation steps during protein synthesis. As a precursor to the investigation of a methionyl-tRNA synthetase–tRNAMet complex, presented here are the results of molecular dynamics (MD) for single nucleotide substitutions in the D-loop of tRNAMet (G15A, G18A, and G19A) probing structure/function relationships. The core of tRNAMet likely mediates an effective communication between the tRNA anticodon and acceptor ends, contributing an acceptor stem rearrangement to fit into the enzyme-active site. Simulations of Escherichia coli tRNAMet were performed for 1 μs four times each. The MD simulations showed changes in tRNA flexibility and long-range communication most prominently in the G18A variant. The results indicate that the overall tertiary structure of tRNAMet remains unchanged with these substitutions; yet, there are perturbations to the secondary structure. Network-based analysis of the hydrogen bond structure and correlated motion indicates that the secondary structure elements of the tRNA are highly intraconnected, but loosely interconnected. Specific nucleotides, including U8 and G22, stabilize the mutated structures and are candidates for substitution in future studies.
Introduction
Transfer RNA (tRNA) is the adaptor molecule proposed originally by Francis Crick to connect the nucleic acid information with the polypeptide output.1 tRNAs are stable noncoding RNA molecules approximately 76 nucleotides long that enable translation of an mRNA to the corresponding polypeptide according to the genetic code.2 They form a conserved cloverleaf secondary structure (e.g., Supporting Information Figure S1), and more importantly, the tRNA helices coaxially stack to form a distinct L-shape tertiary structure (Figure 1). There are 20 canonical tRNA families that are recognized by their cognate aminoacyl-tRNA synthetases (AARSs) for the synthesis of aminoacyl-tRNA. Most AARSs recognize one or more tRNA anticodon (AC) nucleotides [in addition to the nucleotides in the acceptor stem (AS)] as specificity determinants, and allostery likely occurs to properly position the tRNA 3′-end in the enzyme catalytic site (Figure 1).1,3
Figure 1.
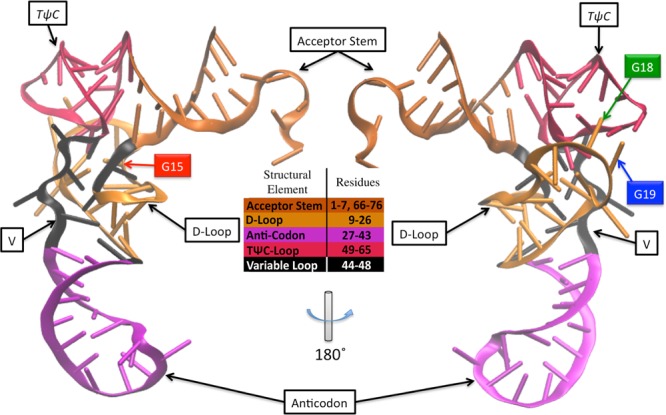
Tertiary structure of E. coli tRNAMet. The structure was built from the A. aeolicus tRNAMet structure (PDB 2CSX) and the E. coli tRNACys structure (PDB 1U0B). The colors correspond to the secondary structure elements as shown. The mutated residues G15 (red), G18 (green), and G19 (blue) are highlighted for clarity.
Methionyl-tRNA synthetase (MetRS) aminoacylates tRNAMet for efficient decoding at both the translational start and within a message.4,5 Aminoacylation of tRNAMet occurs in two catalytic steps. First, MetRS binds ATP and methionine in its active site to catalyze the formation of the methionyl adenylate (Met-AMP) intermediate. In the second step, the activated amino acid is transferred to the ribose 2′-hydroxyl group on the tRNA 3′-terminal adenosine in an esterification reaction.6 The AC stem of tRNAMet is thought to first interact with MetRS at its AC-binding domain, approximately 50 Å away from the enzyme’s active site.6,7 The AS of tRNAMet is presumed to undergo a conformational change to fit into the MetRS active site, although the capture of such a structure by X-ray crystallography has proved elusive.8,9 The transiently unwound 3′-end is likely short-lived and not thermodynamically stable, which makes structural characterization difficult.9 A 105-fold decrease in kcat/KM occurs when Trp-461, in the MetRS AC-binding domain, is mutated to alanine, indicating that the AC is a strong identity element for MetRS.4 It is thought that tRNA signal transfer occurs, at least in part, through core nucleotides for an efficient aminoacylation to take place, although little is known about the pathway through which this signaling occurs,10 that is, it is unknown which particular nucleotides within the tRNAMet are important for a long-range communication between the AC binding and catalytic sites, although the nucleotides in the tRNA core may well mediate this communication. To examine this hypothesis, substitutions were made to the conserved D-loop nucleotides that contribute to the core stability but not the Watson–Crick hydrogen bonding in helical regions.
Variants discussed herein are the guanine-to-adenine single-nucleotide substitutions in the Escherichia coli tRNAMet D-loop at the conserved positions 15, 18, and 19 (Figure 1), with the base numbering according to the tRNAdb.11 The E. coli tRNAMet G15:C48 base pair has a reverse Watson–Crick hydrogen bonding, known as a Levitt pair.12 The G15:C48 pair is the so-called Levitt pair, which has a reverse Watson–Crick geometry and is stabilized by Mg2+ binding.6,12 The GG motif in the D-loop is evolutionarily conserved; the hydrogen bonding between the G18:U55 and G19:C56 pairs contributes to the tertiary structure in the tRNA core.13 The importance of these nucleotides in the long-range communication has not been explicitly investigated. In this work, we targeted these conserved bases for computational analysis because they are not in helical (secondary structure) regions but instead are part of the tRNA core (tertiary structure). This work will set the stage for the experimental and computational analysis of the tRNA in complex with its cognate methionyl-tRNA synthetase.
An atomic comparison of the substitutions is shown in Figure 2. The G15A variant disrupts the normal reverse Watson–Crick hydrogen base pairs, and part a of Figure 2 shows a rearrangement of the nucleotide, C48, to accommodate the flipped amide group between guanine and adenine. In the middle pane, the wild type (WT) G18:U55 pair is shown next to A18:U55, and where the WT can form multiple hydrogen bonds with the oxygen atom of Uracil, the variant can form only one. In the bottom pane showing the WT compared to G19A, adenosine has bent away from the C56 base pair, leaving a 5 Å gap between the nearest atoms across the pair.
Figure 2.
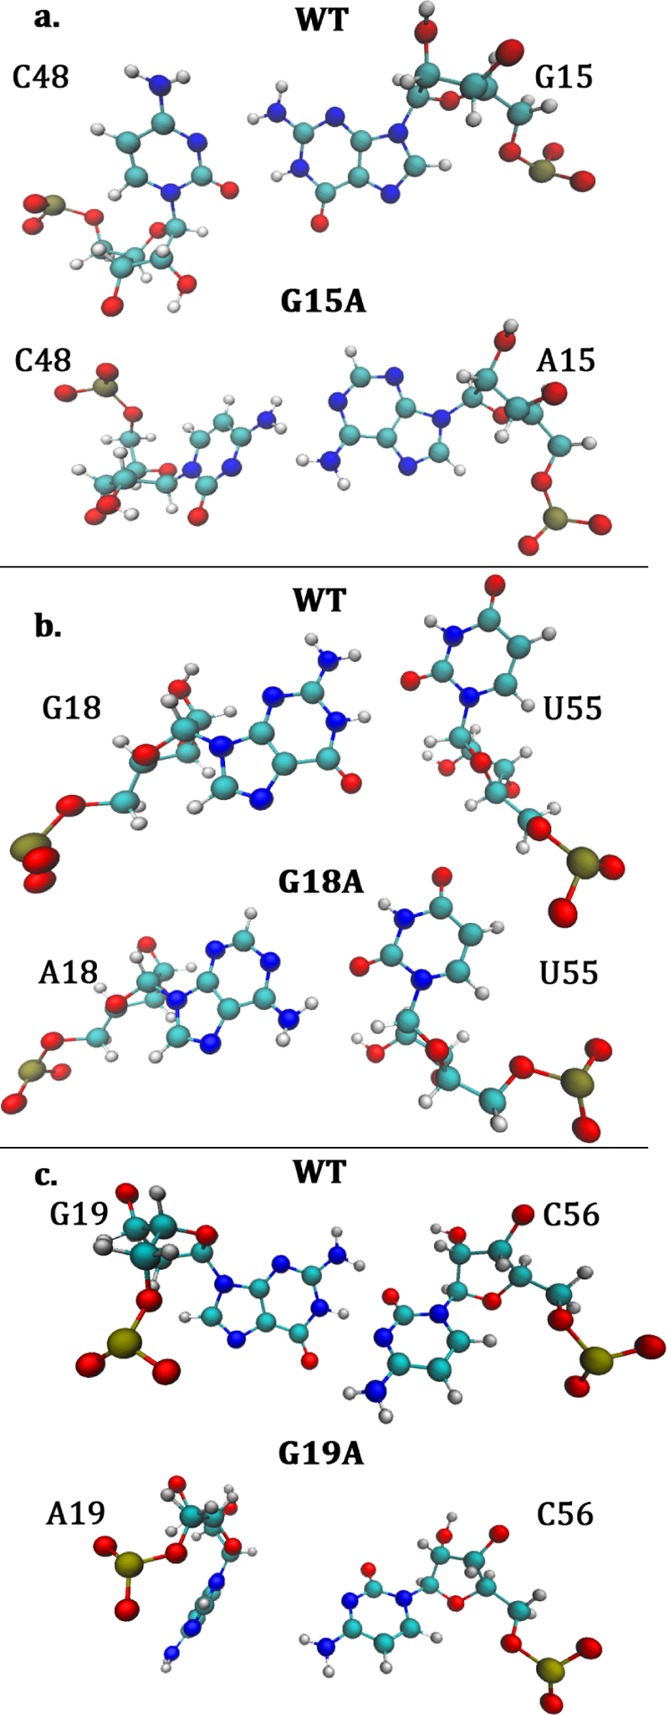
Comparison of nucleotide substitutions to WT. Each of the three panels compares the base pair of the WT nucleotide to that of the substitution. In panel (a), the G15 WT is shown above the A15A variant; in panel (b), the G18 of WT is shown above the A18 variant; and in panel (c), the G19 of WT is shown above the A19 variant. Each image was taken from the energy-minimized starting structure.
Molecular dynamics (MD) simulations were employed to model E. coli tRNAMet in silico with single nucleotide substitutions in the core. Subsequent analyses were used to identify the changes in the tRNAMet structure and flexibility as a result of these substitutions. The simulations showed the the tRNA core variants display changes in long-range communication and flexibility, while maintaining the overall tertiary structure. The altered hydrogen-bonding patterns observed upon base substitutions suggest other nucleotides that may operate as hubs for communication within the tRNA core. The comparisons of hydrogen bond networks (which highlight structurally critical bases) to the network analysis of correlation matrices (which highlight dynamically critical bases) expose the likely modes for structure/function relationships.
Results
G18A Variant Shows Largest Core Fluctuations
RMSF is the root-mean-square fluctuation at each C1′ atom from a time-averaged structure throughout a trajectory and is the primary measure of biomolecule flexibility. An increase in flexibility was expected in the tRNA loops and at the AS compared to the helical regions based on previous MD studies of yeast tRNAMet and E. coli tRNAPhe.14,15 This was also observed for the WT tRNAMet (Figure 3).
Figure 3.
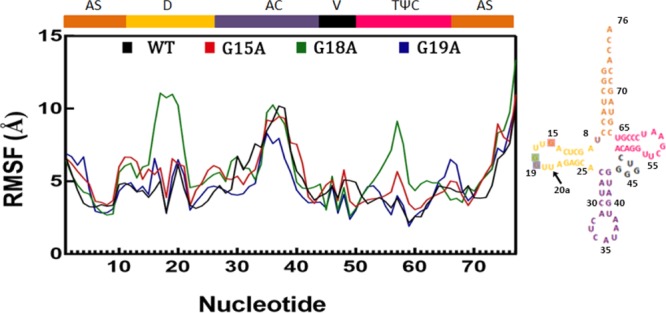
RMSFs of tRNAMet. The major secondary structure elements are labeled across the top and colored according to the cloverleaf structure to the right, with the highlighted bases colored according to the substitution. The WT fluctuations are shown in black, G15A in red, G18A in green, and G19A in blue. The secondary structure regions include the AS, the D-loop (D), the AC, the variable-loop (V), and the TψC-loop, which are color-coded per the legend above the plot.
In Figure 3, the G18A variant shows the largest deviation from the WT fluctuations, particularly in the D-loop and the TψC-loop. RMSF of the G18A variant increases to over 10 Å in the D-loop at the point of substitution, whereas all other RMSFs decrease to less than 5 Å at the 18th nucleotide. Compared to the other tRNAs previously studied, an increase to 10 Å is a significant increase.14,15 From residues 17–20, the G18A substitution directly affects the local environment, where the other two variants more closely resemble that of the WT tRNA. In the AC region, all four configurations have a peak centered about the CAU AC, although G19A exhibits a less AC fluctuation. In the TψC-loop, two variants (namely G15A and G18A) display increased fluctuations at the 58th residue; yet, the magnitude of the G18A increase is double that of WT.
Conformational Clustering Highlights Stability of G19A
Quality threshold (QT) clustering was used to identify the most conformationally similar structures, as well as to determine the extent to which the tRNA variants access overlapping sets of conformations. By concatenating all the trajectories together and clustering on a common set of atoms, one can readily compare the structural similarities and differences for the four different variants. The minimum cluster diameter was found by minimizing the number of unclustered frames when scanning over the trajectories in 0.1 Å increments.
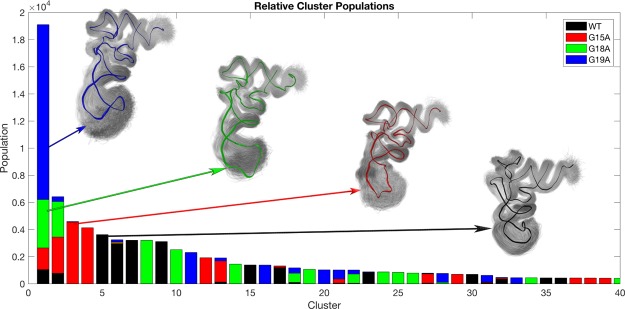
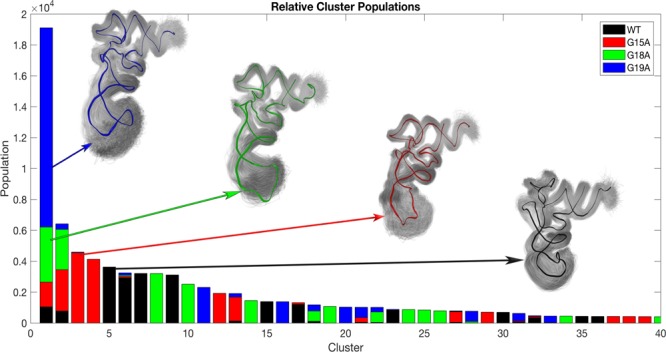
The clusters in Figure 4 represent the dominant conformations for the backbone atoms of all 16 μs (4 variants times 4 μs each) concatenated together as well as their distribution within each of the first 40 clusters, comprising 80.9% of the simulation frames. For each structural image, with the exception of G18A, the median-colored structure is surrounded by a superposition of partly transparent conformations within 1σ of the distribution. Because G18A (green) conformations occur most frequently in the first cluster, the median structure of which belongs to the G19A simulations, the colored conformation is the first conformation in cluster 1 of the G18A simulations.
Figure 4.
QT clustering. The combined clustering uses a distance cutoff of 4.3 Å. The structures of the largest population and its distribution are highlighted (coloring consistent with Figure 3). The G19A variant provides the largest contribution to the most populated cluster at 67%. The G18A variant is also represented most frequently in the first cluster, with the G15A in the third cluster, and WT in the fifth.
The G19A variant dominates the most populated cluster, contributing 67.5% of the frames to the first cluster and encompassing more than 76% of the G19A (4 μs) trajectory space. The AC of cluster 1 has a large shaded region, indicating the positional variability of that region. The WT configuration contributes the fewest frames to the dominant cluster and is distributed primarily across the clusters 5, 6, 7, and 9. It maintains the helical portion of the AS and a distinct D-loop (on the left of the cluster conformations), and there is a small loop just after the AC base sequence. Additionally, the WT TψC-loop shows a distinct conformation compared to each of the three variants at the top left of the black cluster (Figure 4). The G15A variant is most populated in cluster 3 and reveals a clear distortion near U8 in the inside fold of the L-shaped structure.
This clustering analysis reveals both that the tertiary structure is maintained in all simulations and that the single-stranded AS bases 74–76 and the AC regions are highly flexible (Figure 3).
Clustering of each independent 4 μs trajectory was also performed. Shown in Supporting Information Figure S4 are the WT tRNA conformation samples the first four clusters, often with 18% in the first cluster and 58% of conformations in the first four clusters combined. The dominant G19A conformation persists in 51% of the simulations, making it the most stable of the individually clustered configurations. Outside of the first 10 clusters, no conformation has more than 2% of the frames in a single cluster, indicating the high diversity of conformational sampling for the tRNA variants.
Hydrogen Bond Networks Highlight Important Secondary Structure Domains
The hydrogen bonds between Watson–Crick and wobble base pairs define the tRNA cloverleaf secondary structure. The hydrogen bonds most persistent throughout the simulations provide insight into which particular bonds are most important in stabilizing the canonical structure. Examining each variant and WT separately, persistent hydrogen bonds (e.g., those included in Figure 5) are those with the donor–acceptor pair distance less than 3.2 Å and with the donor–hydrogen–acceptor angles greater than 120° and present during 50% of the trajectory. The hydrogen bond network diagrams were made to facilitate visualizing nucleotide connectivity (Figure 5). The multiple edges between the nodes indicate that there are multiple donor–acceptor pair combinations between those two residues. This could include the same donor atom coordinating with two different acceptors (bifurcated hydrogen bond) or two completely different donor–acceptor pairs. In Figure 5, one can readily identify the bonds that support the cloverleaf structure commonly shown in the stems of 2D representations, as the nodes are colored by the secondary structure domain, consistent with Figure 1. Within the TψC-loop and the D-loop, which combine to constitute the elbow of the tRNA, WT, G15A, and G19A have more persistent hydrogen bonds than does G18A. Specifically, nucleotide 18 no longer forms hydrogen bonds with U56 as a result of the G18A substitutions, whereas a G18:U56 pair exists in the other three configurations, as shown (green triangles) in Figure 5 (additional union and intersection hydrogen bond networks are available in Supporting Information Figure S5). Similarly, there were no persistent hydrogen bonds with G15A for its single nucleotide substitution. The G15:C48 Levitt pair is revealed as dynamic in the WT tRNAMet, as it is not present at the >50% threshold despite its persistence in the G18A and G19A variants. As Mg2+ was absent in these simulations, this result is consistent with the experimental results, indicating the Levitt pair is stabilized by that ion.6 Specifically, in the WT simulations, the complete Levitt pair (both hydrogen bonds present) for G15:C48 was only present 17.7% of the time. Only in the WT configuration were there hydrogen bonds with the G19 nucleotide, suggesting that it is more susceptible to small perturbations than the G18 nucleotide, for example.
Figure 5.
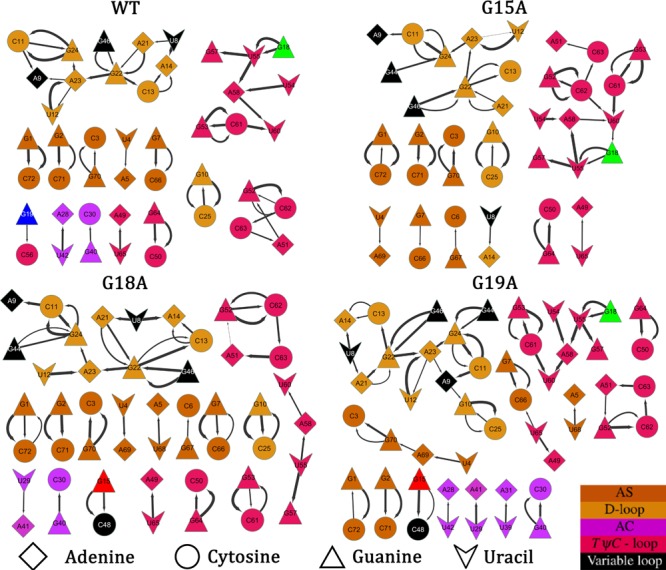
Hydrogen bond networks of tRNAMet variants across 4 μs of simulation. Clockwise from the top left are WT, G15A, G19A, and G18A. Each directed edge (from donor to acceptor) represents a bond present in more than 50% of the simulations. The edges are weighted by percent occupancy, where the thicker lines represent more persistent bonds. The node shape indicates the particular nucleotides, where diamonds represent adenine, circles cytosine, triangles guanine, and arrows uracil. The nodes are colored consistent with Figures 1 and 3, except in the case of variants, which are colored red(G15), green (G18), and blue (G19).
Although each set of simulations (WT and three variants) has a unique network of bonds, there is an overlap between them (Supporting Information Figure S5). In WT, the largest group consists of 11 nodes. In particular, residue G22 connects this large group together with the backbone hydrogen bonds. The G22–A23 bond appears in each configuration of Figure 5 as a single donor–acceptor pair that connects two different groups, ultimately forming the largest network in both the union and intersection depictions of Figure S5. In addition to the backbone bonds, there are two additional bonds of potential importance with G22, those with C13 and G46, as they establish key stacking interactions in the core.
Correlation Networks Show Long- and Short-Range Relationships
Correlated motion analysis highlights the nucleotides (and atoms therein) that have common movements capable of propagating an allosteric signal. The correlated motions of the WT tRNAMet show distinct signatures, including long-range correlations connecting different parts of the tRNA.
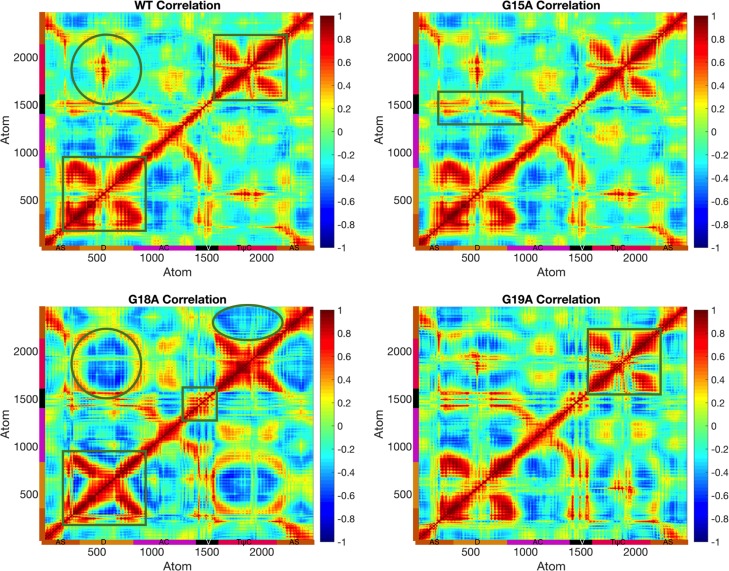
First, looking at the short-range WT tRNAMet correlations (boxes along the diagonal of the WT portion of Figure 6), it is clear that the D-loop and TψC-loop are each well-coordinated with themselves, as shown in the two boxed regions of the WT portion of Figure 6, consistent with the hydrogen bond results in Figure 5. These strong signals in the core domains persist in all the substitutions, but are weakest in the G18A variant. There is a correlation signal present in all configurations that propagates perpendicularly from the backbone signature in the AC. An anticorrelation between the AC and the D-loop is present in all configurations, with the most significant perturbations again occurring in the G18A variant, most clearly seen in Figure 6.
Figure 6.
All-atom correlated motions of the WT tRNA and each variant. Clockwise from top left are WT, G15A, G19A, and G18A. The G18A mutation shows the most drastic changes, switching to an anticorrelation between the D-loop and the TψC-loop, highlighted by circles. The squares highlight the regions of locally strong correlation patterns.
Moving toward longer-range correlations, the variable region (black) shows long-range correlations across the AS, D-loop, and AC, highlighted by a box in G15A of Figure 6. An additional region of long-range anticorrelation appears in all configurations between the AS and the D-loop that most clearly show up in the results of Figure 7, which shows correlated motions greater than |Cij| ≥ 0.5, physically connected with the cylinders to highlight the long-range interactions.
Figure 7.
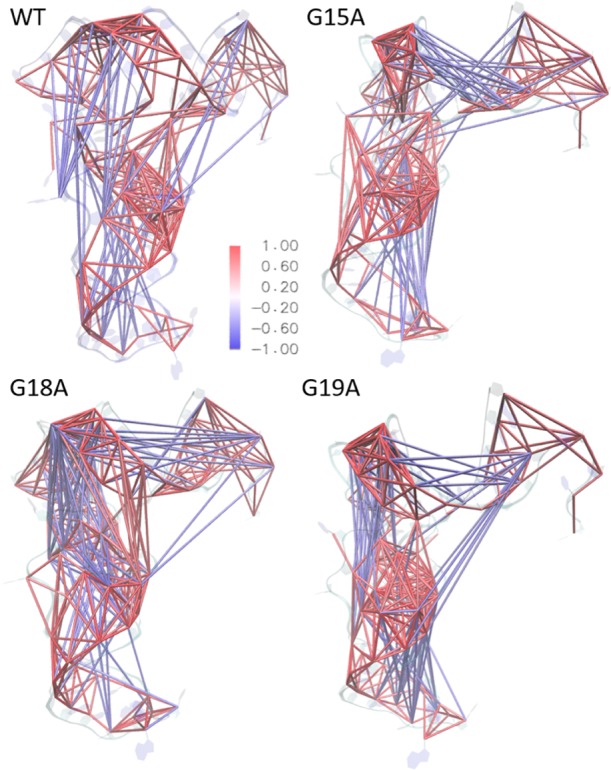
Correlation network of tRNAMet projected onto structures. The connections of the most strongly (anti)correlated motions between C1′ are shown projected onto the structures. The positively correlated motions are colored red and negatively correlated motions are blue. The atom pairs are connected only if the correlations satisfy |Cij| ≥ 0.5.
The most drastic change in correlation signatures is apparent on comparing the G18A variant and WT between the D-loop and the TψC-loop. In the WT tRNAMet, there exists a small highly correlated pocket (circled in Figure 6); yet, in the G18A substitution, a large pocket of anticorrelated motion is surrounded by a circle of correlated motion in this region. This unique signature shows again that the G18A variant deviates the most from WT and suggests that this is the variant most capable of disrupting the normal regulatory function.
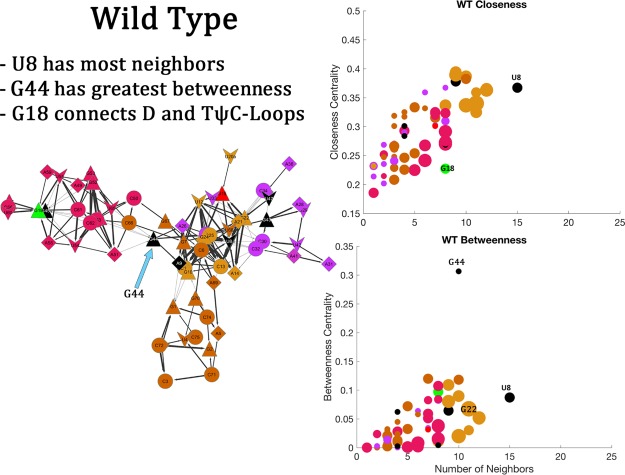
Figure 8 shows a network of the correlated motions to highlight the dynamical similarities and variations. The edges are represented in the red and blue cylinders of Figure 7. To quantify the important components of the network, we calculated the betweenness and closeness centrality of the network nodes (bases), as shown in Figures 8 through 11. Betweenness is a network centrality measure based on the shortest paths between each pair of nodes, where a larger betweenness means there are more shortest paths through a particular node. Closeness, on the other hand, uses the shortest paths to determine how near each node is to all other nodes. Here, the WT correlation network largely separates the secondary structural elements, but groups G18 far from its own secondary structure with the TψC-loop (Figure 8). In the WT configuration, G44 shows the largest betweenness centrality (0.3) by more than double that of the other residues (Figure 8). U8 has the highest degree (count node edges) for the WT configuration. A number of D-loop nodes have high closeness values and are centrally located in the spring-embedded layout. G19 did not meet the criteria to appear on the WT correlation network, whereas G18 and G15 did, but have relatively low betweenness and closeness values.
Figure 8.
WT correlation network analysis. The correlation networks show each node color-coded by the tRNA secondary structure or variant consistent with the previous figures. The nodes are connected when the correlations satisfy |Cij| ≥ 0.5. The betweenness and closeness plots as a function of the number of neighbors highlight whether a nucleotide is important to regulating dynamic allostery. In each plot, the points are colored by secondary structure, and the size is determined by the number of hydrogen bonds corresponding to that node, where a larger diameter indicates more hydrogen bonds. Select bases are labeled by their corresponding data points.
Figure 11.
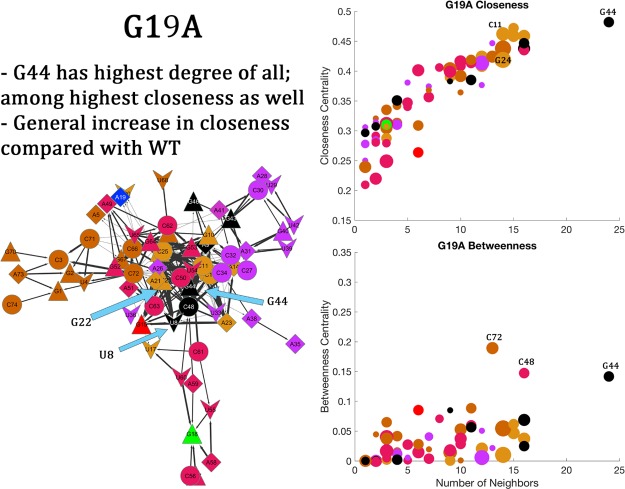
G19A correlation network analysis. The correlation networks show each node color-coded by the tRNA secondary structure or variant, consistent with the previous figures. The nodes are connected when the correlations satisfy |Cij| ≥ 0.5. The betweenness and closeness plots as a function of the number of neighbors highlight whether a nucleotide is important to regulating dynamic allostery. In each plot, the points are colored by the secondary structure, and the size is determined by the number of hydrogen bonds corresponding to that node, where a larger diameter indicates more hydrogen bonds. Select bases are labeled by their corresponding data points.
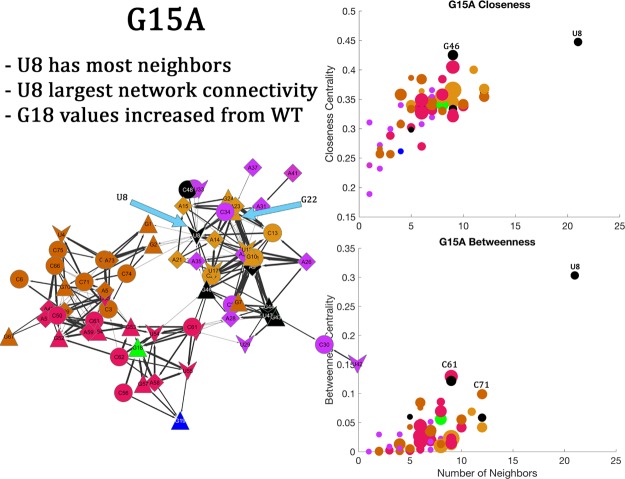
The G15A variant shows a clear perturbation from the WT network, while still largely grouping like secondary structural elements together (Figure 9). The degree of U8 increased to 22 and now has the highest betweenness and closeness values and has neighbors from the AS, the D-loop, TψC-loop, and the variable region (Figure 9). G46 and C61 have the next highest closeness, whereas the G18 residue has an approximately average closeness and interacts exclusively with the TψC-loop. Instead of having a core region with independent “arms” like the WT, the network topology of the G15A variant is decentralized into two loosely connected main groups, one containing the D-loop and the AC-loop and the other with the TψC-loop and the AS.
Figure 9.
G15A correlation network analysis. The correlation networks show each node color-coded by the tRNA secondary structure or variant, consistent with the previous figures. The nodes are connected when the correlations satisfy |Cij| ≥ 0.5. The betweenness and closeness plots as a function of the number of neighbors highlight whether a nucleotide is important to regulating dynamic allostery. In each plot, the points are colored by secondary structure, and the size is determined by the number of hydrogen bonds corresponding to that node, where a larger diameter indicates more hydrogen bonds. Select bases are labeled by their corresponding data points.
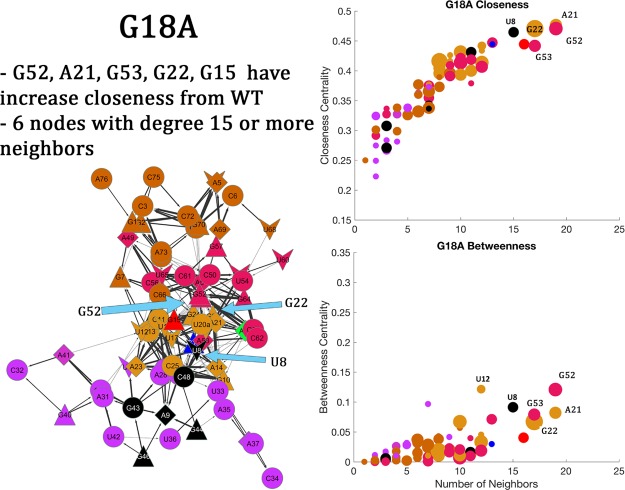
On the other hand, the G18A network generally condenses down to a more intraconnected topology (Figure 10). The betweenness for all the nodes of G18A (Figure 10) drops as compared to WT and even G15A, whereas the closeness increases on the whole. Again, U8 shows a high closeness and a relatively large degree, and A21, G52, and G22 show increased closeness as a result of this nucleotide substitution, as shown in Figure 10. Similarly, the G19A network shows a more compact topology compared to WT, with decreased betweenness and increased closeness (Figure 11). In this configuration, G44 is the residue with the highest closeness and degree.
Figure 10.
G18A correlation network analysis. The correlation networks show each node color-coded by the tRNA secondary structure or variant, consistent with the previous figures. The nodes are connected when the correlations satisfy |Cij| ≥ 0.5. The betweenness and closeness plots as a function of the number of neighbors highlight whether a nucleotide is important to regulating dynamic allostery. In each plot, the points are colored by the secondary structure, and the size is determined by the number of hydrogen bonds corresponding to that node, where a larger diameter indicates more hydrogen bonds. Select bases are labeled by their corresponding data points.
Discussion
To date, little is known about how long-range communication is facilitated in tRNAs. Leveraging advances in simulation hardware and software, our simulations probe the microsecond timescale, enabling larger phase space sampling and more meaningful interpretation of the results. A total of 16 μs of MD simulations provide details about the possible structure–function relationships of the E. coli tRNAMet molecule. Ghosh and Vishveshwara16 presented a thorough analysis of the nanosecond MD simulations of a MetRS–tRNAMet complex model and used correlation network analysis to predict the allosteric regulation pathways for the protein and tRNA. Here, we applied a similar correlation-based network analysis of the tRNA to examine it in isolation and discern the dynamic consequences of the base substitutions independent of MetRS binding. This current work sets the stage for the experimental and computational analysis of the E. coli MetRS–tRNAMet complex currently underway.
Comparisons of the all-atom MD simulations of G15A, G18A, and G19A tRNAMet variants highlight how a single nucleotide substitution perturbs the structure and dynamics from the WT behavior. The tertiary structure is maintained throughout all simulations; yet, there are distinct patterns of hydrogen bonds and correlation distinguishing each configuration. Overall, the largest deviation from the WT behavior occurs in the G18A variant, whereas G15A deviates the least. The hydrogen bonds that persist in all four configurations indicate the bonds essential for maintaining the tertiary structure. Although none of the single substitutions fully disrupts the structure or correlations, any further loss of hydrogen bonding may push the structure beyond a stability threshold.
G18A Variant Deviates Most from WT Behavior
The G18A variant consistently exhibits the largest deviation from the WT tRNAMet. The most distinct deviations appear in the D-loop and TψC-loop, for example, showing increased fluctuations (Figure 3) and strongly anticorrelated regions in the core (Figures 6 and 7). Although the G18A base substitution disrupted the inner workings of the RNA, the overall tertiary structure was relatively unchanged. The conformational change highlighted in Supporting Information Figure S6 is largely responsible for the deviations shown in Figure 3.
Previous studies indicate that the nucleotides 13, 22, and 46 form an integral base triple in tRNACys.17 Mutations at the tRNACys 13:22 base pair disrupts the 15:48 base pair and impairs aminoacylation.18 Our hydrogen-bonding network analysis suggests that this base triple, especially nucleotide G22, is also important in tRNAMet and would be a candidate for substitution in the future. G18 and G22 in tRNAMet communicate with one another in this network, and double substitutions may elucidate more of the communication network within the tRNA core.
Core Substitutions Disrupt Secondary But Not Tertiary Structure
The most highly sampled conformations maintain the canonical L-shaped tertiary structure essential for the aminoacylation and decoding functions of tRNA (Figure 4). Even the rarely sampled configurations (higher order cluster representatives and unclustered structures) retain the overall tertiary structure but show variation in the core, AC, and variable region orientations. Although there are conformational alterations, they primarily occur in the D-loop and TψC-loop, away from the functionally essential AC and AS locations.
The largest apparent conformational rearrangement of the core occurs in the G18A variant. This disparate behavior occurred in just one of the four G18A simulations, in which the core rearrangement is characterized by a separation of the D-loop from the TψC-loop, as shown in Supporting Information Figure S6. The L-shaped tertiary structure remains intact, but the large core rearrangement between the D-loop and the TψC-loop contributes to the atypical quantitative results throughout.
Nucleotides U8 and G22 Are Key Communication Hubs
The detailed hydrogen bond and correlation analyses have identified the nucleotides that appear critical for the tRNAMet dynamics and allostery, for example, the highly conserved residues U8 and G22. Nucleotide U8 persisted as a hydrogen bond donor for A14 and as a hub for allosteric communication, as shown in the correlation and the corresponding network analysis in all simulations (8–11). The role of E. coli tRNAMet U8 in aminoacylation has not been explicitly investigated, although a U8C mutation in human mitochondrial tRNAMet (hmtRNAMet) has been shown to cause mitochondrial myopathy.19 hmtRNAMet is intrinsically less stable than E. coli tRNAMet, as it lacks guanosines at positions 18 and 19, giving it a shorter D-loop and fewer hydrogen bonding and stacking interactions at the core;20 nevertheless, it is able to be aminoacylated both by its cognate enzyme and by E. coli MetRS.21 Previous biochemical and biophysical works showed that in the context of the weaker mitochondrial tRNAMet structure, the U8C substitution further decreased the secondary and tertiary interactions and significantly decreased the aminoacylation efficiency.21 It should be noted that U8 is typically modified to 4-thioU in bacterial tRNAs; this modification is a sensor for cellular UV damage.22 Our computational study considered only the unmodified version of tRNAMet, as the crystal structures used for MD were solved with tRNA transcripts. The MetRS enzymes evaluated to date are able to aminoacylate the tRNA transcripts,23 and indeed the Aquifex aeolicus MetRS:tRNAMet crystal structure reveals no contacts between the enzyme and U8.2
Although the simulations reveal changes in flexibility and connectivity upon the introduction of single nucleotide substitutions in the D-loop, they may not be dramatic enough to disrupt the function. Substitutions to G18 and G19, which normally interact with the TψC-loop, show a reduced network topology, in that there are an increasing number of average neighbors and a decreasing network diameter (Table S1). A variant with two substitutions, including one core residue and another high centrality residue from the correlation network (such as U8), may well disrupt a functional biopolymer, in much the same way that the U8C mutation leads to a disease phenotype in the structurally tenuous hmtRNAMet.
Conclusions
In this study, by modeling the E. coli tRNAMet via MD with nucleotide substitutions at G15, G18, and G19, the overall structure remains unchanged, whereas clear differences appear in the local structure and dynamics. By configuring MD simulations with single nucleotide substitutions at the known conserved residues, we discern conformational dynamics in atomic detail and hypothesize as to its functional impact. Overall, the tertiary structure is preserved in silico for WT and three mutated configurations. The data suggest that although there are local changes to the structure and dynamics within the vicinity of the substitution, the G15A and G19A variants closely resemble the overall dynamics of the WT tRNAMet. As such, the conformational variability of tRNA may well allow it to remain functional despite the small, single-point perturbations in particular locations. “On the other hand, the G18A variant shows that the disruption caused by this substitution has a larger impact on the long-range interactions of the polynucleotide. The disconnection of the D-loop to the TψC-loop normally mediated by G18A alters the mobility and the correlation compared to the WT tRNA and two other variants.
Materials and Methods
Simulation Setup and Execution
The E. coli tRNAMet structure was built from the A. aeolicus tRNAMet crystal structure coordinates (unmodified tRNA transcript, MetRS–tRNA complex PDB 2CSX) solved at 2.7 Å resolution.2 The E. coli sequence was substituted for the A. aeolicus sequence using multiscale modeling tools for structural biology.24 The three nucleotides missing from the 3′-end of the tRNA in 2CSX were modeled into the A. aeolicus tRNA crystal structure coordinates using an E. coli tRNACys structure (CysRS–tRNA complex PDB 1U0B).25 The A. aeolicus geometries and coordinates were used to build the starting E. coli tRNAMet structure shown in Figure 1. The CHARMM36 force-field parameters26,27 with the NAMD software package28 were used to energy-minimize the starting structure to eliminate the steric clashes and optimize the starting reference structure.
Each energy-minimized structure, with a unique set of initial conditions, was set in a water box with dimensions (87 × 78 × 73) Å, and a particle mesh Ewald approximation was used for long-range electrostatics with a grid size of (88 × 78 × 74) Å.29 The all-atom simulations were performed for 1 μs in quadruplicate on graphical processing units after an additional minimization using ACEMD’s parallelized MD package.30 All production simulations were carried out under NPT conditions.31 The Berendsen barostat had a target pressure of 1.01325 bar, and the Langevin thermostat had a target temperature of 298 K with a damping coefficient of γ = 0.1.32,33 Using a hydrogen mass-repartitioning scheme, allowing for 4 fs time steps, systems of this size readily access the microsecond regime.30 All simulations employed a TIP3P water model,34 and after charge neutralization, ionization conditions of 150 mM NaCl. The simulations did not contain Mg2+ known to stabilize the G15:C48 Levitt pair.
Interestingly, the full pair was present more often in the variants in 57.9% of the simulations of G18A and 47.9% in G19A.
Construction of tRNA Variants in Silico
The AS of tRNAMet is thought to undergo a conformational change to fit into the active site of MetRS for amino acid transfer. To date, there is no available co-crystal structure of MetRS–tRNAMet that depicts this catalytic conformation. The tRNA portion of the A. aeolicus MetRS–tRNAMet co-crystal structure (2CSX) is disordered at the nucleotides 74–76 of the tRNA AS, and the atom positions are unresolved.25 However, the CysRS:tRNACys co-crystal structure (1UOB) does show an AS conformation likely similar to that of tRNAMet.25
To approximate the AS positions, the tRNACys CCA end was modeled onto the 3′ end of the A. aeolicus tRNAMet. The sequence of the tRNA was then modified to represent the E. coli tRNAMet sequence (see Supporting Information Figure S1 for detailed nucleotide substitutions). The tRNAsMet of both E. coli and A. aeolicus are 77 nucleotides in length, and the two share 69% sequence identity, with the differences mostly in the AC stem. The nucleotides in the D-loop and in the TψC-loop are conserved and are known to form hydrogen bonds in the core.6
Analysis Methods
After the simulations were completed, water and ions were removed, and the frames were extracted using a GUI interface to CatDCD.35,36 Every fourth frame of the 2.5 ps raw data was kept, giving 10 ps resolution. The trajectory was aligned to remove the translation and rotation that result from diffusion. Once the trajectory files were of manageable size and aligned, the RMSF of the trajectories were calculated for all 4 μs of each configuration (cf. 3). The RMSF of atom i is quantified as
| 1 |
where r⃗i(tj) is the instantaneous position vector, r⃗i′ is the mean position of atom i, and T is the total number of frames. The RMSFs for the tRNA are based on the positions of the C1′ atoms.
Conformational clustering was performed using the QT algorithm of VMD,37 which is based on the root-mean-square deviation (RMSD) measurements and requires the input parameters of maximum cluster diameter and maximum number of clusters. The algorithm compares the RMSD values among all frames, finds the largest grouping of frames, labels that cluster 1, removes those frames from the search space, and iterates until all frames are clustered, or the maximum number of clusters (100) is reached. To optimize the parameters used, small samples of the trajectories (for a quick analysis on a subset of the whole sample) were subjected to the clustering algorithm with various choices for the maximum cluster diameter, to minimize the number of unclustered frames with a total of 100 possible clusters. The clustering was performed on each configuration independently, as well as on the backbone structure of all simulations concatenated. The clustering images were rendered in tachyon, with the median structure represented in color and the shadows depicted based on the statistical analysis (1σ) of the cluster distribution.38−40
The hydrogen bond analysis employed the tools available in MDAnalysis.41 Considering only polar atoms, bonds are considered present if the donor and acceptor pair are within 3.2 Å from one another and the angle between the donor–hydrogen–acceptor triplet is greater than 120°, approximating a bond of intermediate strength.42 A subsequent analysis was used to determine the percentage occupancy for each bond (persisting for more than 50% of the simulation), and these data were exported to Cytoscape for network visualization and analysis.43
The correlated motions elucidate a coupled pairwise motion between atoms via a normalized covariance matrix. Completely correlated motions (Cij = 1) occur when one atom moves exactly in accordance with another (self-correlations are always 1), and anticorrelated motions (Cij = −1) occur when two atoms move in different directions from one another. As with the RMSF analysis, tRNA correlations are based on the C1′ coordinates throughout the trajectory. Here, this Pearson correlation is described by
| 2 |
| 3 |
where r⃗iα (r⃗j) is the position vector of atom i (j) at time α. The covariance between two atoms, Cij, is normalized by the number of frames, N, after finding the scalar product of atom differences from their average value. The correlation is then normalized by the diagonal elements of the covariance matrix (cf. eq 3), such that the values range from −1 to 1.
The network analysis of tRNA–protein complexes has been useful in understanding the allosteric signal pathways.16,44 The network communities analyzed here were developed from the correlation and hydrogen bond results. The hydrogen bond networks were based on the donor–acceptor pairs present in more than 50% of the simulations and, similarly, the correlation networks were based on moderate correlations (|Cij| ≥ 0.5). The network diagrams were generated and rendered using Cytoscape, in which the correlation networks employed the edge-weighted, spring-embedded layout based on edge betweenness (hydrogen bond layouts were manually generated). The betweenness centrality quantifies the ability to control the flow of information by analyzing the evenly weighted geodesics and determining the node’s importance to the largest number of shortest paths.45 If we consider a node pk, the probability bij(pk) of it being in a randomly selected geodesic of the network (e.g., a random path between nodes pi and pj) is given by
| 4 |
where gij (gij(pk))is the number of geodesics linking pi and pj (that contain pk) and N is the number of nodes in the network. The normalized betweenness centrality is then the sum of all bij(pk), where i ≠ k ≠ j.
| 5 |
Similarly, closeness centrality quantifies the centrality measure by considering the average length of the shortest paths between a node and every other node in the network,46 given by
| 6 |
where dij is the shortest path distance between nodes i and j.
Acknowledgments
R.C.G. and F.R.S. acknowledge NIH R01CA129373 and the Crystallography and Computational Biosciences Core facility of the WFU Comprehensive Cancer Center, P30CA012197, for partially supporting the work. R.C.G. acknowledges SCB training grant T32GM095440-04. R.W.A. acknowledges NSF award MCB-1052402. F.R.S. also acknowledges a Reynolds Research leave from Wake Forest University.
Supporting Information Available
The Supporting Information is available free of charge on the ACS Publications website at DOI: 10.1021/acsomega.8b00280.
Secondary structure comparisons; weblog of tRNAMet; concatenated QT clustering; network parameters of the four correlation networks; variant-specific QT clustering; hydrogen bond network of tRNAMet variants; and large conformational changes of G18A (PDF)
Author Present Address
∥ 1826 Oakcrest, Ct. Winston-Salem, NC 27106.
The authors declare no competing financial interest.
Supplementary Material
References
- Ibba M.; Söll D. Aminoacyl-tRNA synthesis. Annu. Rev. Biochem. 2000, 69, 617–650. 10.1146/annurev.biochem.69.1.617. [DOI] [PubMed] [Google Scholar]
- Nakanishi K.; Ogiso Y.; Nakama T.; Fukai S.; Nureki O. Structural basis for anticodon recognition by methionyl-tRNA synthetase. Nat. Struct. Mol. Biol. 2005, 12, 931–932. 10.1038/nsmb988. [DOI] [PubMed] [Google Scholar]
- Larson E. T.; Kim J. E.; Zucker F. H.; Kelley A.; Mueller N.; Napuli A. J.; Verlinde C. L. M. J.; Fan E.; Buckner F. S.; Van Voorhis W. C.; Merritt E. A.; Hol W. G. J. Structure of Leishmania major methionyl-tRNA synthetase in complex with intermediate products methionyladenylate and pyrophosphate. Biochimie 2011, 93, 570–582. 10.1016/j.biochi.2010.11.015. [DOI] [PMC free article] [PubMed] [Google Scholar]
- Ghosh G.; Pelka H.; Schulman L. H. Identification of the tRNA anticodon recognition site of Escherichia coli methionyl-tRNA synthetase. Biochemistry 1990, 29, 2220–2225. 10.1021/bi00461a003. [DOI] [PubMed] [Google Scholar]
- Serre L.; Verdon G.; Choinowski T.; Hervouet N.; Risler J.-L.; Zelwer C. How methionyl-tRNA synthetase creates its amino acid recognition pocket upon L-methionine binding. J. Mol. Biol. 2001, 306, 863–876. 10.1006/jmbi.2001.4408. [DOI] [PubMed] [Google Scholar]
- Oliva R.; Tramontano A.; Cavallo L. Mg2+ binding and archaeosine modification stabilize the G15 C48 Levitt base pair in tRNAs. RNA 2007, 13, 1427–1436. 10.1261/rna.574407. [DOI] [PMC free article] [PubMed] [Google Scholar]
- Cramer F.; Erdmann V. A.; Von Der Haar F.; Schlimme E. Structure and reactivity of tRNA. J. Cell. Physiol. 1969, 74, 163–178. 10.1002/jcp.1040740416. [DOI] [PubMed] [Google Scholar]
- Nakanishi K.; Fukai S.; Ikeuchi Y.; Soma A.; Sekine Y.; Suzuki T.; Nureki O. Structural basis for lysidine formation by ATP pyrophosphatase accompanied by a lysine-specific loop and a tRNA-recognition domain. Proc. Natl. Acad. Sci. U.S.A. 2005, 102, 7487–7492. 10.1073/pnas.0501003102. [DOI] [PMC free article] [PubMed] [Google Scholar]
- Alexander R. W.; Eargle J.; Luthey-Schulten Z. Experimental and computational determination of tRNA dynamics. FEBS Lett. 2010, 584, 376–386. 10.1016/j.febslet.2009.11.061. [DOI] [PubMed] [Google Scholar]
- Woese C. R.; Olsen G. J.; Ibba M.; Soll D. Aminoacyl-tRNA synthetases, the genetic code, and the evolutionary process. Microbiol. Mol. Biol. Rev. 2000, 64, 202–236. 10.1128/mmbr.64.1.202-236.2000. [DOI] [PMC free article] [PubMed] [Google Scholar]
- Juhling F.; Morl M.; Hartmann R. K.; Sprinzl M.; Stadler P. F.; Putz J. tRNAdb 2009: compilation of tRNA sequences and tRNA genes. Nucleic Acids Res. 2009, 37, D159–D162. 10.1093/nar/gkn772. [DOI] [PMC free article] [PubMed] [Google Scholar]
- Lee C. P.; Mandal N.; Dyson M. R.; RajBhandary U. L. The discriminator base influences tRNA structure at the end of the acceptor stem and possibly its interaction with proteins. Proc. Natl. Acad. Sci. U.S.A. 1993, 90, 7149–7152. 10.1073/pnas.90.15.7149. [DOI] [PMC free article] [PubMed] [Google Scholar]
- Oliva R.; Cavallo L.; Tramontano A. Accurate energies of hydrogen bonded nucleic acid base pairs and triplets in tRNA tertiary interactions. Nucleic Acids Res. 2006, 34, 865–879. 10.1093/nar/gkj491. [DOI] [PMC free article] [PubMed] [Google Scholar]
- Sonawane K. D.; Bavi R. S.; Sambhare S. B.; Fandilolu P. M. Comparative Structural Dynamics of tRNAPhe with Respect to Hinge Region Methylated Guanosine: A Computational Approach. Cell Biochem. Biophys. 2016, 74, 157–173. 10.1007/s12013-016-0731-z. [DOI] [PubMed] [Google Scholar]
- Auffinger P.; Louise-May S.; Westhof E. Molecular Dynamics Simulations of Solvated Yeast tRNA Asp. Biophys. J. 1999, 76, 50–64. 10.1016/s0006-3495(99)77177-8. [DOI] [PMC free article] [PubMed] [Google Scholar]
- Ghosh A.; Vishveshwara S. A study of communication pathways in methionyl- tRNA synthetase by molecular dynamics simulations and structure network analysis. Proc. Natl. Acad. Sci. U.S.A. 2007, 104, 15711–15716. 10.1073/pnas.0704459104. [DOI] [PMC free article] [PubMed] [Google Scholar]
- Hamann C. S.; Hou Y.-M. Probing a tRNA core that contributes to aminoacylation. J. Mol. Biol. 2000, 295, 777–789. 10.1006/jmbi.1999.3353. [DOI] [PubMed] [Google Scholar]
- Hou Y.-M.; Lipman R. S. A.; Hamann C. S.; Motegi H.; Shiba K. Conservation of a tRNA core for aminoacylation. Nucleic Acids Res. 1999, 27, 4743–4750. 10.1093/nar/27.24.4743. [DOI] [PMC free article] [PubMed] [Google Scholar]
- Vissing J.; Salamon M. B.; Arlien-Sprborg P.; Norby S.; Manta P.; DiMauro S.; Schmalbruch H. A new mitochondrial tRNAMet gene mutation in a patient with dystrophic muscle and exercise intolerance. Neurology 1998, 50, 1875–1878. 10.1212/wnl.50.6.1875. [DOI] [PubMed] [Google Scholar]
- Helm M.; Brule H.; Degoul F.; Cepanec C.; Leroux J.-P.; Giege R.; Florentz C. The presence of modified nucleotides is required for cloverleaf folding of a human mitochondrial tRNA. Nucleic Acids Res. 1998, 26, 1636–1643. 10.1093/nar/26.7.1636. [DOI] [PMC free article] [PubMed] [Google Scholar]
- Jones C. N.; Jones C. I.; Graham W. D.; Agris P. F.; Spremulli L. L. A Disease-causing Point Mutation in Human Mitochondrial tRNAMetResults in tRNA Misfolding Leading to Defects in Translational Initiation and Elongation. J. Biol. Chem. 2008, 283, 34445–34456. 10.1074/jbc.m806992200. [DOI] [PMC free article] [PubMed] [Google Scholar]
- Kramer G. F.; Baker J. C.; Ames B. N. Near-UV stress in Salmonella typhimurium: 4-thiouridine in tRNA, ppGpp, and ApppGpp as components of an adaptive response. J. Bacteriol. 1988, 170, 2344–2351. 10.1128/jb.170.5.2344-2351.1988. [DOI] [PMC free article] [PubMed] [Google Scholar]
- Jones T. E.; Ribas de Pouplana L.; Alexander R. W. Evidence for Late Resolution of the AUX Codon Box in Evolution. J. Biol. Chem. 2013, 288, 19625–19632. 10.1074/jbc.m112.449249. [DOI] [PMC free article] [PubMed] [Google Scholar]
- Feig M.; Onufriev A.; Lee M. S.; Im W.; Case D. A.; Brooks C. L. Performance Comparison of Generalized Born and Poisson Methods in the Calculation of Electrostatic Solvation Energies for Protein Structures. J. Comput. Chem. 2004, 25, 265–284. 10.1002/jcc.10378. [DOI] [PubMed] [Google Scholar]
- Hauenstein S.; Zhang C.-M.; Hou Y.-M.; Perona J. J. Shape-selective RNA recognition by cysteinyl-tRNA synthetase. Nat. Struct. Mol. Biol. 2004, 11, 1134–1141. 10.1038/nsmb849. [DOI] [PubMed] [Google Scholar]
- Vanommeslaeghe K.; Hatcher E.; Acharya C.; Kundu S.; Zhong S.; Shim J.; Darian E.; Guvench O.; Lopes P.; Vorobyov I.; Mackerell A. D. CHARMM general force field: A force field for drug-like molecules compatible with the CHARMM all-atom additive biological force fields. J. Comput. Chem. 2009, 31, 671. 10.1002/jcc.21367. [DOI] [PMC free article] [PubMed] [Google Scholar]
- Denning E. J.; Priyakumar U. D.; Nilsson L.; Mackerell A. D. Impact of 2′-hydroxyl sampling on the conformational properties of RNA: Update of the CHARMM all-atom additive force field for RNA. J. Comput. Chem. 2011, 32, 1929–1943. 10.1002/jcc.21777. [DOI] [PMC free article] [PubMed] [Google Scholar]
- Phillips J. C.; Braun R.; Wang W.; Gumbart J.; Tajkhorshid E.; Villa E.; Chipot C.; Skeel R. D.; Kalé L.; Schulten K. Scalable molecular dynamics with NAMD. J. Comput. Chem. 2005, 26, 1781–1802. 10.1002/jcc.20289. [DOI] [PMC free article] [PubMed] [Google Scholar]
- Harvey M. J.; De Fabritiis G. An Implementation of the Smooth Particle Mesh Ewald Method on GPU Hardware. J. Chem. Theory Comput. 2009, 5, 2371–2377. 10.1021/ct900275y. [DOI] [PubMed] [Google Scholar]
- Harvey M. J.; Giupponi G.; De Fabritiis G. ACEMD: Accelerating Biomolecular Dynamics in the Microsecond Time Scale. J. Chem. Theory Comput. 2009, 5, 1632–1639. 10.1021/ct9000685. [DOI] [PubMed] [Google Scholar]
- Adcock S. A.; McCammon J. A. Molecular dynamics: survey of methods for simulating the activity of proteins. Chem. Rev. 2006, 106, 1589–1615. 10.1021/cr040426m. [DOI] [PMC free article] [PubMed] [Google Scholar]
- Berendsen H. J. C.; Postma J. P. M.; van Gunsteren W. F.; DiNola A.; Haak J. R. Molecular dynamics with coupling to an external bath. J. Chem. Phys. 1984, 81, 3684–3690. 10.1063/1.448118. [DOI] [Google Scholar]
- Feller S. E.; Zhang Y.; Pastor R. W.; Brooks B. R. Constant pressure molecular dynamics simulation: The Langevin piston method. J. Chem. Phys. 1995, 103, 4613–4621. 10.1063/1.470648. [DOI] [Google Scholar]
- Jorgensen W. L.; Chandrasekhar J.; Madura J. D.; Impey R. W.; Klein M. L. Comparison of simple potential functions for simulating liquid water. J. Chem. Phys. 1983, 79, 926–935. 10.1063/1.445869. [DOI] [Google Scholar]
- Godwin R.; Salsbury F. R.. Catdcd Interface Code. https://figshare.com/articles/Catdcd_Interface/1613888/1, 2015. (accessed 2018).
- Humphrey W.; Dalke A.; Schulten K. VMD: Visual Molecular Dynamics. J. Mol. Graphics 1996, 14, 33–38. 10.1016/0263-7855(96)00018-5. [DOI] [PubMed] [Google Scholar]
- Heyer L. J.; Kruglyak S.; Yooseph S. Exploring expression data: identification and analysis of coexpressed genes. Genome Res. 1999, 9, 1106–1115. 10.1101/gr.9.11.1106. [DOI] [PMC free article] [PubMed] [Google Scholar]
- Stone J. E.An Efficient Library for Parallel Ray Tracing and Animation. M.S. Thesis, University of Missouri, 1998. [Google Scholar]
- Melvin R.; Salsbury F.. Visual Statistics Code. https://dx.doi.org/10.6084/m9.figshare.1601897.v1, 2015. (accessed 2018).
- Melvin R.; Thompson W. G.; Salsbury F.. Scripts and Data for MSH26 Damage Response. https://doi.org/10.6084/m9.figshare.4003266.v1, 2016. (accessed 2018).
- Michaud-Agrawal N.; Denning E. J.; Woolf T. B.; Beckstein O. MDAnalysis: A toolkit for the analysis of molecular dynamics simulations. J. Comput. Chem. 2011, 32, 2319–2327. 10.1002/jcc.21787. [DOI] [PMC free article] [PubMed] [Google Scholar]
- Jeffrey G. A.; Takagi S. Hydrogen-Bond Structure in Carbohydrate Crystals. Acc. Chem. Res. 1978, 11, 264–270. 10.1021/ar50127a002. [DOI] [Google Scholar]
- Shannon P.; Markiel A.; Ozier O.; Baliga N. S.; Wang J. T.; Ramage D.; Amin N.; Schwikowski B.; Ideker T. Cytoscape: a software environment for integrated models of biomolecular interaction networks. Genome Res. 2003, 13, 2498–2504. 10.1101/gr.1239303. [DOI] [PMC free article] [PubMed] [Google Scholar]
- Sethi A.; Eargle J.; Black A. A.; Luthey-Schulten Z. Dynamical networks in tRNA:protein complexes. Proc. Natl. Acad. Sci. U.S.A. 2009, 106, 6620–6625. 10.1073/pnas.0810961106. [DOI] [PMC free article] [PubMed] [Google Scholar]
- Freeman L. C. A Set of Measures of Centrality Based on Betweenness. Sociometry 1977, 40, 35–41. 10.2307/3033543. [DOI] [Google Scholar]
- Bavelas A. Communication Patterns in Task-Oriented Groups. J. Acoust. Soc. Am. 1950, 22, 725–730. 10.1121/1.1906679. [DOI] [Google Scholar]
Associated Data
This section collects any data citations, data availability statements, or supplementary materials included in this article.


