

Summary
The diversity and number of species present within microbial communities create the potential for a multitude of interspecies metabolic interactions. Here, we develop, apply, and experimentally test a framework for inferring metabolic mechanisms associated with interspecies interactions. We perform pairwise growth and metabolome profiling of co-cultures of strains from a model mouse microbiota. We then apply our framework to dissect emergent metabolic behaviors that occur in co-culture. Based on one of the inferences from this framework, we identify and interrogate an amino acid cross-feeding interaction and validate that the proposed interaction leads to a growth benefit in vitro. Our results reveal the type and extent of emergent metabolic behavior in microbial communities composed of gut microbes. We focus on growth-modulating interactions, but the framework can be applied to interspecies interactions that modulate any phenotype of interest within microbial communities.
eTOC Blurb
Ecological interactions determine the behavior of microbial communities, but pinpointing mechanisms governing them is difficult. Here, we develop a framework for identifying interspecies metabolic interactions in co-culture based on monoculture behavior and co-culture growth outcomes. We profile the growth and metabolism of mono- and co-cultures of bacteria from a defined mouse microbiota and apply our framework to these data. Based on these inferences, we investigate an amino acid cross-feeding interaction that may contribute to a commensal interaction.
Introduction
The structure and function of microbial communities may influence human health through a variety of means (Turnbaugh et al., 2007). However, understanding the mechanisms governing this influence is complicated by the complexity of microbial communities. Interspecies interactions within microbial communities underlie benefits to human health, such as colonization resistance to pathogens (Britton and Young, 2014; Buffie and Pamer, 2013). These interspecies interactions are often metabolic, such as competition for metabolites essential for growth of pathogens (Gillis et al., 2018; Lawley and Walker, 2013; Stecher and Hardt, 2008). Since metabolic interactions occur between distantly-(Fischbach and Sonnenburg, 2011) and closelyrelated (Rakoff-Nahoum et al., 2014) species, creating heuristics for identifying presence or absence of interactions based on phylogeny is challenging. Knowledge of interactions among small subsets of community members has been shown to enable prediction of community assembly in larger communities, suggesting that constructing predictive models of population dynamics in complex microbial communities may be a tractable problem (Friedman et al., 2017). However, in this same study, while pairwise interactions were sufficient to predict community assembly in 3-species pairs, information from 3-species communities was necessary to predict assembly of larger communities. Further supporting the lack of generalizability of pairwise interactions to new conditions, theoretical ecological analyses suggest that universal interspecies interaction terms in pairwise ecological interaction models cannot recapitulate commonly identified chemical-mediated interspecies interactions (Momeni et al., 2017). Thus, generalizable methods for predicting assembly of large microbial communities likely depend on more mechanistic knowledge of interactions that can help account for context specificity, such as the consumption and production of metabolites that might be shared within a community (Goldford et al., 2017).
The spatial, temporal, and compositional complexity of microbial communities in mammals make inferring mechanisms of interaction challenging. Using gnotobiotic animals can improve the tractability of this problem. However, knowledge of the behavior of individual microbes within the defined community is generally lacking unless classical model organisms are used in place of naturally occurring organisms. To increase the value of experiments performed using gnotobiotic animals, individual members of the microbiota can be characterized in vitro. The phenotyping performed via these experiments improves our understanding of these organisms, which may improve our ability to predict and interpret how they might behave in vivo.
The altered Schaedler flora (ASF) is a group of 8 bacterial strains isolated from the mouse gastrointestinal tract used to standardize the microbiota of laboratory mice (Wymore Brand et al., 2015). ASFcolonized mice remain stably colonized across mouse generations and have normalized organ physiology relative to germ-free mice (Wymore Brand et al., 2015). Although there are known differences between the immune repertoires of ASF-colonized mice and conventional mice, these differences can be exploited to test specific hypotheses (Geuking et al., 2011; Ivanov et al., 2009). ASF mice have been used widely in infectious disease research to study Clostridium difficile (Schwan et al., 2009), Salmonella enterica (Brugiroux et al., 2016), and Cryptosporidium parvum (Harp et al., 1992). Many specific pathogen-free mice are initially colonized with the ASF, which has led to the theory that presence or absence of ASF strains contributes to vendor-specific differences in susceptibility to disease (Singer and Nash, 2000). Further use of gnotobiotic systems such as ASF-colonized mice could greatly accelerate discovery in microbiome research, especially if the behavior of the ASF alone is well-understood.
Previously, we performed pairwise spent media experiments using seven of the ASF strains, in which each strain was grown in the same medium as well as the spent medium of other strains (Biggs et al., 2017). We identified cases of putative cross-feeding and competition and the effect of those interactions on growth dynamics. However, each strain was spatially and temporally separated in that study. While spent media experiments remove some technical and statistical complications in inferring metabolic interactions, the interactions that are possible are different than those that might occur while strains are grown in co-culture.
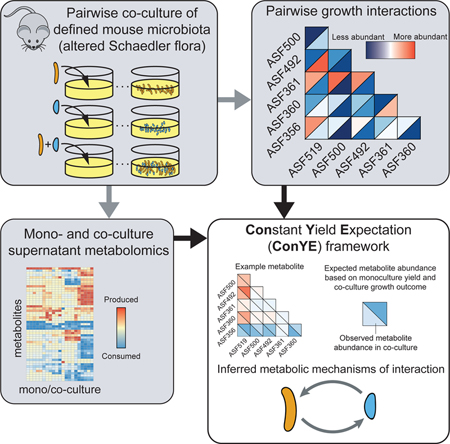
Here, we further define the interactive potential of six of the ASF strains and develop an analytic method to infer putative mechanisms of metabolic interaction. We perform co-culture growth experiments with all pairs of these strains and profile their supernatant metabolomes in both mono- and co-culture. We identify the influence of interspecies interactions on growth of each strain, then apply our analytic framework for inferring putative metabolic mechanisms of interaction from supernatant metabolomic data. We experimentally interrogate an inferred cross-feeding interaction in which one ASF strain (Parabacteroides goldsteineii ASF519) produces amino acids that another (Clostridium sp. ASF356) consumes, confirming that the hypothesized mechanism occurs and leads to a growth benefit for the consuming strain. With this new insight, we provide a framework to identify putative metabolic mechanisms of microbe-microbe and host-microbe interactions that can be applied to any microbial community to investigate co-culture phenotypes including growth enhancement or changes in metabolite yield.
Results
Ecological interactions within the altered Schaedler flora
We collected in vitro data for growth of all pairwise combinations of 6 ASF strains (Figure 1A, n=6–9 per strain pairing). Taxonomic assignments for these strains are provided in Figure 1B. We determined the impact of co-culture on each strains’ growth by comparing monoculture abundance after 72 hours of growth to the abundance of each strain in co-culture at the same time (determined using probe-based qPCR; all strains are in stationary phase; see example growth curves in Figure S2; see STAR Methods).
Figure 1.
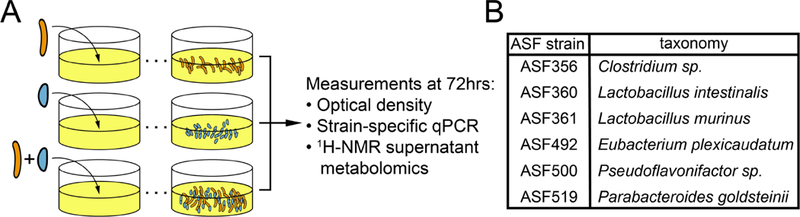
Summary of co-culture experiment design, measurements, and total growth outcomes in monocultures and cocultures. A) Experimental procedure for each pair of strains and measurements taken. B) Taxonomic assignment for strains included in this study.
Abundance of each strain in each pair was evaluated to determine whether a negative (−), positive (+), or neutral (0) effect on abundance occurred in the pairing, allowing classification of pairwise interaction with standard ecological terminology. All pairings except one, Clostridium ASF356 with Parabacteroides ASF519, had a negative impact on the abundance of at least one strain, with 0/- (amensalism), +/− (parasitism), −/− (competition), and +/0 (commensalism) being the only interactions detected (8, 4, 2, and 1 instances, respectively; data shown in Figure 2A, summarized in Figure 2B and2C). Lactobacillus ASF361 was present in 3/4 parasitic co-cultures and experienced a growth benefit in all cases. In contrast, growth of both Eubacterium ASF492 and Pseudoflavonifractor ASF500 was inhibited in every condition, including in co-culture with each other. In summary, abundance of individual strains tended to be lower in co-culture than in monoculture.
Figure 2.
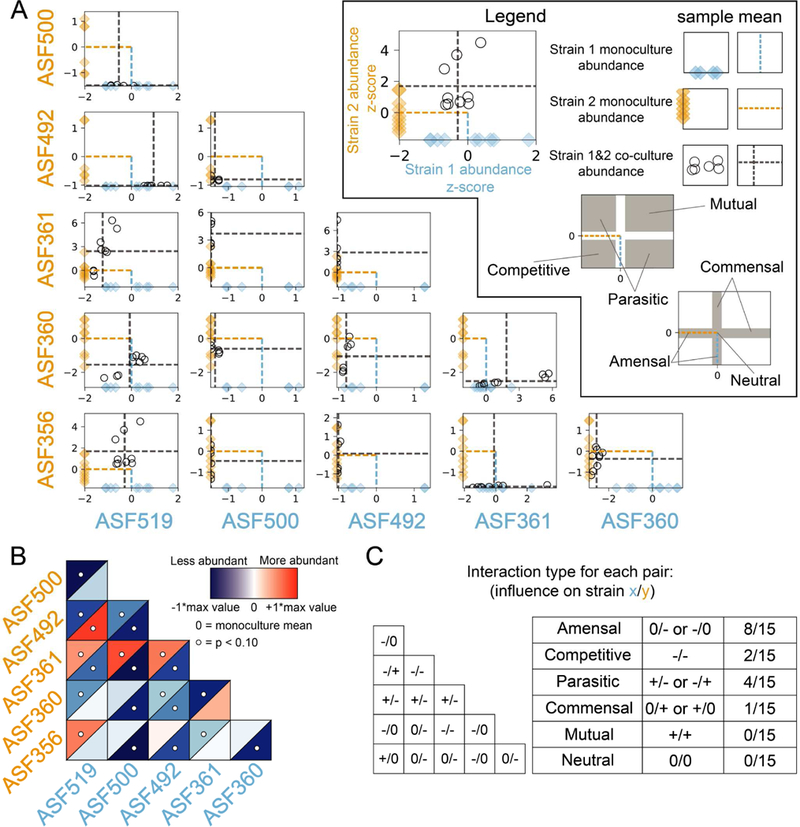
The effects of pairwise co-culture on the abundance of each strain. A) Relative abundance of each strain in monoculture and co-culture determined via qPCR. Abundance is plotted on linear scale, not log-transformed. x-axis describes abundance of strain at the bottom of the column; y-axis describes abundance of strain left of each row. Diamonds indicate abundance of each strain in monoculture, with mean shown by a dashed line. Abundance of each strain in co-culture as indicated by the row and column labels is shown by a black circle, with mean abundances indicated by grey dashed lines. Abundance for each strain is z-score normalized using mean and standard deviation of monoculture abundance to center and scale the data, respectively. N=9 for all samples except for those with Pseudoflavonifractor ASF500 or Eubacterium ASF492, for which N=6. B) Heatmap of mean abundance of each strain in co-culture relative to monoculture. Blue indicates less abundant, while red indicates more abundant, than monoculture. The upper left and lower right triangles in each square describes abundance of the strain labelled on the left of row and bottom of column, respectively. White circles indicate differential abundance between monoculture and co-culture (p < 0.10, Mann-Whitney U test with false discovery rate correction using Benjamini-Hochberg procedure). C) Summary of interspecies interactions. Non-zero interactions in the triangular matrix indicate significant differential abundance as shown in Figure 2B.
However, the growth benefit observed for some strains also suggests that differences in resource utilization across strains, or emergent behavior in co-culture such as cross-feeding and consumption of novel substrates/metabolites, occurred in some co-cultures.
Metabolic repertoires within the altered Schaedler flora
To determine potential mechanisms governing the changes in growth observed in co-culture, we performed metabolomics on the spent supernatant from all samples in the growth experiments (using 1H NMR spectroscopy, see STAR Methods). We updated and refined the metabolite peak annotations from experiments previously performed using the same medium and strains (Biggs et al., 2017), resulting in 86 detected metabolites, 50 of which could be assigned an identity (36 of 85 metabolites were previously assigned an identity). We identified new metabolites involved in amino acid metabolism (serine, cystine, asparagine, glutamate, 2-oxoisocaproate, and isocaproate), nucleic acid metabolism (cytidine, cytosine, uridine monophosphate), and anaerobe-specific metabolism (isopropanol).
Based on the monoculture supernatant metabolomic profiles presented here (Figure 3A) and in our previous study of the ASF, the ASF strains have fermentation repertoires similar to closely-related gut microbes (Biggs et al., 2017). Lactobacillus ASF360 and Lactobacillus ASF361 both produced lactate, while Lactobacillus ASF361 also produced acetate and formate. Other strains of Lactobacillus intestinalis and Lactobacillus murinus are generally identified as facultative heterofermentative lactic acid bacteria (Vos et al., 2011). Heterofermentative lactic acid bacteria ferment carbohydrates to lactate but may also produce additional acetate in some conditions. Clostridium ASF356 produced the common fermentation end products acetate, propionate, succinate, and butyrate. Butyrate production is common in Clostridia that inhabit mammalian gastrointestinal tracts, and is often coupled with acetate production (Louis and Flint, 2009). Propionate is the primary end product of three common pathways identified in anaerobic organisms, of which the acrylate pathway and succinate pathway have been identified in Clostridia spp. (Reichardt et al., 2014). Clostridium ASF356 also produced isovalerate, isocaproate, and isobutyrate, which are common products of amino acid fermentation by some Clostridia spp. (Mead, 1971). Butyrate and ethanol were the only common fermentation end products produced by Eubacterium ASF492. Eubacterium ASF492 has been proposed as the type strain for Eubacterium plexicaudatum (Dewhirst et al., 1999), which was originally identified as producing butyrate and small amounts of acetate from glucose (Wilkins et al., 1974). Pseudoflavonifractor ASF500 produced only formate and consumed less lactose than any other ASF strain, suggesting that lactose is not a preferred carbon source for Pseudoflavonifractor ASF500 or another growth-limiting nutrient is only present at low abundance in the medium. Parabacteroides ASF519 produced acetate, propionate, and succinate, consistent with previous reports on fermentation products of Parabacteroides goldsteinii (Song et al., 2005), as well as formate. Parabacteroides ASF519 also produced many amino acids, including histidine, lysine, alanine, isoleucine, valine, proline, phenylalanine, glutamate, and methionine, suggesting Parabacteroides ASF519 contains a comprehensive amino acid biosynthesis repertoire.
Figure 3.
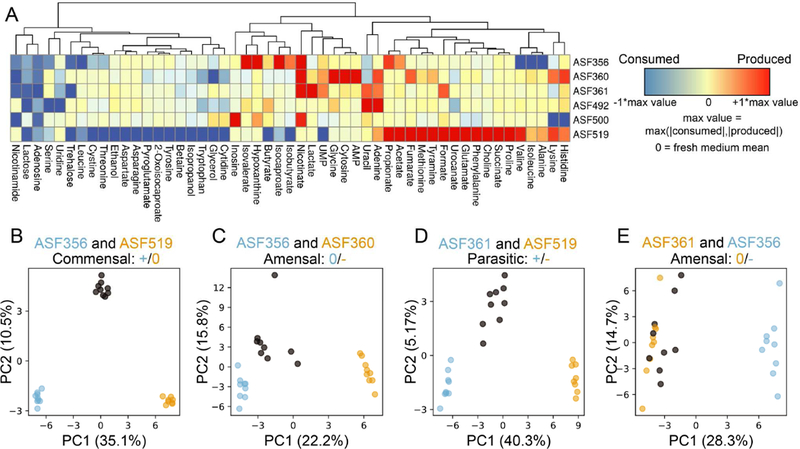
Metabolic behavior of each strain in monoculture and emergent behavior in co-cultures. A) Heatmap describing supernatant metabolomes for each monoculture. Red/blue indicate higher/lower concentrations than fresh medium, respectively. Values are centered at 0 using the mean in fresh media, then scaled between −1 and +1 by dividing by the maximum change in concentration for each metabolite in any sample in the study. Unnamed metabolites not shown. Hierarchical clustering was performed using Euclidean distances and complete linkage. B-E) Principal component analysis (PCA) of monocultures and co-culture, performed independently for each subplot. Sky blue/orange circles correspond to monoculture supernatant metabolomes from strain labelled with same color. Co-culture samples for the two strains in each subplot title are indicated by grey circles. Percent variance captured by each principal component is labelled on each axis.
Co-culture can lead to emergent metabolic behavior
Co-culture substantially altered the metabolome of pairings relative to each of the monoculture metabolomes for the strains involved (see Figure S1 for results from all groups). To detect and quantify the emergent metabolic behavior resulting from co-culture, we performed principal component analysis (PCA; see STAR Methods) on the metabolic profile for pairs of strains. We performed PCA separately for each pair of strains, including samples from each monoculture and the co-culture. In cases where both strains grew in co-culture (i.e. no strong negative growth effect), the first principal component (PC1) separated monocultures by strain and the second principal component (PC2) separated monoculture samples from co-culture samples. This behavior was particularly strong in the case of Clostridium ASF356 and Parabacteroides ASF519 (Figure 3B). For Clostridium ASF356 and Parabacteroides ASF519, the loadings of PC2 suggest that co-culture increased production of propionate, glycine, and the amino acid fermentation products isovalerate, isocaproate, and isobutyrate, and increased consumption of multiple amino acids and lactose.
For pairings with a strong negative effect on one strain, the co-culture metabolomes were less similar to the negatively-affected strain than the other strain. For example, co-culture of Clostridium ASF356 with Lactobacillus ASF360 resulted in decreased growth of Lactobacillus ASF360, and the co-culture samples are located closer to Clostridium ASF356 monoculture samples in PCA (Figure 3C). Although there is still an “emergent” co-culture effect observed in PC2 for this pair, the effect is also aligned with within-group variation. The same trend is present for Lactobacillus ASF361, Parabacteroides ASF519, and their co-culture (Figure 3D). For strong negative growth outcomes (e.g. Clostridium ASF356 and Lactobacillus ASF361 co-culture), the effect is more pronounced and there is less separation between monoculture and co-culture samples (Figure 3E).
Development of an expectation-based model to account for changes in strain abundance
Based on the metabolic differences between monoculture and co-culture samples identified via PCA, co-culture conditions substantially altered metabolic behavior. However, the mechanism that leads to this emergent metabolic behavior is unclear, and attempting to infer the mechanism may be confounded by changes in the abundance of each strain in co-culture. We sought to infer metabolic interactions between strains in co-culture by accounting for changes in strain abundance. While the absolute amount of a metabolite produced or consumed may change in co-culture relative to monoculture, taking changes in strain abundance into account is necessary to determine whether the change in metabolite abundance is emergent behavior rather than additive.
We developed a Constant Yield Expectation (ConYE) model to identify metabolites for which consumption or production behavior changed in co-culture (see STAR Methods). Within the ConYE model, we assume each strain produces or consumes a fixed quantity of each metabolite per unit biomass (i.e. constant yield), then test whether that assumption is true in co-culture by comparing the expected behavior to the observed co-culture data. We simulate expected metabolite quantities in co-culture by multiplying the monoculture-derived metabolite yield for each strain by the observed abundance of that strain in co-culture, then summing the expected values for each strain and the initial quantity of the metabolite present in the fresh medium (Figure 4A). For each metabolite, we test the null hypothesis that the quantity of that metabolite in coculture is equal to that predicted by the ConYE model. Rejecting the null hypothesis for a metabolite implies that co-culture caused at least one strain to alter metabolism of that metabolite relative to its own biomass production.
Figure 4.
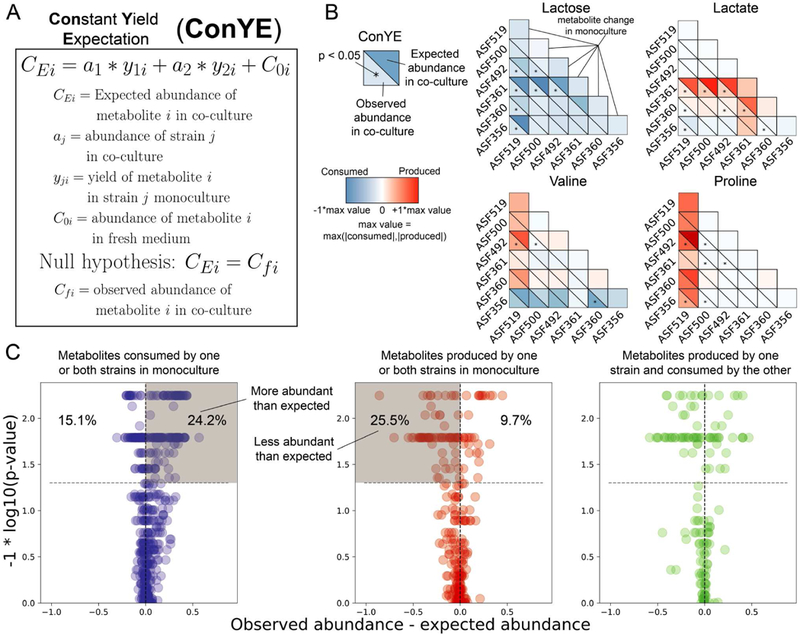
Accounting for co-culture growth outcomes with ConYE to identify emergent metabolism. A) Procedure for the constant yield expectation (ConYE) model. B) Examples of ConYE results for Lactose, Lactate, Valine, and Proline. Diagonal shows monoculture behavior for each strain. Every pair of triangles indicates the observed metabolite abundance in co-culture (lower left), the expected metabolite abundance (upper right), and whether there was a significant difference between observed and expected values. Centering and scaling performed as in Figure 3, except expected values were included while selecting a max value. Mann-Whitney U-Test with false discovery rate (FDR) control using the Benjamini-Hochberg procedure was performed for all 1290 comparisons (15 co-cultures, 86 metabolites each). Asterisk indicates p < 0.05 for the metabolite in the co-culture containing the indicated strains. C) ConYE results for all strain pairings for metabolites that were consumed by one or both strains in monoculture (left, blue), produced by one or both strains in monoculture (middle, red), or produced by one strain in monoculture and consumed by the other strain in monoculture (right, green). Each point represents a metabolite in a co-culture pair. x axis show the difference between observed and expected metabolite abundance in co-culture (scaled as in panel B), and y axis shows the p-value from ConYE. Points above grey line have p < 0.05. Percentage of points in the labelled quadrant relative to the rest of the points in the subplot is shown.
We identified several patterns with the ConYE model results that were consistent across sets of many metabolites, for which representative examples are shown (Figure 4B). Metabolites consumed in monoculture were often consumed less than expected in co-culture, especially when one strain in the co-culture experienced a growth benefit (e.g. lactose). For some strains, this pattern may arise because alternative metabolites are now available in co-culture that can be consumed to produce biomass, decreasing the amount of lactose required to produce a unit of biomass. Similarly, another pattern involves fermentation end products, which were generally less abundant than expected. Lactate, which was produced by Lactobacillus ASF360 and Lactobacillus ASF361, was less abundant than expected in 7/9 co-cultures containing either strain. Explanations for this pattern align with explanations for the first pattern; individual strains may utilize alternative metabolites to produce biomass, resulting in less production of primary fermentation products. An alternative explanation is that other strains in the co-culture are consuming the fermentation end product, as may be the case for lactate (Clostridium ASF356, Eubacterium ASF492, and Parabacteroides ASF519 consumed lactate in the fresh medium). Similar explanations may fit the behavior of other metabolites that are not end products of fermentation, such as valine. Valine was consumed by some strains and produced by others, but the null hypothesis for valine was only rejected for 3/15 co-cultures. In cases where one strain produced a metabolite in monoculture (e.g. Parabacteroides ASF519 producing valine) and another strain consumed the metabolite in monoculture (e.g. Clostridium ASF356 consuming valine), failure to reject the null hypothesis even when one strain experienced a growth benefit (e.g. Clostridium ASF356 co-cultured with Parabacteroides ASF519) suggests that a metabolite may have been cross-fed.
As demonstrated by these examples, interpretation of ConYE can be informed by considering the direction of metabolite abundance change in monoculture. If either strain consumed a metabolite in monoculture (Figure 4C, left, all co-cultures shown), rejecting the null hypothesis implies the metabolite was consumed more or less than expected, or that one of the strains produced the metabolite in co-culture (e.g. emergent production). Conversely, if either strain produced a metabolite in monoculture (Figure 4C, middle), rejecting the null hypothesis implies the metabolite was produced more or less than expected, or that one of the strains consumed the metabolite in co-culture (which was not observed in monoculture for that strain). For both the production and consumption cases, cross-feeding is still possible, but requires emergent consumption or production by one strain.
When a metabolite was consumed by one strain in monoculture and produced by the other strain in monoculture (Figure 4C, right), there are four possible interpretations if the null hypothesis is rejected. If the metabolite was less abundant than expected, then at least one of two conclusions is true: 1) the consumer metabolized more of the metabolite than expected, or 2) the producer produced less. If the metabolite was more abundant than expected, the opposite is true (producer produced more or consumer consumed less). If the null hypothesis is not rejected, the strains either maintained their production and consumption behavior from monoculture, or both scaled their consumption and production up or down in equal amounts. These interpretations, as well as their corresponding importance or relative contribution to a positive growth interaction for the consuming strain, are summarized in Figure 5.
Figure 5.
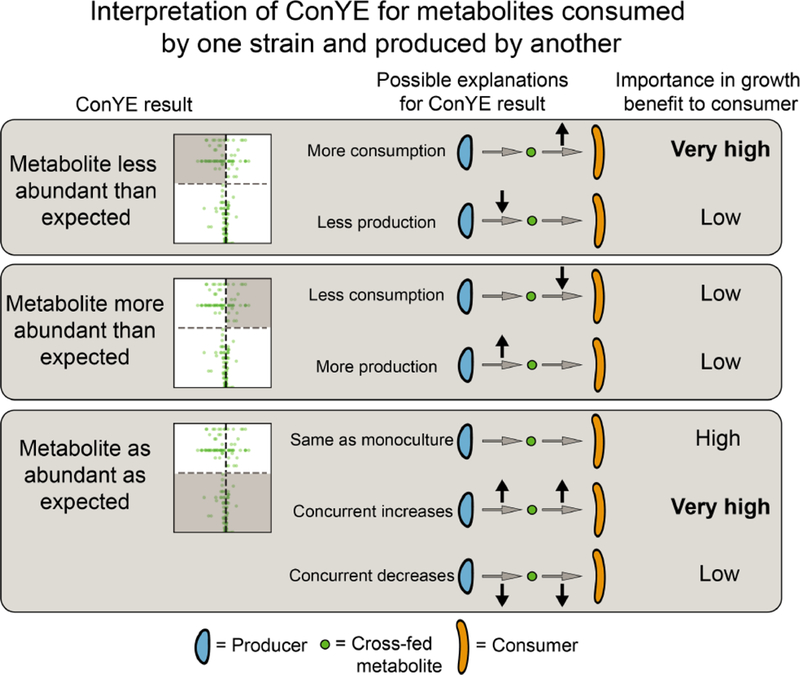
Interpretations of ConYE results for metabolites consumed by one strain in monoculture and produced by another strain in monoculture. In this example, the consumer experienced a growth benefit. The shaded region of each volcano plot describes the points that fall into the category described on left. In “Importance in growth benefit to consumer” column, the entry for each scenario assumes that consumption of the metabolite is coupled with biomass production. The importance assignments are qualitative, and reflect whether the consumer experienced an increase in metabolite flux in the explanatory scenario (high for increased flux, low for decreased flux).
Co-culture increases the efficiency of metabolic utilization
After applying ConYE to all co-cultures, the null hypothesis was rejected for 500/1290 metabolites (38.8%; 86 metabolites tested across 15 co-culture conditions, resulting in 1290 comparisons), suggesting that co-culture alters metabolism of a substantial portion of metabolites when taking into account changes in growth during co-culture. For metabolites that were consumed by one or both strains in monoculture, the amount consumed per unit of strain growth generally decreased in co-culture if the null hypothesis was rejected. Specifically, of the 624 instances of metabolites that fell into this category, 151 (24.2%) were significantly more abundant than expected in co-culture, whereas 94 (15.1%) were less abundant than expected (Figure 4C, left). Of the 278 instances of a metabolite being produced by one or both strains in a pairing in monoculture, 71 (25.5%) were less abundant than expected, while 27 (9.7%) were more abundant than expected (Figure 4C, middle). Thus, although co-culture often resulted in a greater quantity of a metabolite being produced relative to either monoculture (i.e. metabolites driving monoculture and co-culture separation in PCA, Figure 3B), the amount produced relative to growth of each strain decreased for most metabolites. Similarly, the amount of each metabolite consumed relative to biomass in co-culture generally decreased. These results suggest that these co-cultures can increase the efficiency of biomass production through niche expansion (e.g. consuming metabolites they did not consume in monoculture) or cross-feeding rather than increasing consumption of metabolites they did not fully deplete in monoculture. Indeed, 90/1290 (6.98%) metabolites were not consumed or produced by either strain in monoculture, yet were consumed when the two strains were in co-culture.
These distinct ConYE trends are enriched in cases with positive growth interactions (Figure 6A). When considering only pairings with a positive growth effect for at least one strain, there were 219 metabolites that were consumed by one or both strains in monoculture. Of these 219 metabolites, 138 (63.0%) were more abundant than expected, while only 6 (2.74%) were less abundant than expected. Of the 88 metabolites produced by one or both strains in monoculture for these co-cultures, 51 (58.0%) were less abundant than expected, and only 5 (5.68%) were more abundant than expected. Taken together, these results indicate that co-cultures with positive interactions are able to more efficiently utilize resources than co-cultures without positive interactions or monocultures.
Figure 6.
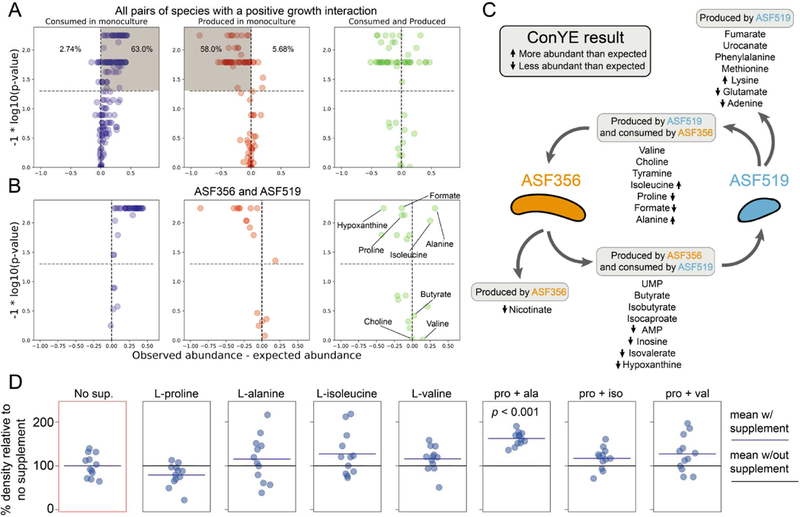
Emergent metabolism in co-culture pairings with a growth benefit and in vitro testing. A) ConYE results for all metabolites from co-cultures with a positive growth interaction. Shaded quadrants represent consumed metabolites that were more abundant than expected (left) or less abundant than expected (middle). Percentages shown represent the number of metabolites within the plot that fall in the quadrant. B) ConYE results for co-culture of Clostridium ASF356 and Parabacteroides ASF519. Metabolites on right for which p > 0.05 are labeled unless they could not be assigned an identity. Metabolites for which p < 0.05 are labeled if assigned an identity and abs(x) > 0.10 for that metabolite. x and y axes are scaled as in Figure 4. C) Metabolic interaction topology for Clostridium ASF356 and Parabacteroides ASF519. ConYE results are indicated with arrows pointing up or down for metabolites for which the null hypothesis was rejected. Metabolite classifications are based on monoculture behavior. D) OD600 of Clostridium ASF356 monocultures after 72 hours of growth in supplemented media conditions. “No sup.” had no supplement added, while conditions with a single amino acid were supplemented at 1.25g/L. In conditions with two supplements, each metabolite is supplemented at 1.25g/L. “pro + ala”, “pro + iso”, and “pro + val” conditions include L-proline with L-alanine, L-isoleucine, or L-valine, respectively.
There are three mechanisms that may enable this phenotype: niche expansion (consumption of metabolites not consumed in monoculture), cross-feeding, and detoxification via consumption of growthinhibiting metabolites. In co-culture, the subset of strain pairs with positive interactions consumed 30 metabolites that were not consumed by either species in monoculture. Interestingly, all 30 instances of emergent metabolite consumption were carried out by Lactobacillus ASF361+Eubacterium ASF492, Lactobacillus ASF361+Pseudoflavonifractor ASF500, and Eubacterium ASF492+Parabacteroides ASF519, while the remaining two pairs (Clostridium ASF356+Parabacteroides ASF519 and Lactobacillus ASF361+Parabacteroides ASF519) had 0 cases of emergent consumption (See Table S3 for all cases). Given this result, it is likely that the growth benefits that occurred for Clostridium ASF356+Parabacteroides ASF519 and Lactobacillus ASF361+Parabacteroides ASF519 are due to cross-feeding or detoxification, while the growth benefits for the other positive interaction pairs are at least in part due to niche expansion.
Identifying cross-fed metabolites and evaluating feasibility in silico
We next sought to investigate potential cross-fed metabolites from ConYE for co-cultures with positive growth interactions in order to find a mechanism that explained, at least in part, the growth benefit. For this task, we focused on the co-culture of Clostridium ASF356 and Parabacteroides ASF519 to exclude co-cultures which may have engaged in niche expansion (and therefore cross-feeding may have played a more minor in observed growth benefits) and to remove the need to consider additional confounding factors introduced by a strong negative growth interaction (e.g. negative impact on Parabacteroides ASF519 growth in co-culture with Lactobacillus ASF361). Seven named metabolites were consumed by Clostridium ASF356 in monoculture that were also produced by Parabacteroides ASF519 in monoculture (Figure 6B; labelled metabolites satisfy criteria specified in figure caption). Of those 7 metabolites, tyramine, valine, and choline did not result in rejecting the ConYE null hypothesis. Isoleucine and alanine were more abundant than expected, and proline and formate were less abundant than expected. Isoleucine and alanine may have been cross-fed, but given that they were more abundant than expected, consumption of these metabolites only contributed to enhanced growth if Parabacteroides ASF519 also produced less of these metabolites than expected (as in middle panel of Figure 5, where Parabacteroides ASF519 is the producer and Clostridium ASF356 is the consumer). Proline and formate were both less abundant than expected, so were either consumed by Clostridium ASF356 more in coculture than in monoculture (and thereby cross-fed) or produced less by Parabacteroides ASF519 in co-culture than in monoculture (as in top panel of Figure 5).
ConYE can identify metabolites that are potentially cross-fed, but the actual behavior of each strain in co-culture with respect to that metabolite is difficult to infer using existing experimental techniques. Because we can only evaluate the co-culture behavior based on an expectation derived from monoculture behavior, it is still possible that co-culture leads to reduced production and consumption of those metabolites rather than cross-feeding. We sought to provide orthogonal evidence for ConYE results by evaluating the potential for metabolites to increase the growth rate of a strain in monoculture, reasoning that ConYE may produce falsepositive inferences if metabolites are not actually coupled with biomass production. We chose to support inferences made using ConYE by building and applying Genome-scale metabolic network reconstructions (GENREs). GENREs are mathematical representations of all metabolic reactions that an organism can carry out, and have been used extensively to predict the effect of environmental conditions on growth of bacterial species (Oberhardt et al., 2009). We created an ensemble of 100 GENREs for each strain in this study to gain greater confidence in cross-feeding predictions and to enable predictive modeling of metabolism in future studies (Figure S3A and S3B; See STAR Methods). For each metabolite, we evaluated its impact on growth of individual strains by performing ensemble flux balance analysis (EnsembleFBA) (Biggs and Papin, 2017) to predict the growth rate of the strain without the metabolite available and with the metabolite available in excess (see STAR Methods). We performed this procedure for the cross-feeding candidate metabolites between Clostridium ASF356 and Parabacteroides ASF519. If a metabolite increases the predicted in silico growth rate when available in excess, we take that as parallel evidence to support or oppose the ConYE-based inferences. EnsembleFBA results are summarized in Figure S3 for all metabolites except tyramine, which was not present in any GENREs within the ensemble for Clostridium ASF356.
Valine was essential for growth of Clostridium ASF356 in all 100 GENREs in its ensemble. Isoleucine was essential for 85/100 GENREs but had no effect on growth for the other 15 GENREs, while absence of the rest of the potentially cross-fed metabolites had no effect on predicted growth rate. Given the in silico essentiality of valine and the ConYE results indicating valine was as abundant as expected, valine may have conferred a growth benefit to Clostridium ASF356 if cross-fed between Clostridium ASF356 and Parabacteroides ASF519. While isoleucine was essential for growth of the majority of GENREs in the Clostridium ASF356 ensemble, there was a subset of GENREs in which its removal had no effect. Given this in silico uncertainty, as well as the ConYE result which indicated it was more abundant than expected in coculture, we hypothesized that cross-feeding of isoleucine may not have influenced growth of Clostridium ASF356 as much as valine. Alanine, proline, choline, and formate were not essential and did not influence predicted growth rates in silico. Critically, however, this analysis indicated that availability of any of the individual metabolites in excess did not confer a growth benefit relative to the unsupplemented medium.
In vitro investigation of an inferred cross-feeding interaction
Given the lack of an in silico prediction which indicated that supplementation of a putatively-crossfed metabolite would increase the growth rate of Clostridium ASF356, we considered mechanisms through which the metabolites discussed above may interact with each other to influence growth, rather than in isolation as considered thus far. Clostridium ASF356 belongs to the Clostridium genus, throughout which amino acid fermentation via Stickland reactions is common (Mead, 1971). Stickland reactions involve coupling the oxidative deamination of one amino acid with the reductive decarboxylation of another amino acid, producing two short-chain fatty acids or branched chain fatty acids that each contain one fewer carbon than the respective amino acid from which they were derived (Nisman, 1954). Proline, glycine, hydroxyproline, and ornithine are strong Stickland reaction electron acceptors, while alanine, valine, leucine, and isoleucine are strong electron donors. We observed that Clostridium ASF356 consumed proline, a strong electron acceptor, and all the listed electron donors in monoculture, while Parabacteroides ASF519 produced proline, alanine, valine, and isoleucine and consumed leucine in monoculture. In co-culture, ConYE indicated that proline was significantly less abundant than expected, suggesting it was consumed more per unit biomass in co-culture than in monoculture. Given this observation and the lack of growth rate increase predicted in silico with excess proline available, we hypothesized that proline was of critical importance to the growth benefit for Clostridium ASF356 in co-culture with Parabacteroides ASF519, but depended on the presence of suitable electron donors. Behavior varied amongst the electron donors that may pair with proline in the Stickland reaction: isoleucine and alanine were more abundant than expected, while valine was as abundant as expected. The Stickland fermentation product for proline is 5-aminovalerate, which we could not identify within the NMR spectra due to spectral overlap with other metabolites and lack of signal in regions unique to 5-aminovalerate.
The products for isoleucine, valine, and alanine are valeric acid (not detected), isobutyrate (as abundant as expected), and acetate (less abundant than expected), respectively. Decreased abundance of leucine, which is fermented to isovalerate (less abundant than expected), in co-culture suggests decreased consumption by Clostridium ASF356 or increased consumption of isovalerate by Parabacteroides ASF519, which consumed isovalerate in monoculture.
To test the hypothesis that Clostridium ASF356 experiences a growth benefit in the presence of proline and suitable electron donors, we grew Clostridium ASF356 in media supplemented with proline, alanine, isoleucine, valine, or each combination of the three electron donors (alanine, isoleucine, valine) with proline. NMR spectroscopy cannot differentiate between amino acid isomers, so we assumed all amino acids consumed and produced were the L- isoform (as in tryptone, the major source of amino acids in the medium). Organisms conducting Stickland fermentation of proline generally possess a proline racemase, since D-proline is the isoform that is fermented (Watanabe et al., 2015). Leucine was consumed by both strains in monoculture, thus was excluded because it was unlikely to be cross-fed in co-culture. Only the monoculture supplemented with both proline and alanine had increased density relative to no supplement (Figure 6D, P < 0.05, Mann-Whitney U-test with false discovery rate control using Benjamini-Hochberg procedure), suggesting that co-metabolism of proline and alanine contributes to growth of Clostridium ASF356. Given that the ConYE results indicated that alanine was more abundant in co-culture than expected, the results of the supplementation experiment imply that production of alanine by Parabacteroides ASF519 was increased in coculture with Clostridium ASF356 or that Clostridium ASF356 used alanine more efficiently in co-culture. Additionally, the lack of growth benefit conferred by supplementation of proline with isoleucine or valine suggests that any change attributable to pairing either electron donor with proline was too small to detect given our sample size. Formate can also be used as an electron donor for proline reduction in the Stickland reaction (Kabisch et al., 1999), which we did not factor into our experiments. Formate was produced by Parabacteroides ASF519 and consumed by Clostridium ASF356 in monoculture, and was less abundant than expected in co-culture according to ConYE. Thus, formate may have also contributed to the observed growth benefit. After performing these supplementation experiments, we attempted identification of 5-aminovalerate in the supernatant from Clostridium ASF356 and Parabacteroides ASF519 co-culture using 2D 1H homonuclear correlation spectroscopy (COSY), which can identify metabolites with overlap in 1D NMR spectra (Figure S5; STAR Methods). 5-aminovalerate was not present at detectable quantities; the peaks within the overlapping region which we suspected to contain 5-aminovalerate were from valine and gamma-aminobutyrate (GABA). Thus, Stickland fermentation only occurred if 5-aminovalerate was further degraded. Such activity has been observed in Clostridium viride (formerly Clostridium aminovalericum), which converts 5-aminovalerate to valerate, acetate, propionate, and ammonia (Barker, 1985; Barker et al., 1987). Additionally, synthesis of GABA from glutamate is broadly distributed in plants and bacteria, and the responsible enzyme in some organisms is known to convert 5-aminovalerate to glutamate via promiscuous 5-aminovalerate transaminase activity (Shin et al., 2016; Yonaha et al., 1985). Both Clostridium ASF356 and Parabacteroides ASF519 have multiple putative proteins similar to known 5-aminovalerate transaminase enzymes (BLAST E value < 1E-50, 31–34% identity; compared to gabT gene from Pseudomonas putida KT2440), so either strain may be capable of producing GABA from 5-aminovalerate.
We also tested the effect of concurrent supplementation with Stickland pairs in silico, which did not lead to any predicted growth benefit because the GENREs do not contain Stickland fermentation reactions. Stickland reactions are absent from reaction databases used to construct and curate GENREs such as the ModelSEED biochemistry database (Henry et al., 2010), but are present in the AGORA resource ofó semiautomatically generated GENREs for gut microbes (Magnúsdóttir et al., 2017). None of the genes involved in Stickland fermentation have been identified in the genome of Clostridium ASF356 as of this writing (determined via searching the annotated Clostridium ASF356 genome in PATRIC (Wattam et al., 2017), BLAST against Dproline reductase gene subunits). Taken together, these results suggest that proline and alanine cosupplementation confers a growth benefit through an alternative pathway or through Stickland fermentation with subsequent breakdown of 5-aminovalerate.
Discussion
In this study, we used data-driven methods to identify metabolic signatures that may contribute growth modulation in bacterial co-cultures, proposed mechanisms by which a specific signature may arise, and verified that growth of the benefiting strain is enhanced when putatively-crossfed metabolites are supplemented in vitro. The biochemical capability we evaluated experimentally, Stickland fermentation of proline and alanine, is widely distributed in proteolytic Clostridia (Mead, 1971). While the ability of species inhabiting the mammalian gut to perform Stickland fermentation has been investigated, this study connects possible Stickland fermentation to a metabolic interspecies interaction that modulates growth. Given that some of the end products of Stickland fermentation were present at low concentrations in the fresh medium, and that Parabacteroides ASF519 consumed them in monoculture (isobutyrate, isovalerate, and isocaproate), our data suggest that this interaction may be bidirectional. This observation supports some theoretical motifs for metabolism in the gastrointestinal tract proposed in the literature, such as the model of carbon and nitrogen flow proposed by Fischbach and Sonnenburg in which Clostridia (e.g. Clostridium ASF356) ferment amino acids, providing ammonium and other amino acid fermentation products to Bacteroides (e.g. Parabacteroides ASF519, which was assigned to the genus Bacteroides prior to 2006) (Fischbach and Sonnenburg, 2011; Sakamoto and Benno, 2006). Clostridium ASF356 and Parabacteroides ASF519 are co-located along the mouse gastrointestinal tract, however the relevance of this observation is unclear given a microbiota as restricted in size as the ASF (Sarma-Rupavtarm et al., 2004). This kind of interaction has direct relevance to enteric pathogens, as emerging evidence indicates that in vivo utilization of proline via Stickland fermentation is highly active in Clostridium difficile during sustained infection in mice (Fletcher et al., 2018; Jenior et al.,2017a, 2017b).
We expect that the growth outcome observed in the co-culture of Clostridium ASF356 and Parabacteroides ASF519 is due to a multitude of interactions that each have a small effect. An alternative mechanism by which co-culture could enhance growth is consumption of growth-inhibiting metabolite products. Although we did not explore them in this study, ConYE identified several cases in which this process may have occurred. For example, in the co-culture of Lactobacillus ASF361 and Parabacteroides ASF519, lactate, hypoxanthine, AMP, and UMP were all metabolites produced by Lactobacillus ASF361 and consumed by Parabacteroides ASF519 that were less abundant than expected in co-culture. Of these metabolites, lactate is known to have potent antimicrobial properties both broadly and against Lactobacillus spp. (Shelef, 1994), thus it is a reasonable candidate for this mechanism.
We developed ConYE to interrogate growth-modulating interactions within this study, but the framework can be used to study interspecies interactions that alter other phenotypes of interest. For example, the same analyses conducted here could be performed using consumption of a substrate of interest, such as lactose, to calculate metabolite yields as a function of that substrate rather than as a function of strain abundance. In this scenario, ConYE could be used to identify co-culture pairings that enhance conversion of lactose to a metabolite of interest, and identify cross-fed metabolites that contribute to enhanced yield of that metabolite of interest.
There is increasing interest in developing methods for inference of growth or abundance-modulating interactions between microbes from various data types and environments (Friedman et al., 2017; Weiss et al., 2016; Xiao et al., 2017). These methods have primarily been focused on discovering interspecies interactions and the role they might play in ecosystem function, rather than ascribing mechanism to those interactions. Interspecies interactions are likely to be highly context-dependent, so more detailed knowledge about mechanisms of interaction is necessary to generalize these findings (Chamberlain et al., 2014). Several approaches that integrate the metabolic and/or spatial environment using genome-scale metabolic models have been developed that account for context dependency (Chan et al., 2017; Harcombe et al., 2014; Zomorrodi and Maranas, 2012). However, limitations in biochemical knowledge across the bacterial tree of life limit their broad application to other organisms. Large-scale efforts to collect and assimilate biochemical knowledge of gut microbes within genome-scale metabolic models are in progress, but experimental data to validate and improve the predictive ability of these models is lacking (Magnúsdóttir et al., 2017). Recent work to determine defined growth conditions for gut microbes will accelerate the process of experimental validation for such models, but data are still extremely sparse relative to organisms for which highly predictive metabolic models have been developed (Tramontano et al., 2018). Similar metabolic model-based approaches have been applied to simplified versions of communities such as the human gut microbiota (Bauer et al., 2017; Chan et al., 2017), but the poor experimental tractability of these systems makes testing predicted interspecies interactions challenging and thus they are left unvalidated.
Incorporating dynamic substrate utilization information may be able to provide more accurate insight into metabolic interactions than the method we present. We envision that our method may be used as an efficient screening step in which many species are grown across many media conditions to identify putative interactions. Then, in conditions with many putative interactions, sampling can be performed with finer time resolution to attain a clearer picture of the actual coupling of metabolite consumption and production with changes in growth of individual species, as previously performed with yeast and lactic-acid bacteria (Ponomarova et al., 2017). This framework, and others that model substrate utilization within a microbial community over time, could be modified with the strain abundance normalization procedure used within ConYE to identify dynamic features of emergent metabolic behavior in these communities (Erbilgin et al., 2017).
We have developed an experimental and computational pipeline to probe interspecies interactions and infer putative metabolic mechanisms of interaction, generating testable hypotheses. Understanding mechanisms of interspecies interaction and the environmental conditions that induce them is a prerequisite to engineering communities with specific therapeutic or industrial value. For generalizable methods that predict interspecies interaction using mechanistic models to be successful, methods must be validated experimentally. This task will require a substantially larger set of observed interspecies interactions than are presented here, or are available in the literature, from which to derive generalizable principles. Extending our approach and similar methods to defined communities across conditions that are more diverse, both in terms of resource availability and spatial structure, will begin to make predictive modeling of interspecies interactions tractable.
STAR Methods
CONTACT FOR REAGENT AND RESOURCE SHARING
Further information and requests for resources and reagents should be directed to and will be fulfilled by the Lead Contact, Jason Papin (papin@virginia.edu).
EXPERIMENTAL MODEL AND SUBJECT DETAILS
Strain maintenance
All strains are identified within the manuscript by their genus followed by the original isolate designation numbers for the ASF, and solely by their designation numbers within figures. Formal designations as shown in Figure 1B are as follows: Clostridium sp. ASF356, Lactobacillus intestinalis ASF360, Lactobacillus murinus ASF361, Eubacterium plexicaudatum ASF492, Pseudoflavonifractor sp. ASF500, and Parabacteroides goldsteinii ASF519. Mucispirillum schaedleri ASF457 was excluded from the study due to lack of detectable growth in the experimental medium, and Clostridium sp. ASF502 was excluded due to inconsistent growth in the experimental medium. Stock vials for all ASF strains were maintained at −80°C in 50% glycerol, 50% brainheart infusion (BHI) medium (see media formulations for the composition of brain-heart infusion media used in this study). All strains were grown in an anaerobic chamber (Shellab BACTRONEZ, Sheldon Manufacturing, Inc., Cornelius, Oregon, USA) filled with mixed anaerobic gas (5% CO2, 5% H2, 90% N2). Anaerobic conditions were ensured through the use of palladium catalysts (baked at 120°C when outside the chamber and rotat ed daily when first entering the chamber) and anaerobic indicator strips (Oxoid, Basingstoke, UK).
METHOD DETAILS
Media formulation
Supplemented Brain–Heart Infusion medium, referred to as BHI throughout the manuscript: Brain–Heart Infusion base (37g/L, BD, Franklin Lakes, NJ, USA), supplemented with yeast extract (5 g/L), 0.2mL of vitamin K1 solution (0.5% vitamin K1 dissolved in 99.5% ethanol), 0.5mL/L of hemin solution (0.5 g/L dissolved in 1% NaOH, 99% deionized water), L-cysteine (0.5 g/L) and 5mL/L each of newborn calf serum, horse serum, and sheep serum. Vitamin K1, hemin, and all sera were added after autoclaving the medium. For preparation of agar plates, agar was supplemented at 12g/L.
Modified Lennox LB medium, referred to as mLB throughout the manuscript: 30g/L LB base in powder form (Sigma, St Louis, MO, USA) was combined with 0.376g/L L-cysteine (Sigma), 39mL of a mineral salts solution (containing 6g/L KH2PO4, 6g/L (NH4)2SO4, 12g/L NaCl, 2.5g/L MgSO4•7H2O, 1.6g/L CaCl2•2H2O, all dissolved in deionized water), 15mL/L of hemin solution (0.5 g/L dissolved in 1% NaOH, 99% deionized water), 0.3mL of vitamin K1 solution (0.5% vitamin K1 dissolved in 99.5% ethanol), 15mL/L of lactose solution (5g/L lactose dissolved in deionized water) and 15mL/L of tween 20 solution (1g/L tween 20 dissolved in deionized water).
All supplements that were made using deionized water, or those that could not be autoclaved, were filtersterilized using a 0.22μm membrane (except the sera).
In vitro monoculture and co-culture growth experiments in 12-well plates
Strains were inoculated from frozen stock to grow a dense lawn on agar plates containing BHI media. Prior to inoculation, all agar plates were equilibrated inside an anaerobic chamber for at least 24 hours. Inoculated plates were incubated for 3–9 days before being used to start overnight cultures. For overnight cultures, 50mL of mLB broth in a 500mL glass flask was inoculated using a generous streak from the lawn of each strain, then each flask was covered with a Breathe-Easy membrane (Diversified Biotech, Dedham, Massachusetts, USA). After 18–24 hours of incubation at 37°C, overnight cultures were transferred to 50mL conical tubes, sealed, transferred out of the chamber, and centrifuged at 1500 ×g for 5 minutes. After centrifugation, samples were transferred into the chamber, supernatant was poured off, and pellets were resuspended in 12.7mL mLB broth. The resuspension for each species was then diluted to make inoculant with the same concentration of cells as a solution at an optical density of 0.01, measured at OD600 with 100uL of sample volume in a flat-bottom 96well plate (with a well diameter of 0.64cm) using a Tecan infinite m200 plate reader (Tecan Group Ltd., Männedorf, Switzerland). This final inoculant was then used to inoculate mLB broth in 12-well plates. For monoculture samples, 100uL of inoculant was added to 2.9mL of media. For co-culture samples, 100uL of each strain’s inoculant was added to 2.8mL of media. 12-well plates were covered with a Breathe-Easy membrane, then the 12-well plate lid was placed on top of the membrane. Inoculated, covered 12-well plates were incubated at 37°C for 72 hours.
After 72 hours of incubation, 12-well plates were removed from the incubator and membranes were opened for each well using a razor. For each well, the sample was mixed by pipetting 900μL three times, then 1.8 mL of sample was transferred to a 2mL snap-cap tube. 200μL of sample was also collected after mixing and transferred to a 96-well plate to measure optical density at OD600. Samples within 2mL tubes were then transferred out of the chamber and centrifuged at 18407 ×g for 2 minutes. After centrifugation, supernatant was poured directly into a 3mL syringe attached to a syringe pump filter (0.22μm pore size, mixed cellulose ester filter) and filtered into a 2mL snap-cap tube. Cell pellets were then resuspended in 400uL Qiagen lysis buffer (Buffer ASL, Qiagen) and vortexed until thoroughly mixed. Resuspended pellets and spent media were then frozen at −80°C.
To ensure reproducibility, 3 experiments were performed in which independent overnight starter cultures were used to inoculate 3 samples per monoculture and co-culture condition (resulting in 9 total replicates). For the third experiment, Eubacterium ASF492 and Pseudoflavonifractor ASF500 did not appear to grow in monoculture according to both OD600 and qPCR, and their metabolomes did not appear significantly different than any negative controls, so all sample groups containing Eubacterium ASF492 and Pseudoflavonifractor ASF500 in the third experiment were excluded from analyses. As a result, those sample groups have N = 6 replicates throughout the study.
In vitro amino acid supplementation experiments
Inoculant for Clostridium ASF356 was prepared as described for monoculture and co-culture experiments in 12-well plates. Solutions of amino acids in deionized water were filter-sterilized (0.22μm pore size) and transferred to the anaerobic chamber and allowed to equilibrate for one week. Equilibrated solutions were mixed with liquid mLB broth (prepared as described previously), generating solutions that contained 90% mLB and 10% supplement by volume. Final concentrations were 1.25g/L for single amino acid supplements and 1.25g/L of each of two amino acids for supplements containing two amino acids (i.e. individual amino acids are at the same concentration in supplements containing one or two amino acids). 96-well plates were filled with 193μL media and 7μL inoculant (approximately the same initial density as in 12-well experiments), covered with a Breathe-Easy membrane, then incubated at 37°C for 72 hours. After incubation, the 96-well plates were removed from the anaerobic chamber, the breatheasy membrane was peeled off each plate, and the OD600 was measured in the 96 well plate.
DNA extraction
Zirconia beads (1mm; BioSpec Products) were added to samples in ASL buffer (QIAmp Stool kit), and samples disrupted using a Mini-Beadbeater (15s, two times), followed by heat treatment (5 min, 90°C, 800rpm; Eppendorf Thermomixer). Debris was pelleted (14,000 ×g, 1 min), and 400μL transferred to a QIAcube rotor adapter. Total DNA from each sample isolated on the QIAcube using the ‘human stool’ protocol provided by the manufacturer and stored at −20°C prior to PCR. Purified DNA used for standards in PCR assays was quantified using the DeNovix dsDNA kit. DNA standards were adjusted to 2ng/μL and diluted 10-fold to generate standard curves in PCR assays.
Hydrolysis probe-based qPCR assay design
4-plex (including Clostridium ASF356, Eubacterium ASF492, Clostridium ASF502, and Parabacteroides ASF519) and 3-plex (Lactobacillus ASF360, Lactobacillus ASF361, and Pseudoflavonifractor ASF500) hydrolysis probe-based quantitative polymerase chain reaction (qPCR) assays were designed to quantify the abundance of each strain’s DNA with high specificity and throughput (Holland et al., 1991). Probe and primer design began with the groEL gene, which encodes the highly-conserved molecular chaperone GroEL, as a putative target. The National Center for Biotechnology Information PrimerBLAST web interface was used to identify PCR targets for each strain with minimal sequence similarity with any region in another strain’s genome (Ye et al., 2012). PCR products ranging from 70–200 base pairs with a calculated melting temperature between 57°C and 63°C were determined, requiring at least two mismatches with unintended targets, with at least two mismatches occurring within the last five base pairs at the 3’ end. We screened the top three primer pairs for each strain returned by PrimerBLAST for sensitivity and specificity using standard SYBR green chemistry, and determined that all primers for Lactobacillus ASF360, Lactobacillus ASF361, and Pseudoflavonifractor ASF500 had poor sensitivity. To identify alternative PCR products for Lactobacillus ASF360, Lactobacillus ASF361, and Pseudoflavonifractor ASF500, we performed BLAST for each putative gene in each strain against all other putative genes in ASF strains. For genes with no off-target hits (E-value > 1.0 for all comparisons), we attempted primer design using PrimerBLAST until a gene was found for each strain with at least 4 suitable primer pairs. All 4 primer pairs for the remaining ASF strains were screened for specificity and sensitivity and at least one suitable primer pair was found for each strain.
For all 7 strains in the qPCR assays, probes were then designed for each primer pair. The 7 strains were split into a 3-plex and 4-plex reaction based on typical density observed experimentally, with strains growing to higher densities in the 4-plex reaction and strains growing to lower densities in the 3-plex reaction. For each probe in each reaction, we performed multiple sequence alignment using Clustal Omega (Sievers et al., 2011). Suitable probe sequences were identified manually according to five criteria: 1) maximize the number of mismatches at the 5’ end of the probe, 2) probe length between 20–30 base pairs, 3) estimated melting temperature around 66–70°C, 4) 35–65% GC co ntent, and 5) no G or C at the 5’ end of the probe. Final primers, products, probe sequences, and accompanying probe fluorophores and quenchers are provided in Table S1. Since only relative comparisons within each strain are made, the effects of non-single copy genes do not confound the data.
Primers and probes were synthesized by Integrated DNA Technologies, Inc. (Coralville, Iowa, USA). PerfeCTa 5X MultiPlex qPCR ToughMix (Quantabio, Beverly, MA) was used for all reactions. Each PCR reaction (20μL total volume) contained ToughMix (1X concentration), 300nM of each forward primer, 300nM of each reverse primer, and 100nM of each probe, with 4μL of DNA sample. The optimal cycling conditions were determined to be: initial denaturation of 3min @ 95°C followed by 40 cycles of 15s @ 95°C and 30s @ 61°C. All assays achieved an efficiency between 91.4% and 100.5%, except for Cy5 quantification in the first and third of 3 total 96-well plates used in the study. These assays achieved an efficiency of 124.4% and 138.8%, respectively. Efficiency was calculated using a diluted DNA standard (10-fold dilution starting with 2ng/μL down to 0.002 ng/μL) for each strain created using purified genomic DNA. Each PCR plate contained independent standard curves. Reactions were run using the BioRad CFX Touch, and analyzed using the software provided (where Cq value is equated to DNA concentration based on the standard curve).
Throughout the manuscript, qPCR data are presented as abundance values for each strain, which are z-score normalized using the mean monoculture abundance to center the data (i.e. mean value from each strain’s monoculture corresponds to a z-score of 0) and the standard deviation of monoculture abundance to scale the data. Thus, the z-score for the abundance of a strain can be compared across any condition. Abundance of every strain was quantified in all samples (including negative controls), and cross-contamination was not detected in any sample.
Mono- and co-culture growth curve experiments
Inoculant was prepared as described for 12-well experiments, wells were inoculated using the same starting cell density as used in 12-well experiments, and identical growth conditions were used. Optical density was measured at 589nm using a miniaturized plate reader (Jensen et al., 2015). Experiments were performed in 96 well plates with 200uL total volume in each well and a breatheasy membrane. Each sample group (monocultures and co-cultures) contains 8 biological replicates from a single experiment (e.g. each replicate was grown in an independent well, but they were derived from the same starter culture). After 72 hours, samples were removed from the anaerobic chamber, the breatheasy membrane was removed, and the endpoint optical density was recorded in a Tecan Infinite m200 plate reader (Tecan Group Ltd, Männedorf, Switzerland) at OD600. This endpoint optical density was used to linearly scale the values from the miniaturized plate reader. Raw and scaled growth curve data are available in the github repository accompanying the paper.
1H nuclear magnetic resonance spectroscopy-based metabolomics
Samples were prepared for 1H NMR spectroscopy as described by Dona et al. (Dona et al., 2014). Samples were thawed at room temperature and centrifuged at 12000 ×g at 4°C for 10 minutes, before 540 μl of supernatant was combined with 60 μl of buffer (pH 7.4; 1.5mM KH2PO4, 0.1% TSP (3-(trimethylsilyl)propionic- 2,2,3,3-d4 acid sodium salt) in 100% D2O) and transferred to a SampleJet NMR tube (Bruker BioSpin, Rheinstetten, Germany). Standard one-dimensional (1D) 1H-NMR spectra with water pre-saturation were acquired at 300 K using a 600 MHz Avance III spectrometer (Bruker), equipped with a SampleJet autosampler (Bruker). A total of 32 scans were collected into 64000 data points for each sample. Spectra were automatically phased, baseline corrected and calibrated to the TSP resonance at δ1H 0 in Topspin 3.1 software (Bruker). The spectra were imported into MATLAB R2014a (The Mathworks, Inc., Natick, MA, USA). Biologically irrelevant regions of the spectra were removed (TSP resonance at δ1H 0 and residual water peak δ 1 H 4.5– 5.2) before peak alignment by recursive segment-wise peak alignment (RSPA) (Veselkov et al., 2009). The loadings of pairwise principal component analysis models, as well as manual comparisons between fresh media spectra and spent media of each bacterial strain, were used to assign metabolite identities to peaks. To further identify metabolites that may only have been produced or consumed in co-culture, group means for all 15 co-culture conditions were compared to fresh media across the entire spectra. The relevant regions of the spectra were integrated to calculate relative spectral intensities for each metabolite. Metabolite identities were assigned by reference to known spectra in multiple databases. For all analyses, integrals were centered by subtracting the mean value for each metabolite in the blank samples, then scaled by the maximum absolute value of all centered values (so that the minimum and maximum possible scaled values for each metabolite were −1 and +1, respectively). We assume that concentration is proportional to the integrated peak area for each metabolite across all samples, thus relative concentrations can be inferred for each metabolite across all samples. After 72 hours of growth in this medium, pH ranges from 5.48–6.55 for these strains, thus only minor pH-dependent effects may be present in the spectra. The peak integral values, scaled values, peak integration regions and identities, and associated R code for analysis and visualization is available in the github repository. Raw spectra are available in the Metabolights database under identifier MTBLS705 (Kale et al., 2016).
Additional two-dimensional (2D) NMR experiments (1H-1H correlation spectroscopy [COSY]) were performed on a selected sample of supernatant from co-culture of Clostridium ASF356 and Parabacteroides ASF519 to assist with metabolite identification (Beckonert et al., 2007). For these experiments a total of 512 increments with 4 scans were acquired into 2 k data points with a spectral width of 12 ppm for each dimension.
QUANTIFICATION AND STATISTICAL ANALYSIS
Differential abundance testing
DNA quantification data for each sample group (each strain in monoculture and each unique co-culture condition) were tested for normality using the Shapiro-Wilk test (implemented via the shapiro.test function in R version 3.4.2) (Royston, 1982). The data for all but one monoculture sample groups were normally distributed, but the majority of co-culture sample groups were non-normally distributed, so the non-parametric MannWhitney U-test was chosen to test for differential DNA abundance. The same procedure was performed for the metabolomic data, and the majority of sample groups and metabolites were found to be non-normally distributed, so the Mann-Whitney U-test was performed to test for differential metabolite abundance as well, identifying metabolites as either produced, consumed, or unchanged based on testing results and the value of the group mean relative to the fresh media. For tests of differential abundance, the false discovery rate (FDR) was controlled using the Benjamini-Hochberg procedure (Benjamini and Hochberg, 1995). For DNA differential abundance testing, the number of sample groups used for FDR control was 21 (6 monocultures and 15 cocultures). For metabolite differential abundance testing, the number of sample groups used for FDR control was 1806 (21 mono- and co-culture groups, each with 86 integrated metabolite peaks that were tested for differential abundance against fresh media samples). The results of all normality and differential abundance testing, and notebooks performing the calculations, are available in the github repository accompanying this work.
Principal Component Analysis (PCA)
PCA was performed on integrated peak values using the PCA function implemented in sci-kit learn (v0.19.2) in python v3.6 (Pedregosa et al., 2011).
Constant Yield Expectation (ConYE) model
For each sample group, metabolite integrals were centered by subtracting the mean value of the metabolite integral in fresh medium (i.e. negative control). Centered integrals were then scaled by the max of the absolute values across all sample groups for each metabolite, resulting in values for each metabolite being scaled between −1 and +1, with at least one sample group taking a value of −1 or +1 for each metabolite. For each monoculture sample group, the mean of each scaled, centered metabolite was then divided by the mean DNA abundance of the corresponding strain, resulting in a metabolite yield specifying the amount of increase or decrease of a metabolite per unit of DNA for each strain. For each co-culture sample, the expected concentration of each metabolite was determined by multiplying the abundance of each strain in co-culture by the monoculture-derived yield, summing the two quantities from each strain, then subtracting the concentration of the metabolite in the fresh medium using the mean across negative controls (N=9). Using the calculated expected concentration from all samples within a co-culture group, deviation from expectation was determined by comparing expected concentrations to the observed concentrations in co-culture. Differential abundance was determined using the Mann-Whitney U-test with FDR control via the Benjamini-Hochberg procedure (Benjamini and Hochberg, 1995) and the mean of differences between expected and observed concentrations was recorded. The sample size used for FDR control was 1290 (15 co-culture groups, each compared to a simulated ConYE value for each of 86 metabolites). We explored the effect of variation in metabolite yields by leave-two-out bootstrap sampling of monocultures when performing the average yield calculation, followed by completion of the rest of ConYE for each subsample, and did not find that the results of significance testing were influenced by this subsampling (Figure S4). Jupyter notebooks performing the calculations for ConYE, the results of all tests, and the exploration of yield bootstrapping are available in the github repository accompanying this work.
Draft genome-scale metabolic network reconstruction and analysis
Draft genome-scale metabolic network reconstructions (GENREs) were generated for Clostridium ASF356, Lactobacillus ASF360, Lactobacillus ASF361, Eubacterium ASF492, Pseudoflavonifractor ASF500, Clostridium ASF502 (not included in the present study), and Parabacteroides ASF519 using a local installation of ProbModelSEED (Benedict et al., 2014; Henry et al., 2010). Draft genome sequences for the strains from the same experimental stock used in this study were used as input to ProbModelSEED (Wannemuehler et al., 2014). Briefly, ProbModelSEED annotates the genome for each organism to identify metabolic functions associated with genes or sets of genes. This process results in a draft GENRE containing high-confidence reactions for each species. To enable biomass production in the GENRE, gapfilling is performed with uptake enabled for any metabolite with a transporter annotated in the draft GENRE (i.e. simulating a rich medium). The resulting GENRE contains the original reactions associated with the organism’s annotated genome, as well as non-gene associated reactions added to enable biomass production. ProbModelSEED also assigns reaction probabilities to each reaction that can be added during gapfilling, which are derived using sequence similarity for genes which did not meet the similarity threshold for annotation via RAST, or reactions for which portions of a complex were not detected. These probabilities are incorporated during gapfilling, leading to preferential addition of reactions for which there was some genetic evidence.
Metabolomics-constrained gapfilling
After generation of draft GENREs, we added functionality to the GENREs using a previously-generated supernatant metabolomics dataset in which the same ASF strains were grown in the same medium used in this study (Biggs et al., 2017). Using the original metabolite annotations for the dataset, we constrained the GENRE for each ASF strain by forcing production and consumption of any metabolite with a z-score normalized abundance of > +1 or < −1, respectively. Z-scores from the publication from which the data were drawn were used. This constraint was enforced by setting the lower bound of the exchange reaction for produced metabolites to 0.001 mmol/(g dry weight * hour), and the upper bound for exchange reactions for consumed metabolites to −0.001 mmol/(g dry weight * hour). The value of the constraint (0.001 mmol/(g dry weight * hour)) was chosen to be arbitrarily low, since absolute changes in metabolite concentrations were not derived in the metabolomics dataset used for gapfilling. Then, we set the remaining boundary conditions for each GENRE to represent the medium in which they were grown (as described in the in silico simulations section), and forced arbitrarily low flux through the biomass reaction (0.005/hour). Then, we checked for transporters for each metabolite for each strain that enabled import (for consumed metabolites) and export (for produced metabolites). If a suitable transport reaction was not present, we added a transporter from the ModelSEED biochemistry database and constrained the directionality to be as observed (e.g. import only for consumed metabolites, export only for produced metabolites). Transporter assignments are provided in Table S2. We then performed gapfilling using a modified version of the SMILEY algorithm (Reed et al., 2006) as implemented in Cobrapy v0.5.11. See “Metabolomics-constrained gapfilling” for exact algorithmic details. We used the set of all ProbModelSEED reactions for which reaction probabilities were assigned as the universal reactions for gapfilling, but excluded reactions containing O2. We weighed the penalty for addition of each of these reactions by 1 - p, where p is the reaction probability, which ranges from 0 for unlikely reactions to 1 for highly likely reactions. The effect of this penalty is that high-probability reactions are assigned lower penalties, and are thus more likely to be added to the GENRE during gapfilling. For each ASF strain, metabolomicsconstrained gapfilling was performed 10 times, each for 10 iterations, resulting in an ensemble of 100 GENREs. All 100 GENREs for each strain were unique (i.e. none of the iterations resulted in identical reaction sets being added to the draft GENRE).
Metabolomics-constrained gapfilling algorithm
Metabolomics-constrained gapfilling was performed to ensure the GENRE for each species could produce biomass in the in vitro medium and produce and consume metabolites as determined by supernatant metabolomics. We used a modified version of the growmatch algorithm (Reed et al., 2006) with variable reaction penalties calculated in ProbModelSEED (Benedict et al., 2014). We implemented and applied the modified version of our algorithm in cobrapy v0.5.11 (Ebrahim et al., 2013). The algorithm is formally defined as:
Where c = 1 − p and is the reaction cost associated with including each reaction from the universal reaction bag, p is the probability of each reaction (derived from sequence information using ProbModelSEED; reactions not assigned a probability receive a probability of 0) and a is the integer indicator for each reaction j in the universal reaction bag used during gapfilling (here, we use the ModelSEED biochemistry database). s is the stoichiometric matrix, v is the vector of fluxes through each reaction represented in the stoichiometric matrix, U is the universal reaction bag, y is the vector of fluxes through reactions in the universal reaction bag (which is multiplied by the integer a to force flux to take a zero or non-zero value), Vbiomass is flux through the biomass reaction (which we constrain to take a minimum value of 0.005 ℎr−1 to force an arbitrarily low, non-zero amount of growth), vk are the fluxes through exchange reactions for metabolites that were designated as produced, vg are the fluxes through exchange reactions for metabolites that were designated as consumed, and i is the index for each reaction within the GENRE.vlb, the lower bound of flux through a reaction, was 0 for irreversible reactions and −1000 for reversible reactions. vub, the upper bound of flux through a reaction, was 1000 for all reactions.vlbfor exchange reactions were set to −1000 for all metabolites detected in the medium by NMR spectroscopy and 0 for metabolites not detected.
We performed gapfilling for 10 independent runs for each species, in which each run had 10 dependent iterations that each generate a solution containing a set of reactions that, when added to the GENRE and activated, satisfy the constraints (all metabolites can be produced and consumed as indicated, and biomass can be produced). Within each run, the penalty for each reaction was increased by setting c = 2c to encourage unique solutions. For reactions in the ModelSEED biochemistry that did not receive probabilities because they have no associated gene (e.g. spontaneous reactions), we set c = 100 to discourage addition of these reactions unless they were essential for any solution to be found. After each of 10 independent runs, reaction penalties were reset to their original value prior to beginning the next run. We reduced the integrality threshold in cobrapy to 1E-8 from the original value of 1E-6, because the default setting returned many solutions that did not satisfy the constraints applied due to numerical error for Lactobacillus ASF361 (e.g. the reaction list returned did not enable biomass production for this species because reactions from the universal reaction bag had values for y that were below 1E-6; decreasing the integrality threshold properly returned these reactions and anabled biomass production). For every ASF strain, all 100 GENREs constructed were unique.
GENRE quality control
All GENREs within the ensemble for each strain were assessed for mass balance. To perform this assessment, an intracellular demand reaction was added for each metabolite in the GENRE, and all exchange reactions were closed. Flux through each demand reaction was then optimized iteratively, and demand reactions that could carry flux indicated presence of a mass-imbalanced reaction that allowed spontaneous generation of the metabolite. This process identified three reactions in the draft GENREs that were massimbalanced (SEED ids: rxn15543 in Parabacteroides ASF519 GENRE; rxn33894 and rxn30984 in Lactobacillus ASF361). These reactions were removed from the draft GENREs, and the metabolomicsconstrained gapfilling process was repeated using the draft GENREs with the reactions removed. These reactions have been removed from the ModelSEED biochemistry database since the generation of these draft GENREs.
All GENREs within the ensemble for each strain were also assessed for infeasible ATP production. Using boundary conditions that mimic the in vitro medium (as in in silico simulations, below), we optimized flux through an ATP demand reaction, and found that all GENREs for all strains generated between 0.5 and 1.9 mmol ATP/(g dry weight * hour). Normalizing this value by the uptake of lactose, which was 0.22 mmol/(g dry weight * hour) for all strains, gives a yield range of 2.27–8.64 units of ATP per unit of lactose, within reason for anaerobic organisms (for example, Escherichia coli is known to produce 2.2–3.2 units of ATP per unit of glucose when grown anaerobically) (Muir et al., 1985). Although erroneous energy generating cycles may be present in the GENREs presented here, the realistic ATP yield determined for all GENREs suggests they are unlikely to influence simulation results in this media condition.
In silico simulations
Flux balance analysis (FBA) was performed using version 0.8.1 of the cobrapy package (Ebrahim et al., 2013). Ensembles of GENREs were analyzed using Cobrapy methods through the Medusa package (unpublished, https://github.com/gregmedlock/Medusa/). Media composition was determined by calculating exact concentrations for defined supplements (Hemin, Vitamin K1, Lactose, Tween-20), and a concentration of 1mM was assumed to allow an uptake rate of 1 mmol/(g dry weight * hour). For media components with approximately known concentrations in LB (amino acids), the uptake rate was set to 5 mmol/(g dry weight * hour) based on a concentration of around 5 mM for most amino acids in LB (Sezonov et al., 2007). For components detected via metabolomics that were not amino acids or supplemented, and therefore likely originated from the yeast extract in LB, the maximal uptake rate was set to 0.1mmol/(g dry weight * hour). For in silico media supplements and knockouts, a metabolite was considered essential if removal of the metabolite from the in silico medium caused the flux through biomass to fall below 1E-5/hour (used because of limits of numerical precision for the solvers used; use of a lower threshold (1E-10/hr) does not affect these results).
DATA AND SOFTWARE AVAILABILITY
All raw and processed data and all code used in this project except software used to process raw NMR spectra are available at https://github.com/gregmedlock/asf_interactions. Where possible, Jupyter notebooks (Kluyver et al., 2016) are used for reproducibility and to display results alongside corresponding analyses. The raw NMR spectra have been deposited in Metabolights under MTBLS705.
Supplementary Material
Highlights.
In vitro monoculture and co-culture of 6 members of a defined murine microbiota
Growth and metabolome profiling to identify ecological and metabolic interactions
Development and application of constant yield expectation (ConYE) model
Testing of inferred cross-feeding that contributed to commensal interaction
Acknowledgements
We acknowledge the UVA ARCS staff for assistance setting up software used for gapfilling on the UVA computing cluster. We thank Jie Liu for helpful guidance on hydrolysis probe design for qPCR, and Thomas Moutinho for experimental assistance performing sample extraction. We thank all members of the Papin lab for helpful project feedback. We acknowledge funding from National Institutes of Health R01GM108501, T32LM012416, and T32GM008136.
Footnotes
Declaration of interests
The authors declare no competing interests.
Publisher's Disclaimer: This is a PDF file of an unedited manuscript that has been accepted for publication. As a service to our customers we are providing this early version of the manuscript. The manuscript will undergo copyediting, typesetting, and review of the resulting proof before it is published in its final citable form. Please note that during the production process errors may be discovered which could affect the content, and all legal disclaimers that apply to the journal pertain.
References
- Barker HA (1985). Pathway of 5-Aminovalerate Degradation by Clostridium aminovalericum In Current Topics in Cellular Regulation, Levine RL, and Ginsburg A, eds. (Academic Press; ), pp. 349–354. [DOI] [PubMed] [Google Scholar]
- Barker HA, D’Ari L, and Kahn J (1987). Enzymatic reactions in the degradation of 5-aminovalerate by Clostridium aminovalericum. J. Biol. Chem. 262, 8994–9003. [PubMed] [Google Scholar]
- Bauer E, Zimmermann J, Baldini F, Thiele I, and Kaleta C (2017). BacArena: Individual-based metabolic modeling of heterogeneous microbes in complex communities. PLoS Comput. Biol. 13, e1005544. [DOI] [PMC free article] [PubMed] [Google Scholar]
- Beckonert O, Keun HC, Ebbels TMD, Bundy J, Holmes E, Lindon JC, and Nicholson JK (2007). Metabolic profiling, metabolomic and metabonomic procedures for NMR spectroscopy of urine, plasma, serum and tissue extracts. Nat. Protoc 2, 2692–2703. [DOI] [PubMed] [Google Scholar]
- Benedict MN, Mundy MB, Henry CS, Chia N, and Price ND (2014). Likelihood-based gene annotations for gap filling and quality assessment in genome-scale metabolic models. PLoS Comput. Biol. 10, e1003882. [DOI] [PMC free article] [PubMed] [Google Scholar]
- Benjamini Y, and Hochberg Y (1995). Controlling the False Discovery Rate: A Practical and Powerful Approach to Multiple Testing. J. R. Stat. Soc. Series B Stat. Methodol 57, 289–300. [Google Scholar]
- Biggs MB, and Papin JA (2017). Managing uncertainty in metabolic network structure and improving predictions using EnsembleFBA. PLoS Comput. Biol. 13, e1005413. [DOI] [PMC free article] [PubMed] [Google Scholar]
- Biggs MB, Medlock GL, Moutinho TJ, Lees HJ, Swann JR, Kolling GL, and Papin JA (2017). Systems-level metabolism of the altered Schaedler flora, a complete gut microbiota. ISME J 11, 426–438. [DOI] [PMC free article] [PubMed] [Google Scholar]
- Britton RA, and Young VB (2014). Role of the intestinal microbiota in resistance to colonization by Clostridium difficile. Gastroenterology 146, 1547–1553. [DOI] [PMC free article] [PubMed] [Google Scholar]
- Brugiroux S, Beutler M, Pfann C, Garzetti D, Ruscheweyh H-J, Ring D, Diehl M, Herp S, Lötscher Y, Hussain S, et al. (2016). Genome-guided design of a defined mouse microbiota that confers colonization resistance against Salmonella enterica serovar Typhimurium. Nat Microbiol 2, 16215. [DOI] [PubMed] [Google Scholar]
- Buffie CG, and Pamer EG (2013). Microbiota-mediated colonization resistance against intestinal pathogens. Nat. Rev. Immunol. 13, 790–801. [DOI] [PMC free article] [PubMed] [Google Scholar]
- Chamberlain SA, Bronstein JL, and Rudgers JA (2014). How context dependent are species interactions? Ecol. Lett. 17, 881–890. [DOI] [PubMed] [Google Scholar]
- Chan SHJ, Simons MN, and Maranas CD (2017). SteadyCom: Predicting microbial abundances while ensuring community stability. PLoS Comput. Biol. 13, e1005539. [DOI] [PMC free article] [PubMed] [Google Scholar]
- Dewhirst FE, Chien CC, Paster BJ, Ericson RL, Orcutt RP, Schauer DB, and Fox JG (1999). Phylogeny of the defined murine microbiota: altered Schaedler flora. Appl. Environ. Microbiol. 65, 3287–3292. [DOI] [PMC free article] [PubMed] [Google Scholar]
- Dona AC, Jiménez B, Schäfer H, Humpfer E, Spraul M, Lewis MR, Pearce JTM, Holmes E, Lindon JC, and Nicholson JK (2014). Precision high-throughput proton NMR spectroscopy of human urine, serum, and plasma for large-scale metabolic phenotyping. Anal. Chem. 86, 9887–9894. [DOI] [PubMed] [Google Scholar]
- Ebrahim A, Lerman JA, Palsson BO, and Hyduke DR (2013). COBRApy: COnstraints-Based Reconstruction and Analysis for Python. BMC Syst. Biol. 7, 74. [DOI] [PMC free article] [PubMed] [Google Scholar]
- Erbilgin O, Bowen BP, Kosina SM, Jenkins S, Lau RK, and Northen TR (2017). Dynamic substrate preferences predict metabolic properties of a simple microbial consortium. BMC Bioinformatics 18, 57. [DOI] [PMC free article] [PubMed] [Google Scholar]
- Fischbach MA, and Sonnenburg JL (2011). Eating for two: how metabolism establishes interspecies interactions in the gut. Cell Host Microbe 10, 336–347. [DOI] [PMC free article] [PubMed] [Google Scholar]
- Fletcher JR, Erwin S, Lanzas C, and Theriot CM (2018). Shifts in the Gut Metabolome and Clostridium difficile Transcriptome throughout Colonization and Infection in a Mouse Model. mSphere 3. [DOI] [PMC free article] [PubMed] [Google Scholar]
- Friedman J, Higgins LM, and Gore J (2017). Community structure follows simple assembly rules in microbial microcosms. Nat Ecol Evol 1, 109. [DOI] [PubMed] [Google Scholar]
- Geuking MB, Cahenzli J, Lawson MAE, Ng DCK, Slack E, Hapfelmeier S, McCoy KD, and Macpherson AJ (2011). Intestinal bacterial colonization induces mutualistic regulatory T cell responses. Immunity 34, 794–806. [DOI] [PubMed] [Google Scholar]
- Gillis CC, Hughes ER, Spiga L, Winter MG, Zhu W, Furtado de Carvalho T, Chanin RB, Behrendt CL, Hooper LV, Santos RL, et al. (2018). Dysbiosis-Associated Change in Host Metabolism Generates Lactate to Support Salmonella Growth. Cell Host Microbe 23, 54–64.e6. [DOI] [PMC free article] [PubMed] [Google Scholar]
- Goldford JE, Lu N, Bajic D, Estrela S, Tikhonov M, Sanchez-Gorostiaga A, Segre D, Mehta P, and Sanchez A (2017). Emergent Simplicity in Microbial Community Assembly. [DOI] [PMC free article] [PubMed] [Google Scholar]
- Harcombe WR, Riehl WJ, Dukovski I, Granger BR, Betts A, Lang AH, Bonilla G, Kar A, Leiby N, Mehta P, et al. (2014). Metabolic resource allocation in individual microbes determines ecosystem interactions and spatial dynamics. Cell Rep. 7, 1104–1115. [DOI] [PMC free article] [PubMed] [Google Scholar]
- Harp JA, Chen W, and Harmsen AG (1992). Resistance of severe combined immunodeficient mice to infection with Cryptosporidium parvum: the importance of intestinal microflora. Infect. Immun. 60, 3509–3512. [DOI] [PMC free article] [PubMed] [Google Scholar]
- Henry CS, DeJongh M, Best AA, Frybarger PM, Linsay B, and Stevens RL (2010). High-throughput generation, optimization and analysis of genome-scale metabolic models. Nat. Biotechnol. 28, 977–982. [DOI] [PubMed] [Google Scholar]
- Holland PM, Abramson RD, Watson R, and Gelfand DH (1991). Detection of specific polymerase chain reaction product by utilizing the 5’--−−3’exonuclease activity of Thermus aquaticus DNA polymerase. Proceedings of the National Academy of Sciences 88, 7276–7280. [DOI] [PMC free article] [PubMed] [Google Scholar]
- Ivanov II, Atarashi K, Manel N, Brodie EL, Shima T, Karaoz U, Wei D, Goldfarb KC, Santee CA, Lynch SV, et al. (2009). Induction of intestinal Th17 cells by segmented filamentous bacteria. Cell 139, 485–498. [DOI] [PMC free article] [PubMed] [Google Scholar]
- Jenior ML, Leslie JL, Young VB, and Schloss PD (2017a). Clostridium difficile Colonizes Alternative Nutrient Niches during Infection across Distinct Murine Gut Microbiomes. mSystems 2. [DOI] [PMC free article] [PubMed] [Google Scholar]
- Jenior ML, Leslie JL, Young VB, and Schloss PD (2017b). Clostridium difficile differentially alters the structure and metabolism of distinct cecal microbiomes to promote persistent colonization during infection. [DOI] [PMC free article] [PubMed] [Google Scholar]
- Jensen PA, Dougherty BV, Moutinho TJ Jr, and Papin JA (2015). Miniaturized plate readers for lowcost, high-throughput phenotypic screening. J. Lab. Autom. 20, 51–55. [DOI] [PMC free article] [PubMed] [Google Scholar]
- Kabisch UC, Gräntzdörffer A, Schierhorn A, Rücknagel KP, Andreesen JR, and Pich A (1999). Identification of d-Proline Reductase fromClostridium sticklandii as a Selenoenzyme and Indications for a Catalytically Active Pyruvoyl Group Derived from a Cysteine Residue by Cleavage of a Proprotein. J. Biol. Chem. 274, 8445–8454. [DOI] [PubMed] [Google Scholar]
- Kale NS, Haug K, Conesa P, Jayseelan K, Moreno P, Rocca-Serra P, Nainala VC, Spicer RA, Williams M, Li X, et al. (2016). MetaboLights: An Open-Access Database Repository for Metabolomics Data. Curr. Protoc. Bioinformatics 14–13. [DOI] [PubMed] [Google Scholar]
- Kluyver T, Ragan-Kelley B, Pérez F, Granger BE, Bussonnier M, Frederic J, Kelley K, Hamrick JB, Grout J, Corlay S, et al. (2016). Jupyter Notebooks-a publishing format for reproducible computational workflows. In ELPUB, pp. 87–90. [Google Scholar]
- Lawley TD, and Walker AW (2013). Intestinal colonization resistance. Immunology 138, 1–11. [DOI] [PMC free article] [PubMed] [Google Scholar]
- Louis P, and Flint HJ (2009). Diversity, metabolism and microbial ecology of butyrate-producing bacteria from the human large intestine. FEMS Microbiol. Lett. 294, 1–8. [DOI] [PubMed] [Google Scholar]
- Magnúsdóttir S, Heinken A, Kutt L, Ravcheev DA, Bauer E, Noronha A, Greenhalgh K, Jäger C, Baginska J, Wilmes P, et al. (2017). Generation of genome-scale metabolic reconstructions for 773 members of the human gut microbiota. Nat. Biotechnol. 35, 81–89. [DOI] [PubMed] [Google Scholar]
- Mead GC (1971). The amino acid-fermenting clostridia. J. Gen. Microbiol. 67, 47–56. [DOI] [PubMed] [Google Scholar]
- Momeni B, Xie L, and Shou W (2017). Lotka-Volterra pairwise modeling fails to capture diverse pairwise microbial interactions. Elife 6. [DOI] [PMC free article] [PubMed] [Google Scholar]
- Muir M, Williams L, and Ferenci T (1985). Influence of transport energization on the growth yield of Escherichia coli. J. Bacteriol. 163, 1237–1242. [DOI] [PMC free article] [PubMed] [Google Scholar]
- Nisman B (1954). The Stickland reaction. Bacteriol. Rev. 18, 16–42. [DOI] [PMC free article] [PubMed] [Google Scholar]
- Oberhardt MA, Palsson BØ, and Papin JA (2009). Applications of genome scale metabolic reconstructions. Mol. Syst. Biol. 5, 320. [DOI] [PMC free article] [PubMed] [Google Scholar]
- Pedregosa F, Varoquaux G, Gramfort A, Michel V, Thirion B, Grisel O, Blondel M, Prettenhofer P, Weiss R, Dubourg V, et al. (2011). Scikit-learn: Machine Learning in Python. J. Mach. Learn. Res. 12, 2825–2830. [Google Scholar]
- Ponomarova O, Gabrielli N, Sévin DC, Mülleder M, Zirngibl K, Bulyha K, Andrejev S, Kafkia E, Typas A, Sauer U, et al. (2017). Yeast Creates a Niche for Symbiotic Lactic Acid Bacteria through Nitrogen Overflow. Cell Syst 5, 345–357.e6. [DOI] [PMC free article] [PubMed] [Google Scholar]
- Rakoff-Nahoum S, Coyne MJ, and Comstock LE (2014). An ecological network of polysaccharide utilization among human intestinal symbionts. Curr. Biol. 24, 40–49. [DOI] [PMC free article] [PubMed] [Google Scholar]
- Reed JL, Patel TR, Chen KH, Joyce AR, Applebee MK, Herring CD, Bui OT, Knight EM, Fong SS, and Palsson BO (2006). Systems approach to refining genome annotation. Proc. Natl. Acad. Sci. U. S. A. 103, 17480–17484. [DOI] [PMC free article] [PubMed] [Google Scholar]
- Reichardt N, Duncan SH, Young P, Belenguer A, McWilliam Leitch C, Scott KP, Flint HJ, and Louis P (2014). Phylogenetic distribution of three pathways for propionate production within the human gut microbiota. ISME J. 8, 1323–1335. [DOI] [PMC free article] [PubMed] [Google Scholar]
- Royston JP (1982). Algorithm AS 181: The W Test for Normality. J. R. Stat. Soc. Ser. C Appl. Stat. 31, 176–180. [Google Scholar]
- Sakamoto M, and Benno Y (2006). Reclassification of Bacteroides distasonis, Bacteroides goldsteinii and Bacteroides merdae as Parabacteroides distasonis gen. nov., comb. nov., Parabacteroides goldsteinii comb. nov. and Parabacteroides merdae comb. nov. Int. J. Syst. Evol. Microbiol. 56, 1599–1605. [DOI] [PubMed] [Google Scholar]
- Sarma-Rupavtarm RB, Ge Z, Schauer DB, Fox JG, and Polz MF (2004). Spatial distribution and stability of the eight microbial species of the altered schaedler flora in the mouse gastrointestinal tract. Appl. Environ. Microbiol. 70, 2791–2800. [DOI] [PMC free article] [PubMed] [Google Scholar]
- Schwan C, Stecher B, Tzivelekidis T, van Ham M, Rohde M, Hardt W-D, Wehland J, and Aktories K (2009). Clostridium difficile toxin CDT induces formation of microtubule-based protrusions and increases adherence of bacteria. PLoS Pathog. 5, e1000626. [DOI] [PMC free article] [PubMed] [Google Scholar]
- Sezonov G, Joseleau-Petit D, and D’Ari R (2007). Escherichia coli physiology in Luria-Bertani broth. J. Bacteriol. 189, 8746–8749. [DOI] [PMC free article] [PubMed] [Google Scholar]
- Shelef LA (1994). Antimicrobial effects of lactates: a review. J. Food Prot. 57, 445–450. [DOI] [PubMed] [Google Scholar]
- Shin JH, Park SH, Oh YH, Choi JW, Lee MH, Cho JS, Jeong KJ, Joo JC, Yu J, Park SJ, et al. (2016). Metabolic engineering of Corynebacterium glutamicum for enhanced production of 5-aminovaleric acid. Microb. Cell Fact 15, 174. [DOI] [PMC free article] [PubMed] [Google Scholar]
- Sievers F, Wilm A, Dineen D, Gibson TJ, Karplus K, Li W, Lopez R, McWilliam H, Remmert M, Söding J, et al. (2011). Fast, scalable generation of high-quality protein multiple sequence alignments using Clustal Omega. Mol. Syst. Biol. 7, 539. [DOI] [PMC free article] [PubMed] [Google Scholar]
- Singer SM, and Nash TE (2000). The role of normal flora in Giardia lamblia infections in mice. J. Infect. Dis. 181, 1510–1512. [DOI] [PubMed] [Google Scholar]
- Song Y, Liu C, Lee J, Bolanos M, Vaisanen M-L, and Finegold SM (2005). “Bacteroides goldsteinii sp. nov.” isolated from clinical specimens of human intestinal origin. J. Clin. Microbiol. 43, 4522–4527. [DOI] [PMC free article] [PubMed] [Google Scholar]
- Stecher B, and Hardt W-D (2008). The role of microbiota in infectious disease. Trends Microbiol. 16, 107–114. [DOI] [PubMed] [Google Scholar]
- Tramontano M, Andrejev S, Pruteanu M, Klünemann M, Kuhn M, Galardini M, Jouhten P, Zelezniak A, Zeller G, Bork P, et al. (2018). Nutritional preferences of human gut bacteria reveal their metabolic idiosyncrasies. Nat Microbiol 3, 514–522. [DOI] [PubMed] [Google Scholar]
- Turnbaugh PJ, Ley RE, Hamady M, Fraser-Liggett CM, Knight R, and Gordon JI (2007). The human microbiome project. Nature 449, 804–810. [DOI] [PMC free article] [PubMed] [Google Scholar]
- Veselkov KA, Lindon JC, Ebbels TMD, Crockford D, Volynkin VV, Holmes E, Davies DB, and Nicholson JK (2009). Recursive Segment-Wise Peak Alignment of Biological 1H NMR Spectra for Improved Metabolic Biomarker Recovery. Anal. Chem. 81, 56–66. [DOI] [PubMed] [Google Scholar]
- Vos P, Garrity G, Jones D, Krieg NR, Ludwig W, Rainey FA, Schleifer K-H, and Whitman WB (2011). Bergey’s Manual of Systematic Bacteriology: Volume 3: The Firmicutes (Springer Science & Business Media; ). [Google Scholar]
- Wannemuehler MJ, Overstreet A-M, Ward DV, and Phillips GJ (2014). Draft genome sequences of the altered schaedler flora, a defined bacterial community from gnotobiotic mice. Genome Announc. 2. [DOI] [PMC free article] [PubMed] [Google Scholar]
- Watanabe S, Tanimoto Y, Nishiwaki H, and Watanabe Y (2015). Identification and characterization of bifunctional proline racemase/hydroxyproline epimerase from archaea: discrimination of substrates and molecular evolution. PLoS One 10, e0120349. [DOI] [PMC free article] [PubMed] [Google Scholar]
- Wattam AR, Davis JJ, Assaf R, Boisvert S, Brettin T, Bun C, Conrad N, Dietrich EM, Disz T, Gabbard JL, et al. (2017). Improvements to PATRIC, the all-bacterial Bioinformatics Database and Analysis Resource Center. Nucleic Acids Res. 45, D535–D542. [DOI] [PMC free article] [PubMed] [Google Scholar]
- Weiss S, Van Treuren W, Lozupone C, Faust K, Friedman J, Deng Y, Xia LC, Xu ZZ, Ursell L, Alm EJ, et al. (2016). Correlation detection strategies in microbial data sets vary widely in sensitivity and precision. ISME J. 10, 1669–1681. [DOI] [PMC free article] [PubMed] [Google Scholar]
- Wilkins TD, Fulghum RS, and Wilkins JH (1974). Eubacteriurn plexicaudatum sp. nov., an Anaerobic Bacterium with a Subpolar Tuft of Flagella, Isolated from a Mouse Cecum. International Journal of Systematic Bacteriology 24, 408–411. [Google Scholar]
- Wymore Brand M, Wannemuehler MJ, Phillips GJ, Proctor A, Overstreet A-M, Jergens AE, Orcutt RP, and Fox JG (2015). The Altered Schaedler Flora: Continued Applications of a Defined Murine Microbial Community. ILAR J 56, 169–178. [DOI] [PMC free article] [PubMed] [Google Scholar]
- Xiao Y, Angulo MT, Friedman J, Waldor MK, Weiss ST, and Liu Y-Y (2017). Mapping the ecological networks of microbial communities. Nat. Commun. 8, 2042. [DOI] [PMC free article] [PubMed] [Google Scholar]
- Ye J, Coulouris G, Zaretskaya I, Cutcutache I, Rozen S, and Madden TL (2012). Primer-BLAST: a tool to design target-specific primers for polymerase chain reaction. BMC Bioinformatics 13, 134. [DOI] [PMC free article] [PubMed] [Google Scholar]
- Yonaha K, Suzuki K, and Toyama S (1985). 4-Aminobutyrate: 2-oxoglutarate aminotransferase of Streptomyces griseus: Purification and properties. Eur. J. Biochem. 146, 101–106. [DOI] [PubMed] [Google Scholar]
- Zomorrodi AR, and Maranas CD (2012). OptCom: a multi-level optimization framework for the metabolic modeling and analysis of microbial communities. PLoS Comput. Biol. 8, e1002363. [DOI] [PMC free article] [PubMed] [Google Scholar]
Associated Data
This section collects any data citations, data availability statements, or supplementary materials included in this article.