Fig. 5.
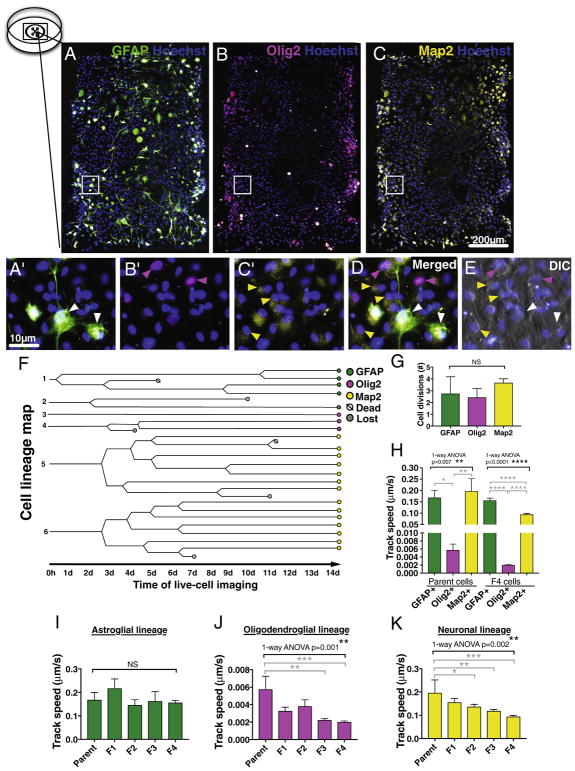
Single cell tracking can be used for mapping hNSC differentiation capacity and lineage preference in vitro. An example of hNSC immunostained against lineage specific markers A) GFAP, B) Olig2, and C) Map2 combined with nuclear stain Hoechst in a microwell after 14 day DIC time-lapse in in vitro differentiation conditions. Pictures are pseudo-colored, insets shown as higher magnification in A′–C′, and as merged layers in D. E) Composite image of the Hoechst and final DIC time-lapse timepoint in the triple-immunostained microwell shows good alignment of the layers. Arrow heads point to cells positive for astroglial GFAP+ cells (green), oligodendroglial lineage cells expressing nuclear Olig2 (pink) and neuronal Map2+ cells (yellow). F) An example of hNSC cell lineage map showing cell divisions and fate of each analyzed cell during 14 day DIC time-lapse in in vitro differentiation conditions. G) No significant difference was found in total number of cell divisions between each neuronal lineage during 14 day DIC time-lapse. 1-way ANOVA p = .36, n = 3–7 individual cells/lineage. H) In oligodendroglial nuclear Olig2+ lineage, both parent cells and the progeny exhibited significantly decreased migration speed when compared to those in astroglial GFAP+ or neuronal Map2+ lineage cells. Black bracket 1-way ANOVA **p = .007 or ****p ≤ .0001, grey brackets Tukey’s post hoc *p = .02, **p = .009, or ****p ≤ .0001. In parallel, when migration track speed was compared between the parent hNSC and the progeny in each lineage, I) no changes was detected in astroglial GFAP+ lineage cells, however the cells in both J) oligodendroglial Olig2+ lineage and K) neuronal Map2+ lineage cells were decelerating during 14 day DIC time-lapse in in vitro differentiation conditions. Black brackets 1-way ANOVA **p ≤ .002, grey brackets Dunnett’s post hoc test *p = .04, **p ≤ .005, ***p ≤ .0006, n = 3–4 individual cells/lineage, Mean ± error bars SEM. F indicates the progeny after each cell division. (For interpretation of the references to color in this figure legend, the reader is referred to the web version of this article.)

