

Abstract
Objective
Network analysis allows us to identify the most interconnected (i.e., central) symptoms, and multiple authors have suggested that these symptoms might be important treatment targets. This is because change in central symptoms (relative to others) should have greater impact on change in all other symptoms. It has been argued that networks derived from cross-sectional data may help identify such important symptoms. We tested this hypothesis in social anxiety disorder.
Method
We first estimated a state-of-the-art regularized partial correlation network based on participants with social anxiety disorder (N = 910) to determine which symptoms were more central. Next, we tested whether change in these central symptoms were indeed more related to overall symptom change in a separate dataset of participants with social anxiety disorder who underwent a variety of treatments (N = 244). We also tested whether relatively superficial item properties (infrequency of endorsement and variance of items) might account for any effects shown for central symptoms.
Results
Centrality indices successfully predicted how strongly changes in items correlated with change in the remainder of the items. Findings were limited to the measure used in the network and did not generalize to three other measures related to social anxiety severity. In contrast, infrequency of endorsement showed associations across all measures.
Conclusions
The transfer of recently published results from cross-sectional network analyses to treatment data is unlikely to be straightforward.
Keywords: network analysis, social anxiety disorder, research methods
Many studies of psychopathology seem to assume what might be called a common cause perspective. This approach involves thinking of clinical symptoms largely as passive measurements of an underlying mental disorder. Thus, a person has anxiety and avoidance about a variety of social situations as a consequence of having social anxiety disorder (SAD). From this viewpoint, the important causes and consequences are those related to the underlying latent variable of SAD itself, rather than to specific symptoms of SAD. Multiple authors have recently proposed that network perspectives offer an important alternative to a common cause perspective (Borsboom & Cramer, 2013; Borsboom et al., 2016; Cramer, Waldorp, van der Maas, & Borsboom, 2010a, 2010b; Fried, Borkulo, et al., 2016; McNally et al., 2015).
In a network conception, symptoms are understood as potentially causal agents in their own right (Borsboom, 2008; Borsboom, 2017). Instead of SAD being an entity to study, it could simply be a label for a set of symptoms (or other factors) that cause each other over time. A large number of authors have suggested that both the network conception and its related analyses could help researchers uncover central, important, or key symptoms that may provide viable treatment targets (Borsboom & Cramer, 2013; Borsboom, Cramer, Schmittmann, Epskamp, & Waldorp, 2011; Bringmann et al., 2016; Bringmann et al., 2013; Cramer et al., 2010a; Fried, Epskamp, Nesse, Tuerlinckx, & Borsboom, 2016; McNally et al., 2015; Robinaugh, LeBlanc, Vuletich, & McNally, 2014; Ruzzano, Borsboom, & Geurts, 2015; van de Leemput et al., 2014; Wichers, 2014; Wichers, Groot, & Psychosystems, 2016).
One can distinguish a network theory of psychopathology from network psychometrics—the statistical techniques used to estimate network models. These network analyses, like any other statistical technique, can be applied in a variety of ways to a variety of types of data. Many network analyses presented in the literature have focused on cross-sectional data (with some notable exceptions; see, e.g., Bringmann et al., 2013). Multiple authors have suggested that treatment of the symptoms identified as the most important in cross-sectional network analyses may result in the greatest overall treatment gains (McNally et al., 2015; Ruzzano et al., 2015). The implication is that cross-sectional network analyses might identify important treatment targets.
Figure 1 provides an example of a quantitative indicator of network importance, the centrality index strength. In this network, nodes (e.g., symptoms or items) are represented by circles, and the strength of the relationships between nodes is depicted by the thickness of the lines between the nodes that are called edges. In the type of graphs typically presented (e.g., in the literature cited above), the nodes are positioned based on the strength of their relationships with other nodes. In Figure 1, the nodes have varied properties, with Node 1 having the greatest strength in its edges with other nodes, where strength is defined as the sum of all absolute edge weights connected to a node. Strength is one of many centrality indices; we also investigate closeness and betweenness in this paper. As is hopefully clear from Panel B of Figure 1, centrality is not always easily determined by visually inspecting a graph: Although Node 1 has the greatest strength, it is not literally at the center of the figure. This is because centrality indices are inferences of high-dimensional network structures that cannot always be mapped in two dimensions in an ideal way and therefore may not correspond obviously to visual cues (e.g., such as how close to the center a node is).
Figure 1.
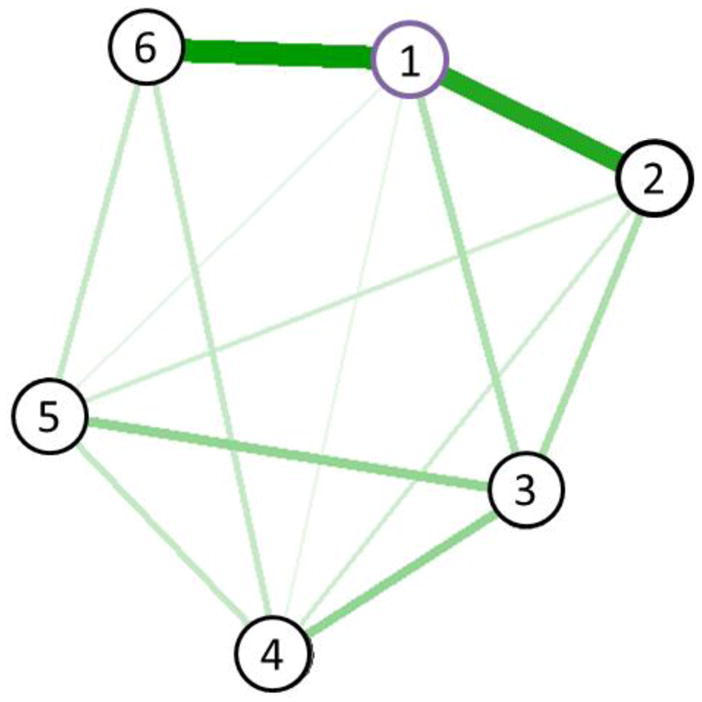
Example network demonstrating hypothetical relationships between nodes. The relationships between Nodes 1 have been arranged so that Node 1 has a higher value for strength (i.e., stronger correlations with Nodes 2–6 as indicated by thicker green lines; strength = .81) All other nodes have weaker strength in this example; Node 2 (strength = .54) is the next strongest node in the network.
The idea that centrality indices should identify symptoms that are important for treatment rests upon the inference that centrality indices, by identifying symptoms with strong quantitative relationships with others, also identify those symptoms with a strong causal role during treatment. That is, consider Node 1 in Panel B of Figure 1. It has a strength index of .85, whereas all other nodes in the figure have lower strength values (Node 2 has the second highest value, at .54). If the edges shown involve causal relationships directed from Node 1 to other nodes, then a change in Node 1, compared the same amount of change in the other nodes, would be expected to produce the strongest changes in the other nodes (all other factors being equal).
The intuitive appeal of the idea that high centrality involves high causal impact is clear, but changing Node 1 may do nothing if the high strength of its associated edges are entirely produced by other nodes causing Node 1. Similarly, an edge between Nodes 1 and 2 can result from failing to include important variables in the network that covary with both, in which case changing Node 1 may not have an impact on Node 2. More generally, the question of whether and how cross-sectional relationships in complex models are related to causality over time is a contentious one. Among the authors of the current manuscript, for example, there are a wide variety of viewpoints on this issue. Some of us view models based on cross-sectional data as a first step, useful for initial testing of theories that may or may not generalize to other types of data. All of us agree at least on the idea that a cross-sectional relationship between two variables implies some shared causal path that involves those two variables (even if the shared path is that a third variable causes both). At the same time, some of us find it implausible that there will be any systematic correspondence between cross-sectional data and either experimental or longitudinal data, and point to such findings of those of Maxwell and Cole to support this pessimism (Cole & Maxwell, 2003; Gollob & Reichardt, 1987; Maxwell & Cole, 2007; Maxwell, Cole, & Mitchell, 2011).
For central symptoms to be reliably important for treatment, centrality must have a high tendency to signal cause and effect in some form: A symptom is key to treatment if changing that symptom causes an important effect on other symptoms. This situation raises an empirical question: What relation is there, if any, between central symptoms identified in a cross-sectional network and change in other symptoms across treatment? The current paper aims to answer this question in the context of SAD treatment.
Looking at the prior literature on the topic, there are two especially relevant papers that came to opposite conclusions. One study, focusing on depression symptoms, examined whether centrality (measured by strength) estimated from a cross-sectional network predicted strength in individual person-level networks across time (de Vos et al., 2017). These authors found no evidence that cross-sectional centrality indices clearly signal how much nodes predict other nodes over time. However, the sample was relatively small for a network analysis (N = 104), and no information was provided regarding the stability of the centrality estimates.
In a second study, Robinaugh and colleagues (Robinaugh, Millner, & McNally, 2016) demonstrated that, in a group of older adults observed naturalistically, symptoms identified as more central to the network at a single time point appeared more clearly connected to change in other symptoms over time. That is, Robinaugh and colleagues computed how much change in an item correlated with change in the remaining items, and then examined whether that item’s centrality was associated with that correlation. Returning to the example in Figure 1, when Node 1 in Panel B changes, how much it changes should be highly correlated with how much the other nodes change (due to its high strength in the network), if indeed the edges radiating from Node 1 are related to causal pathways.
The results from this naturalistic study could be extended to the context of treatment. If symptoms identified as more central in cross-sectional data are indeed more important in predicting change in other symptoms across treatment as well, then change in these symptoms should be strongly associated with change in the entire network. For example, take SAD as a set of clinical symptoms involving fear and avoidance of social situations. If fear of one type of social situation, such as talking with authority figures, were found to be more central in a cross-sectional network, change in fear of talking with authority figures across treatment should relate strongly to changes in fear and avoidance of other situations. That is, if centrality in a cross-sectional network corresponds to importance for treatment, then change in the more central symptoms—whether they were targeted or not—should be a particularly good predictor of change in the rest of the network. Further, changes in these more central symptoms might also show stronger relationships with changes in other symptom measures, demonstrating their potential causal importance not only within the network, but also outside of the modeled network, in a similar realm of symptoms (and thus potentially within the same conceptual network). To the best of our knowledge, such a test has not yet been published in the literature.
We thus investigated whether symptoms identified as more central to a cross-sectional network of social anxiety symptoms (from the Liebowitz Social Anxiety Scale: LSAS; Liebowitz, 1987) showed evidence of being important for change during treatment. We used one sample to obtain centrality indices and a second sample to examine change across treatment, approximating a clinician’s application of results from the literature; however, we also examined whether estimating the network based on the pre-treatment data made any difference. We examined change both within the LSAS network and outside of the modeled network (i.e., by focusing on other measures of social anxiety severity). We hypothesized that change in items with higher centrality (versus those with lower centrality) would prove to be stronger predictors of change both within the LSAS network and in additional measures of social anxiety severity. We also expected the strongest relationships to be found within the LSAS network (due, e.g., to the common finding of stronger correlations within a measure than across measures). Finally, we tested whether item properties (i.e., infrequency of endorsement, item variance) with no obvious causal properties might account for any findings related to centrality. These latter tests are important because centrality indices can be affected by item properties such as rates of endorsement (Terluin, de Boer, & de Vet, 2016). Because we were concerned about the ability to predict decreases in symptoms across treatment, we were most concerned with restriction of range (i.e., variance) and floor effects (i.e., infrequency of endorsement). That is, an item, even if it measures an important causal factor, will have difficulty associating with reductions across treatment if that item lacks sufficient range or lacks sufficient numbers of participants who endorse it prior to treatment. We will refer to variance and infrequency of endorsement collectively as relatively superficial item properties; we mean by this phrase not that they are unimportant, but that these are properties that are relatively easy to manipulate (e.g., by changing the response scale) without changing the property we believe is being measured.
Method
Participants
Participants with generalized social anxiety disorder were pooled from several archival data. All participants provided informed consent for their data to be collected as part of a research project approved by the appropriate Institutional Review Board. Data sets were examined as two samples. The first sample (Sample A) was used to estimate the cross-sectional network, whereas in the second (Sample B), we examined change across treatment. The two samples did not differ in regard to age or gender (ps > .138), but did differ by of ethnicity in that Asian Americans were more well-represented in the treatment sample, χ2(1, n = 605) = 126.08, p < .001. Our intent in using the two samples was to simulate what would happen if an existing cross-sectional network analysis were used as a guide in a new treatment sample; as such, some differences between the samples are expected. However, we also examined in follow-up tests whether conclusions were different if centrality indices were drawn from the treatment sample instead.
Network analysis sample (Sample A)
A total of 910 participants diagnosed with DSM-IV (American Psychiatric Association, 1994) generalized social anxiety disorder (GSAD) via structured clinical interview were included in Sample A. These data were drawn from nine separate datasets that had been collected as part of several studies conducted at metropolitan and urban research centers. Overall characteristics of the sample, including demographics, are displayed in Table 1 (full details of each subsample are available in the supplemental material). All participants completed the clinician-administered version of the LSAS. In all cases, only pre-treatment data were used, although most participants were in studies including treatment.
Table 1.
Frequencies and Descriptive Statistics from Sample A and Sample B
| Sample A (N = 910) |
Missing n (%) |
Sample B (N = 244) |
Missing n (%) |
|
|---|---|---|---|---|
| Age (years), M (SD) | 33.96 (12.10) | 2 (0.22) | 33.13 (8.33) | 4 (1.64) |
| Female, n (%) | 398 (43.74) | 33 (3.63) | 126 (51.64) | 3 (1.23) |
| Race and Ethnicity, n (%)* | 303 (33.30) | 3 (1.23) | ||
| Caucasian | 363 (39.89) | 116 (47.54) | ||
| African-American | 124 (13.63) | 2 (0.82) | ||
| Asian or Pacific Islander | 36 (3.96) | 87 (35.66) | ||
| American Indian or Alaska Native | 7 (0.77) | 1 (0.41) | ||
| Multiracial** | 9 (0.99) | 14 (5.74) | ||
| Unlisted racial minority | 15 (1.65) | 0 (0.00) | ||
| Hispanic | 53 (5.82) | 21 (8.61) | ||
| LSAS total, M (SD)*** | 78.31 (38.82) | 38 (4.18) | 88.04 (17.82) | 17 (7.00) |
| LSAS total, post-treatment, M (SD) | 51.71 (21.50) | 81 (33.20) |
Note. LSAS = Leibowitz Social Anxiety Scale.
For 221 (24.30%) of the participants in Sample A and for 130 (53.30%) of the participants in Sample B, Hispanic ethnicity was assessed as an option when reporting race, rather than assessed separately as part of ethnicity. Thus, we are missing additional racial information on participants who chose to select the Hispanic option when reporting their race. The frequency for Hispanic represents to the frequency of participants who endorsed Hispanic ethnicity plus a racial category in addition to the frequency of participants who endorsed Hispanic ethnicity when it was assessed as a racial category. The frequency for Missing represents the frequency of participants who were missing all racial or ethnic data. We did not include the frequency of participants who reported Hispanic ethnicity but who were missing additional racial information in this estimate. Percentages do not add precisely to 100 due to rounding.
Multiracial was provided as an option for only 125 (13.70%) of the participants in Sample A.
The LSAS total score represents the pre-treatment score for Sample B.
Treatment sample (Sample B)
An additional, non-overlapping sample of 244 participants was included in analyses focused on treatment; a total of 155 participants provided at least some data at post-treatment. Participants were recruited for three treatment studies that included cognitive behavioral therapy, mindfulness-based stress reduction, aerobic exercise, and wait list conditions (see the supplemental material for full information). Participants were diagnosed with GSAD or SAD via a structured clinical interview, and the data were maintained in three separate datasets that were collected from a large, West-coast university located outside a metropolitan area. All participants completed a self-report version of the LSAS. Participant characteristics are provided in Table 2 (additional details are provided in the supplementary material).
Table 2.
Multiple Regression Results (Part rs) for Centrality Indices
| Predictor | Main Analyses (No Correction) | Main Analyses (Corrected) | Added Participants | ||||||||
|---|---|---|---|---|---|---|---|---|---|---|---|
|
| |||||||||||
| LSAS | SIAS-S | BFNE-S | SDS | LSAS | SIAS-S | BFNE-S | LSAS | SIAS-S | BFNE-S | SDS | |
|
|
|||||||||||
| Centrality Composite | .48** | .02 | .11 | .18 | .40* | .25 | −.16 | .44* | .01 | −.03 | .20 |
| Infrequency | −.50** | −.68** | −.65** | −.72*** | −.55** | −.54** | −.78*** | −.26 | −.57** | −.56** | −.55** |
| Variance (SD) | −.31* | −.14 | .24 | −.15 | −.09 | −.22 | −.02 | −.02 | −.18 | −.13 | −.16 |
Note. These regressions were run using the data that can be found in Table S1 in the supplementary material. Each column heading lists the dependent variable, which in each case is the correlation between change in a node and the change in the measure listed. In each regression, all of the predictors were included. Main Analyses = Initial analysis with Sample A centrality indices. Coefficient under the (No Correction) heading is before correction by removing nodes with excessive SDBetas; coefficient Under the (Corrected) heading (if any) is after correction. The SDS analysis did not require correction. Added Participants = Sample A with participants who did not have generalized social anxiety disorder included. LSAS = Liebowitz Social Anxiety Scale; SIAS-S = Social Interaction Anxiety Scale-Straightforward; BFNE-S = Brief Fear of Negative Evaluation-Straightforward; SDS = Sheehan Disability Scale; Centrality Composite = Combined strength and closeness.
p< .05,
p < .01,
p < .001
Measures
Liebowitz Social Anxiety Scale: Clinician-Administered Version (LSAS-CA; Liebowitz, 1987)
The LSAS-CA is a 48-item clinician-administered measure that assesses social fear and avoidance across 24 separate social performance and interaction situations. Clinicians instruct individuals to report their level of fear and avoidance of the given situation during the past week using a 4-point Likert-type scale. The fear scale ranges from 0 (None) to 3 (Severe) and the avoidance scale ranges from 0 (Never) to 3 (Usually). The LSAS-CA has demonstrated excellent internal consistency, as well as strong convergent validity with other clinician-administered and self-report measures of social anxiety and divergent validity with measures of depression (Heimberg et al., 1999; Heimberg, Mueller, Holt, Hope, & Liebowitz, 1992). The LSAS-CA was used in Datasets 1–9 (i.e., Sample A). The internal consistency for the items composing the total score was excellent (α = .98).
Liebowitz Social Anxiety Scale: Self-Report Version (LSAS-SR; Fresco et al., 2001)
The self-report version of the LSAS (LSAS-SR) uses the same situations and scales as the LSAS-CA. Instructions for the LSAS-SR are adapted from the LSAS-CA and are provided at the top of the measure for the participant to review as necessary. The LSAS-SR was used in Sample B. For one of the three treatment studies, as well as at follow-up time-points for the two other treatment studies, the LSAS-SR was delivered online. Previous studies have demonstrated that the LSAS-SR and its subscales have good internal consistency and the total score from the LSAS-SR is strongly correlated with total score from the LSAS-CA, r = .85, p < .05 (Baker, Heinrichs, Kim, & Hofmann, 2002; Fresco et al., 2001; Oakman, Van Ameringen, Mancini, & Farvolden, 2003). The internal consistencies for items composing the total score pre- and post-treatment were excellent (α = .91, .95, respectively).
Social Interaction Anxiety Scale – Straightforward items (SIAS-S; Rodebaugh, Woods, & Heimberg, 2007)
The SIAS-S is modified from the original SIAS that was developed by Mattick and Clarke (1998) and includes the 17 straightforward items from the original 20-item scale. The items assess social anxiety in various social interaction situations. The SIAS-S uses a 5-point Likert-type scale ranging from 0 (Not at all) to 4 (Extremely) to assess level of social anxiety in a given situation. The SIAS-S has demonstrated a unifactorial structure with high internal consistency (Rodebaugh et al., 2007; Rodebaugh, Woods, Heimberg, Liebowitz, & Schneier, 2006). Furthermore, it has displayed strong construct validity in both undergraduate and clinical samples, as well as strong convergent validity with other measures of social anxiety and divergent validity with other psychological or personality constructs (Rodebaugh et al., 2007; Rodebaugh et al., 2011).
Brief Fear of Negative Evaluation Scale – Straightforward items (BFNE-S; Rodebaugh et al., 2004)
The BFNE-S is modified from the original 12-item BFNE that was developed by Leary (1983) and includes only the 8 straightforwardly-worded items. The BFNE-S uses a 5-point Likert-type scale ranging from 1 (Not at all characteristic of me) to 5 (Extremely characteristic of me). Psychometric studies have suggested that the eight straightforward items of the scale, as compared to the four reverse-scored items or the entire BFNE, demonstrate the strongest reliability and validity (Carleton, Collimore, McCabe, & Antony, 2011; Rodebaugh et al., 2011; Rodebaugh et al., 2004; Weeks et al., 2005).
Sheehan Disability Scale (SDS; Sheehan, 1983)
The SDS is a 3-item measure that assesses the degree to which an individual’s symptoms affect their work, social, and home life. The items are measured using a 10-point visual analog scale that ranges from 0 (Not at all) to 10 (Extremely), and total scores range from 0, indicating no impairment, to 30, indicating significant impairment. The SDS has demonstrated a unifactorial structure with acceptable internal consistency (Leon, Shear, Portera, & Klerman, 1992). It has been demonstrated to discriminate between those who are experiencing psychiatric symptoms and those who are symptom free, suggesting good construct validity (Leon et la., 1997; Leon et al., 1992; Olfson et al., 1997). Among people with SAD, the SDS has also shown signs of good validity and modest internal consistency, although longer scales measuring disability perhaps unsurprisingly showed stronger properties (Hambrick, Turk, Heimberg, Schneier, & Liebowitz, 2004).
Data Analytic Procedure
A priori tests versus revised analyses
We originally examined all 48 of the LSAS items (24 fear and avoidance situations) in a network. However, as pointed out during the review process, the covariance matrix of the symptoms was not positive definite,1 presumably due to high collinearity between anxiety and avoidance ratings of each situation. Thus, we investigated the anxiety and avoidance items separately. We examined three commonly-used centrality measures: Betweenness, centrality, and strength. We determined that centrality indices were moderately to highly correlated across the two items sets (betweenness: rs = .38–.43, ps = .006–.06; closeness: rs = .43–.46, ps = .025–.037; strength: rs = .85–.89, ps < .001; note that strength was the most stable index in each set of items). We therefore decided to add anxiety and avoidance items together for each situation. In addition to adding together anxiety and avoidance items across situations, we observed that two situations were not only very similar in concept, but also so highly correlated as to suggest that they were measuring the same construct: talking to people you don’t know very well and meeting strangers (fear: r = .61; avoidance: r = .64); and performing in front of an audience and giving a report to a group (both fear and avoidance rs = .77). Treating these situations as separate could produce nonsensical estimates in the same manner that would occur if one ran a regression with two highly-correlated measures of anxiety included as separate predictors. We therefore additionally summed the two highly correlated situation pairs to generate 22 nodes for analysis. Finally, we rescaled the two nodes drawn from 4 items by using the cut function in R (R Core Team, 2017) to reproduce the same 0–6 scale of all other nodes.
The a priori analyses we originally conducted were predicated on the assumption that there would be a set of items that either clearly had higher centrality than all others, or were at least more stable in their high centrality than others. In the revised analyses, this was no longer the case. Accordingly, we adopted the method used by Robinaugh et al. (2016). Although this is not the method we had selected a priori, it is suitable for the situation in the revised data, in which the nodes all have fairly stable rankings in terms of centrality and no small set of nodes is clearly higher in centrality than the others.
Revised analyses
Here we focus on the overall plan for the analyses (more detailed information on each aspect of the data analytic procedure is available in the supplemental materials). We first created five multiple imputation data sets Sample A to handle sporadic missing data, using random forest imputation. A total of 11% of participants with GSAD in Sample A had at least some missing data. Because there is no best standard for how to deal with multiply imputed data in network analyses, we focused on consistent findings across all five data sets. Following the compositing described above (resulting in 22 nodes), network estimation and network stability tests were conducted in accordance with current standards using R packages qgraph (version 1.4.1; Epskamp, Cramer, Waldorp, Schmittmann, & Borsboom, 2012) and bootnet (version 0.3; Epskamp, Borsboom, & Fried, 2017), respectively. See Supplementary Materials for information on all R packages utilized. An undirected regularized partial correlation network was estimated, resulting in edges that can be interpreted as partial correlation coefficients (an association between two items controlling for all other associations among items). Regularization ensures that the estimated network structure balances sensitivity with specificity, and leads to a sparse network structure that avoids obtaining spurious edges (Epskamp & Fried, in press). We determined which centrality indices to consider further based on their correlation stability coefficient estimated in bootnet. Indices were determined to be stable if at least 25% of the cases could be removed and the order of nodes maintained a correlation of 0.7 (with 95% probability) with the original sample (see Epskamp, Borsboom, & Fried, 2017 for a description of the correlation stability coefficient). To ensure that results were not due to mere item properties that can bias centrality indices, we also examined frequency of endorsement (i.e., floor effects) and standard deviation (i.e., effects for the range of the item) (cf. Terluin et al., 2016). Infrequency was defined as the number of participants who scored 0 on that node (with nodes values ranging from 0 to 6); notably, a score of 0 would indicate the participant endorsed a 0 on all of the items that ultimately comprised that node. The standard deviation was simply the SD for that node.
Following the method used by Robinaugh and colleagues (2016) we then examined centrality indices across nodes. The outcomes of interest were the degree to which change in a given node correlated with change, from Sample B, in (a) the remainder of the LSAS items, (b) the SIAS-S items, (c) the BFNE-S items, and (d) the SDS items. For (a), the remainder of the LSAS items were defined as the total of the items minus the investigated node. Again, the notion is that, for each outcome, higher centrality should be associated with a higher correlation between change in that node and change in the outcome. Note that because some participants dropped out of treatment or did not provide the given measure, we obtained these correlations pairwise; each correlation was estimated using between 133 and 155 cases. To determine whether any correlations might be better explained by relatively superficial item properties, we also conducted multiple regressions in which centrality and item properties were included as predictors. When conducting multiple regressions, we examined the correlations between the centrality indices and composited them if correlations were high (e.g., > .50) because the intent was to assess the usefulness of centrality indices rather than pit them against each other.
We also examined the SDBeta statistic, which identifies items that are overly influential, such that their removal would have a strong impact on the regression coefficient. We considered this test essential given the small sample size for these analyses (i.e., 22 nodes). We report below when we removed nodes that had an SDBeta value in excess of 1 or −1 (Neter, Wasserman, & Kutner, 1989).
Results
Network Estimation
We first estimated the overall network structure for each of the five imputations of Sample A. Figure 2 displays the results for the first imputed dataset; the (very similar) figures for the other imputed datasets are presented in supplementary material (Figures S1 and S2). The results presented below were across all of the imputed datasets, and not simply the first one. We examined the centrality stability indices for strength, closeness, and betweenness to determine which metrics were appropriate for further analysis. Using the cut-off of 0.25 suggested by simulation studies (Epskamp, Borsboom, & Fried, 2016), we determined that strength (CS[cor=0.7] = .59–.67) and betweenness (CS[cor=0.7] = .28) were sufficiently stable across imputations to justify use in subsequent analyses. Strength refers to how strongly a node relates to other nodes, whereas betweenness refers to how important a node is in paths between other nodes (cf. Epskamp et al. 2017). Another centrality index, closeness, was less stable (CS[cor=0.7] = .21 – .28) and we refrain from interpreting it in the primary analyses.
Figure 2.

Network model of LSAS items. The figure displays the network for the first of the five imputed data sets; network models of all five imputations can be found in the supplement. The blue (darker gray) solid lines represent positive relations, whereas the red (lighter gray and dashed) lines represent negative relations between items. Nodes of items numbered 1 through 24 refer to fear or anxiety of a given situation and avoidance of the same situation. Note that item pairs 6 and 20 and 11 and 12 have been combined into a single node due to high correlations between these items pairs. The situations represented are, in brief (i.e., not verbatim): 1 = Public telephone use, 2 = Small groups, 3 = Eating in public, 4 = Drinking in public, 5 = Talking to authority figures, 6 = Acting, performing, giving a talk, 7 = Going to a party, 8 = Working while observed, 9 = Writing while observed, 10 = Calling a relatively unknown person, 11 = Talking to a relatively unknown person, 12 = Meeting strangers, 13 = Urinating in a public restroom, 14 = Entering a room where others are seated, 15 = Center of attention, 16 = Commenting during a meeting, 17 = Taking test, 18 = Expressing disagreement to relatively unknown person, 19 = Looking relatively unknown person in the eyes, 20 = Report to group, 21 = Asking someone on a date, 22 = Returning goods, 23 = Giving party, 24 = Resisting salesperson.
Treatment Response Prediction
Within-LSAS-network prediction
In the within-network prediction, the test was whether centrality indices predicted the correlation between change in a node and change in the rest of the network. We will call the dependent variable for this set of analyses node-LSAS change correlation. Notably, these analyses were conducted with nodes as the unit of analysis and not people: Values for the nodes were obtained from Sample A (for centrality and item properties) and Sample B (for correlations). Because the data analyzed were by node, the entire dataset is represented in Table S1 in the supplementary material.
As hypothesized, both strength (r = .48, p = .026) and betweenness (r = .53, p = .011) were related to the node-LSAS change correlation. This finding indicates that the centrality indices successfully identified nodes for which their change was more strongly associated with change in the rest of the network. Because strength and betweenness were strongly correlated (r = .66, p = .001), they were z-scored and composited for remaining analyses (and referred to as the centrality composite). We did this because entering them as individual predictors would lead to a focus on their unique properties, whereas we were interested in centrality overall.
Infrequency of item endorsement (r = −.61, p = .003) was also strongly associated (whereas node SD was not: r = .04, p = .874) with the node-LSAS change correlation. Further, strength and betweenness showed a pattern of correlations with infrequency and variance that might indicate that this association partially explained their relationship to change (e.g., the centrality composite’s correlation with infrequency was −.30, p = .179; with SD, r = .48, p = .025). To determine the relative strength of prediction for these associations, the three node properties (centrality composite, infrequency, and SD) were entered in a regression equation predicting the node-LSAS change correlation. The coefficients for these analyses are presented in Table 2. All three predictors were statistically significant. Notably, the result for SD showed the opposite sign of what was expected (suggesting statistical suppression) and did not survive correction for nodes with excessive SDBeta values (see Table 2). Thus, both the centrality composite and infrequency identified nodes with a stronger relationship with change in other items. When items with higher centrality changed, other LSAS items were more likely to change in comparison to when lower centrality items changed. In addition, when items that were infrequently endorsed changed, other LSAS items were less likely to change in comparison to when items that were more frequently endorsed changed.
Outside LSAS-network prediction of social anxiety severity
We next repeated the analyses conducted above for three measures not included in the LSAS network. More specifically, the question was how strongly centrality (from Sample A) predicted how change in a given node correlated with change in the social anxiety severity measure in question (from Sample B). Examining zero-order correlations, betweenness displayed at best marginal relationships (SIAS-S: r = .18, p = .451; BFNE-S: r = .19, p = .388, SDS: r = .38, p = .079), and neither strength nor the centrality composite showed any sign of predicting (ps > .10). Infrequency strongly predicted across measures (SIAS-S: r = −.68, p = .001; BFNE-S: r = −.73, p < .001, SDS: r = −.78, p < .001). In contrast, SD showed no relationship (ps > .23). Multiple regressions are shown in Table 2 and are consistent with zero-order correlations: Only infrequency predicted strength of association in the additional social anxiety severity measures.2
Follow-up Tests
Rationale
Although there was some support for the hypothesis that highly central nodes predict more change in other nodes, infrequency of endorsement was a much more robust predictor. Three explanations for this pattern presented themselves (that are not mutually exclusive). First, the Sample A network indices may have been influenced by superficial item properties. Second, the Sample A network might not be consistent with the network structure for Sample B. Third, the fact that participants all had GSAD might produce a distorted network structure because participants were selected based in part on properties of the network (i.e., people with GSAD typically have higher LSAS scores than those without). We attempted to address each concern below to determine whether addressing these concerns (a) reduced effects for infrequency or (b) increased effects for centrality. The interested reader can re-run these analyses using the data provided in Table S1.
Ising network
We addressed the first problem by reducing the probability that infrequency was having an effect on centrality indices. We dichotomized all nodes in Sample A using a median split of each node such that responses below the median were coded as 0. In cases where the median was 0, responses of 0 and 1 were coded as 0 instead. This procedure minimizes the effect of variance and infrequency (as well as all other item properties) on network estimation, because most had equivalent numbers of participants who endorsed 0. We then conducted the same analyses described above using the centrality indices from an Ising network. We investigated strength and closeness because these indices had interpretable levels of stability in 4 of 5 imputed datasets; none of the indices from the Ising network had acceptable stability across all 5 imputed datasets. Because the two indices were highly correlated (r = .81, p < .001) they were composited and combined for analysis. Substantive results for this centrality composite were identical to those reported above; it predicted regarding the LSAS (part r = .45, p = .012, corrected for SDBeta) but not other measures (ps > .30); infrequency predicted for all (ps < .008). Dichotomizing items and thereby addressing skewed distributions in the data did not consistently change the pattern of results, making it unlikely that skew is the main reason for the results obtained.
Correspondence of centrality indices between cross-sectional and treatment data
To address the second problem, that the results from Sample A might vary widely from the results Sample B (i.e., the treatment sample itself), we repeated the procedure we used for Sample A in Sample B. Of the centrality indices, none showed acceptable stability in these data; however, strength was the most stable metric (CS[cor=0.7] = .21). Strength from the pre-treatment and cross-sectional data showed reasonably good correspondence across datasets (r = .61, p = .003; two-way random ICC for the single measure = .57, p = .002, 95% CI: .21 – .80). The entire correlation matrix of the centrality indices is provided in Table S2. We then repeated the multiple regressions, this time using strength, infrequency, and variance from Sample B. There were no significant predictors for the LSAS (ps > .06 after correction for SDBetas). For the other measures, strength did not predict (ps > .21), whereas infrequency predicted for the SIAS-S and BFNE-S (ps < .03) but not the SDS (p = .094; all ps correcting for SDBetas). Relying on Sample B produced more mixed results that showed no increased effects for centrality indices.
Addition of participants without GSAD
We added participants to Sample A who were diagnosed using the same procedures as the GSAD participants, but who were either recruited as normal control participants or who did not meet for GSAD diagnosis despite expectations from screening that they would. A total of 197 participants were added to Sample A. We then re-ran the original procedures and extracted centrality indices from this larger dataset. Strength (CS[cor=0.7] = .59–.67) and betweenness (CS[cor=0.7] = .28–.36) showed acceptable stability in all imputations, whereas closeness did not (CS[cor=0.7] = .21–.28). The correlation table for all three centrality indices from the larger versus smaller cross-sectional dataset is provided in Table S2; strength and betweenness were strongly correlated (r = .78, p < .001) and were therefore standardized and combined. This centrality composite, infrequency, and SD from the expanded sample were used as competing predictors in a multiple regression. The results from these analyses are presented in Table 2 because it presented the only instance in which infrequency demonstrated reduced effects. For the LSAS, only centrality predicted strength of association. In contrast, for the SIAS-S, BFNE-S, and SDS, only infrequency predicted strength of association and the other predictors did not.
From the above results, it was unclear whether the apparent improvement in the prediction by centrality indices regarding the LSAS was due to improved estimation of centrality indices or reduced utility of infrequency estimates from the expanded version of Sample A. We therefore also ran this regression using the original Sample A infrequency and SD estimates. In this analysis, infrequency did predict regarding the LSAS at about the same level as centrality (infrequency: part r = −.46, p = .006; centrality: part r = .44, p = .009 after correction for SDBeta), but the evidence for centrality indices remained more convincing than in the primary analyses. There was thus some evidence that centrality performed more in keeping with hypothesis when the sample was not restricted to participants who are expected to score high on the LSAS, but this improvement was not seen for measures other than the LSAS, where infrequency continued to show the strongest associations. Infrequency, in contrast, showed stronger associations when estimated based on GSAD participants alone.
Nodes of particular interest
The nodes with highest centrality, based on the z-scored and combined centrality composite from the expanded Sample A analysis were: (a) the combined Situations 11 and 12 (talking with unfamiliar people), (b) Situation 15 (center of attention), (c) Situation 7 (going to a party). The least central were (a) Situation 17 (test-taking), (b) Situation 21 (asking someone on a date) and (c) Situation 1 (telephoning). The nodes with the lowest infrequency from the primary analyses were: (a) the combined Situations 6 and 20 (public speaking or performance), (b) Situation 16 (commenting during a meeting), (c) Situation 15 (center of attention). The nodes with the highest infreqency were: (a) Situation 13 (urinating in restroom), (b) Situation 4 (drinking in public), and (c) Situation 9 (writing while observed). Node values on specific centrality indices, as well as the different versions of each variable, can be obtained through examination of the data in Table S1 in the Supplementary Material.
Discussion
We sought to determine whether central symptoms identified via network analysis of cross-sectional data would predict the correlation between change in a given node and change in other symptoms across treatment in a second dataset. We hypothesized that items identified as highly central in the LSAS would have a stronger ability to predict change of symptoms across treatment, in accordance with other suggestions in the literature (McNally et al., 2015; Ruzzano et al., 2015). We found that centrality did predict which nodes were more strongly associated with change above and beyond other predictors. However, this prediction was restricted entirely to the LSAS itself. LSAS nodes with higher centrality indices showed no promise as useful indicators of change in other measures of social anxiety severity. In contrast, how frequently items were endorsed showed a more consistent ability to predict node importance, both within the LSAS and in extension to other measures. Nodes that were more frequently endorsed were much more likely to show signs of being influential across treatment.
What do our results suggest about the assertion that centrality from a cross-sectional network is a good guide to determining which symptoms are important to focus on in treatment? Our findings clearly run counter to the pessimistic view that centrality indices from cross-sectional data would tell us nothing about associations over time. An optimistic reading of our results might conclude that centrality indices, and particularly strength (a more stable index), might provide some information about which symptoms are more important for treatment. Higher centrality in our data was indeed associated with a stronger association with change across the entire LSAS network: Targeting the highly central symptoms might therefore promote generalization of treatment gains across the LSAS as a whole. Clinical scientists might therefore take our results as license to interpret existing centrality findings as indicating good targets for treatment. However, there are at least three caveats to this conclusion.
Caveat One: Select Items with Care
First, our results imply that simply analyzing the items of a given measure may not produce such promising results unless care is taken in determining in selecting nodes for the network analyses. Our initial results obtained by simply analyzing all of the items (see Supplemental Material) seemed to indicate that centrality indices were conflated with infrequency of endorsement, whereas our revised analyses did not indicate this was the case. Avoiding very high correlations among nodes appeared to ameliorate the effects of infrequency of endorsement on the network. Perhaps importantly, the LSAS is a frequently-used measure that is widely regarded as having great clinical utility based on a strong evidence base for its validity in measuring symptoms of SAD (see Fresco et al., 2001 for a review). Unfortunately, analyzing the individual items of this arguably gold-standard measure proved inadvisable due to very high correlations among fear and avoidance nodes that represented the same situation. Deciding in what form to include items so as to avoid nonsensical results took considerable thought and care; this may serve as a warning to researchers who may be inclined to analyze the items of a measure without consideration of item properties and intercorrelations, a method that might seem to be endorsed by early demonstrations of network analysis focused on psychopathology (cf. Fried & Cramer, 2017).
To the extent that other researchers have followed these early examples, clinicians and researchers should take care in interpreting published findings regarding centrality indices. For example, during the review process for this manuscript we became aware of two network analyses focusing on the LSAS (Heeren, Jones, & McNally, 2018; Heeren & McNally, 2018), one of which (Heeren & McNally) focused on the LSAS alone, as we did here. These researchers indeed followed the same procedure typically used in previous network analyses: All items were included in the network in their original form. We contacted the authors (Heeren & McNally), who confirmed that their data produce the same error message we received (i.e., a warning regarding a non-positive definite matrix) when the data are analyzed using the same method we used (A. Heeren, personal communication, June 7 and June 13, 2018).3 We expect that even in cases in which the statistical error does not arise, the conceptual problem of including multiple nodes that measure the same construct may be common. The clinical scientist who is inclined to interpret centrality indices optimistically as a result of our results should be aware that many researchers in the area have only recently begun to consider that it may not be optimal to include all items on a measure as separate nodes in analysis.
Caveat Two: The Importance of Item Properties
Second, our evidence indicated a medium-to-large effect for centrality, whereas infrequency generally showed larger effects. Some readers might object that there is no reason for the “whereas” in the previous sentence: It should be no surprise that floor effects are important. However, it may be a surprise to clinicians to find that our positive results for centrality indices come with the context that it would be even better to treat common symptoms (which, arguably, existing treatments tend to focus on already). Of course, our results indicate that it would be an even better idea to use both indices to select items: That is, clinicians could treat select symptoms on the basis of both centrality and frequency of endorsement. We are of two minds on this point; some of the current authors see no contradiction between centrality indices and floor effects having an influence on results. For some of the current authors, however, this situation is unsatisfying because it indicates that relatively superficial item properties may be more important, in some instances, than centrality indices derived from sophisticated analyses that researchers and clinicians hope will uncover causal processes. Of course, it remains possible that the highly endorsed items play an important causal role. It could be the case that fear of giving presentations has a unique causal role for SAD; we simply cannot separate any such causal role from the item properties given our data. We do believe, however, that our results can serve as a warning (that echoes those of other authors, e.g., Terluin et al., 2016) to researchers to examine the issue of item properties, such as endorsement rates, when conducting any statistical analysis, including network analysis.
In network analysis, the typical current practice is to examine sets of single item scores as if items themselves measure constructs directly. This practice maximizes the chances that results could be influenced by relatively superficial item properties. We have shown in this paper, however, that careful examination of items can help reduce this possibility. It may also be useful to re-examine the latent variable models that served as the spur to move in a different direction (cf. Fried & Cramer, 2017). We say this because latent variables provide a method to combine multiple items based on their inferred relationship with the underlying variable that is being measured. This property of latent variables cannot completely eliminate the influence of factors such as floor effects, but it can at least reduce that influence. Indeed, we arguably accomplished a similar goal in a less precise way here by combining items. A rapprochement between latent variable models and network analyses may be fruitful, as has been previously suggested (Fried & Cramer, 2017). Epskamp and colleagues have recently presented an approach that allows a combination of the two methods, although multiple challenges remain (Epskamp, Rhemtulla, & Borsboom, 2017). An alternative would be to develop measures that are free of floor or ceiling effects, but we have no optimism that this will be accomplished soon for the measurement of clinical problems.
Caveat Three: The Gates of Causality
There remains a third caveat for those who might take our results as indicating that cross-sectional networks will yield informative centrality indices. Centrality indices showed no ability to detect items that showed influence outside of the LSAS, whereas frequency of item endorsement did. This puts a reader inclined to an optimistic reading in an awkward position. Centrality seems to identify important LSAS items, but only within the wall, so to speak, of the LSAS itself. Accepting this result as evidence of the importance of centrality indices would require the reader to also accept that our results imply that importance stops at the gates of the LSAS. This conclusion seems awkward to us because the other measures assess constructs that should be close neighbors to the constructs assessed by the LSAS. For example, the LSAS includes items assessing social interaction anxiety: Why, then, should centrality not also identify items showing signs of greater influence on the SIAS-S, a unifactorial measure of social interaction anxiety? Although we have thought of answers for that question, none of the answers are particularly satisfying or explain how centrality indices can index important causal processes and still provide the current result. For example, centrality might identify which items are most heavily saturated with variance that is unique to the LSAS, such as some form of method variance that remained consistent across Sample A and Sample B. For example, both versions of the LSAS used include a specific instruction to focus on the past week; the other measures we examined do not.4 Whether due to the focus on the past week or for some other reason related to method variance unique to the LSAS, the result we obtained would be expected: The highly central items are important within the LSAS, but not outside of it (unless another measure shares that method component). The point is that it is difficult to rectify centrality as an important index of causality with an effect that ends at the gates of a specific measure. On the other hand, it may be possible to read these results optimistically, as an indication that networks should contain the entire set of variables involved in a causal network. From this point of view, the problem is that only the LSAS was included in the network.
Limitations and Future Directions
Our initial results were vulnerable to several concerns: (a) the network may have been affected by specific item properties (such as infrequency and variance); (b) the network may have varied meaningfully from the network that would have been estimated from the smaller pre-treatment dataset, such that the pre-treatment network would produce more useful estimates; and (c) the network may have been affected by the selection of GSAD participants. Our follow-up tests provided clarity: Only the addition of participants who did not have GSAD resulted in any sign of improved prediction for centrality indices, and even in this case infrequency remained a more robust predictor (at least outside of the LSAS network). Thus, none of these concerns appear to explain the effects observed.
We believe that the most important limitation of our work is that we did not select symptoms for specific intervention and test the resulting changes in a network when those symptoms are targeted (in comparison to when other symptoms are targeted). That scenario is clearly the desired goal of network analyses that many researchers have referred to. We focused on tests that were plausible and possible given available data; further, we tested a logical extension of the idea that centrality indices will identify key symptoms for treatment. Clearly, however, direct tests of randomly assigned interventions at the symptom level are sorely needed. One advantage of such direct tests is that they would provide the ability for true prospective tests of centrality indices. Here, we were limited to testing whether centrality was correlated with how change in nodes correlated with change in other nodes and measures. Although these analyses involved time, they do not represent fully prospective prediction, which would be preferable. Among other reasons, fully prospective prediction with random assignment to a meaningful control condition would allow one to rule out regression to the mean as a competing explanation.
Notably, our findings, even if replicated, do not rule out the possibility that there might be some instances in which cross-sectional networks offer important information about symptoms that are key to changing not only that network, but beyond. Perhaps social anxiety symptoms, or the LSAS items in particular, are very different from other types of symptoms, and centrality indices from cross-sectional networks for another disorder would show different properties. Although the extent to which cross-sectional data have meaning for causality is complex and contentious, some authors have proposed situations under which cross-sectional data should be expected to yield causal insights (Pearl, 2000). In brief, among other conditions, the modeling strategy of directed acyclic graphs presented by Pearl requires that there cannot be feedback loops or vicious circles; more generally, only one direction of effect can be modeled between two variables in cross-sectional data (if A causes B, B cannot cause A). Pearl’s approach also assumes all important variables in the causal system are included in the network. It is unclear to us whether clinical researchers generally consider these issues regarding cross-sectional data, but it is possible that giving them greater attention (cf. Morgan & Winship, 2015; Pearl, 2000) might lead to more positive results. Notably, however, one or two sets of psychological symptoms (i.e., the typical focus of most network analysis papers thus far) do not seem like plausible candidates for a set of variables that would satisfy these conditions.
Some additional concerns are worth discussing. First, although our samples were large and reasonably diverse, greater diversity (e.g., racial diversity) would have been desirable. Second, we do not believe the kind of data examined here would ever be expected to hold to the conditions that have been suggested as necessary for cross-sectional data to comment on causality, but in theory the measurement could have been improved to increase applicability. For example, the full range of theorized causes of social anxiety could have been included in the model, rather than social anxiety symptoms alone. That said, our examination was focused on determining whether currently common network analyses would be successful in determining key symptoms, and the available networks rarely move beyond the confines of symptoms of one or two disorders (cf. Fried, 2016). Finally, there are other centrality indices available (e.g., Haslbeck & Fried, 2017), and we are aware of others that are under development. It is always possible that these indices will prove more useful, although we encourage skepticism given our current results.
Conclusions
Keeping those limitations in mind, we have several recommendations for treatment providers and treatment outcome researchers. First, we suggest caution in interpreting existing networks using cross-sectional data as indicating important symptoms that should be focused on in treatment. It remains possible that some published networks might eventually be shown to have pointed in a useful direction, but our data clearly indicate that cross-sectional networks, even in a large dataset, cannot always be taken as a clear indicator of symptoms that are important in predicting change across treatment for symptoms overall (as opposed to the specific items used for analysis). Of note, attempting to find one or two most central symptoms to focus on gains even less support from our analyses, which (a) focused on centrality indices as continuous variables (i.e., not one or two most central symptoms) and (b) revealed that, unsurprisingly, the precise symptoms that were most central varied by analysis, sample, and centrality index (see Table S1).
Second, for those instances in which researchers wish to focus on cross-sectional data to inform treatment research, we urge them to carefully consider whether their data and methods are consistent with the recommendations of theorists who at least find it plausible that this is a fruitful exercise (e.g., Pearl, 2000). Third, we note that longitudinal and experimental network analysis studies are far rarer than cross-sectional studies at this time. This imbalance in the literature is unfortunate: Causal relationships might be better addressed using a combination of longitudinal (i.e., both in groups of participants and individuals) and experimental studies examining networks of symptoms (cf. Fried & Cramer, 2017) alongside carefully conducted tests in cross-sectional data. This call has been made before in regard to network analysis (e.g., Borsboom, & Cramer, 2013; van de Leemput et al., 2014, among others), but we believe the call should be repeated. Longitudinal and experimental studies are difficult and expensive, but they may be our best hope for discovering symptoms that are actually crucial for intervention: We would have to devote more attention to such studies to fully evaluate their promise.
Supplementary Material
Public Health Significance.
Researchers have recently asserted that network analyses might uncover the most important symptoms to target in treatment, even when the data used were collected at a single time point. We examined this issue in generalized social anxiety disorder, and found modest support for the notion. However, simply counting how many participants endorsed the symptom as clearly present was a superior method for identifying important symptoms.
Acknowledgments
This research was supported in part by NIMH grant R21 MH090308 and McDonnell Center for Systems Neuroscience New Resource Grant to Thomas L. Rodebaugh; NIH grant UL1 RR024992 to Washington University St. Louis; NIMH grant R01 MH064481-01A1 and GlaxoSmithKline Pharmaceuticals grant 101618 to Richard G. Heimberg; NIH grant K02 DA023200 to Carlos Blanco; ERC Consolidator Grant no. 647209 to Eiko Fried; NIMH R01 MH092416, NCCAM Grant AT003644, and NIMH Grant R01 MH076074 to James Gross; and 1F31MH115641-01 to Marilyn L. Piccirillo. Thanks to Amit Bernstein for some helpful thoughts about this project.
Footnotes
We thank Sacha Epskamp, who provided a signed review, for uncovering this problem.
Given this unexpected result, we also checked in Sample B itself to be sure that change on the LSAS, SIAS-S, BFNE-S, and SDS were correlated: They were (rs > .35, ps <.001, ns > 133). We also checked whether changes in at least some nodes were correlated with changes in the SIAS-S, BFNE-S, and SDS; this was also true, with each measure having multiple nodes for which changes were correlated at a level of p < .001. This result was therefore not due to the LSAS failing to correlate with other measures, either on the level of the entire LSAS or the individual nodes. On a related note, Sacha Epskamp, who provided a signed review, pointed out that even if no casual process over time were involved in regard to the LSAS scores, centrality might predict in the manner seen here due merely to regression towards the mean. This is obviously an essential point, but one we were not able to address adequately here. We encourage further exploration (via mathematical proof, simulation, and experimental manipulation) of under what conditions centrality indices should be expected to identify nodes that are central to change due to causal processes (as opposed to statistical necessities).
We are grateful to the authors for their speedy and open discussion of this issue. At the time of this writing, the authors are working with the editor of the journal to publish an erratum.
The SDS, however, implies a focus on the past week (by including an option to check a box indicating that one was out of work for the past week for reasons other than the disorder) without specific instructions to that effect. One might therefore argue that the SDS should contain similar method variance. However, as can be seen in Table 2, the results from the SDS could be interpreted as being more positive regarding centrality than for the other measures. Thus, the possibility that this method issue is important is not contraindicated.
Data Transparency
Most of the data reported in this manuscript have been previously published or were collected as part of other data collections focusing on other issues. One or more primary publications for each data set are listed in the supplementary material. Although the Liebowitz Social Anxiety Scale was reported on in some of these manuscripts, none of these previous publications focuses on a network analysis in those data; further, no previous manuscript focuses on the entire set of data reported on here.
Contributor Information
Thomas L. Rodebaugh, Washington University in St Louis
Natasha A. Tonge, Washington University in St Louis
Marilyn L. Piccirillo, Washington University in St Louis
Eiko Fried, University of Amsterdam.
Arielle Horenstein, Temple University.
Amanda S. Morrison, Stanford University
Philippe Goldin, University of California Davis.
James J. Gross, Stanford University
Michelle H. Lim, Washington University in St Louis
Katya Fernandez, Washington University in St Louis.
Carlos Blanco, Columbia University.
Franklin R. Schneier, Columbia University
Ryan Bogdan, Washington University in St Louis.
Renee J. Thompson, Washington University in St Louis
Richard G. Heimberg, Temple University
References
- American Psychiatric Association. Diagnostic and statistical manual of mental disorders: DSM-IV. 4. Washington, DC: American Psychiatric Association; 1994. [Google Scholar]
- Baker SL, Heinrichs N, Kim HJ, Hofmann SG. The Liebowitz Social Anxiety Scale as a self-report instrument: A preliminary psychometric analysis. Behaviour Research and Therapy. 2002;40:701–715. doi: 10.1016/S0005-7967(01)00060-2. [DOI] [PubMed] [Google Scholar]
- Blanco C, Heimberg RG, Schneier FR, Fresco DM, Chen H, Turk CL, … Campeas R. A placebo-controlled trial of phenelzine, cognitive behavioral group therapy, and their combination for social anxiety disorder. Archives of General Psychiatry. 2010;67:286–295. doi: 10.1001/archgenpsychiatry.2010.11. [DOI] [PMC free article] [PubMed] [Google Scholar]
- Borsboom D. Psychometric perspectives on diagnostic systems. Journal of Clinical Psychology. 2008;64:1089–1108. doi: 10.1002/jclp.20503. [DOI] [PubMed] [Google Scholar]
- Borsboom D. A network theory of mental disorders. World Psychiatry. 2017;16:5–13. doi: 10.1002/wps.20375. [DOI] [PMC free article] [PubMed] [Google Scholar]
- Borsboom D, Cramer AJ. Network analysis: An integrative approach to the structure of psychopathology. Annual Review of Clinical Psychology. 2013;99:91–121. doi: 10.1146/annurev-clinpsy-050212-185608. [DOI] [PubMed] [Google Scholar]
- Borsboom D, Cramer AO. Network analysis: an integrative approach to the structure of psychopathology. Annual Review of Clinical Psychology. 2013;9:91–121. doi: 10.1146/annurev-clinpsy-050212-185608. [DOI] [PubMed] [Google Scholar]
- Borsboom D, Cramer AOJ, Schmittmann VD, Epskamp S, Waldorp LJ. The small world of psychopathology. PLoS ONE. 2011;6 doi: 10.1371/journal.pone.0027407. ArtID: e27407. [DOI] [PMC free article] [PubMed] [Google Scholar]
- Borsboom D, Rhemtulla M, Cramer AOJ, van der Maas HLJ, Scheffer M, Dolan CV. Kinds versus continua: A review of psychometric approaches to uncover the structure of psychiatric constructs. Psychological Medicine. 2016;46:1567–1579. doi: 10.1017/s0033291715001944. [DOI] [PubMed] [Google Scholar]
- Bringmann LF, Lemmens LHJM, Huibers MJH, Borsboom D, Tuerlinckx F. Revealing the dynamic network structure of the Beck Depression Inventory-II. Psychological Medicine. 2015;45:747–757. doi: 10.1017/s0033291714001809. [DOI] [PubMed] [Google Scholar]
- Bringmann LF, Pe ML, Vissers N, Ceulemans E, Borsboom D, Vanpaemel W, … Kuppens P. Assessing temporal emotion dynamics using networks. Assessment. 2016;23:725–735. doi: 10.1177/1073191116645909. [DOI] [PubMed] [Google Scholar]
- Bringmann LF, Vissers N, Wichers M, Geschwind N, Kuppens P, Peeters F, … Tuerlinckx F. A network approach to psychopathology: new insights into clinical longitudinal data. PLoS ONE. 2013;8:e60188. doi: 10.1371/journal.pone.0060188. [DOI] [PMC free article] [PubMed] [Google Scholar]
- Brown TA, Barlow DH. Anxiety Disorders Interview Schedule for DSM-IV (ADIS-IV) 1994 doi: 10.1001/archpsyc.1993.01820160009001. [DOI] [PubMed] [Google Scholar]
- Brown TA, Barlow DH. Anxiety and Related Disorders Interview Schedule for DSM-5 (ADIS-5L): Client interview schedule 2014 [Google Scholar]
- Carleton RN, Collimore KC, McCabe RE, Antony MM. Addressing revisions to the Brief Fear of Negative Evaluation scale: Measuring fear of negative evaluation across anxiety and mood disorders. Journal of Anxiety Disorders. 2011;25:822–828. doi: 10.1016/j.janxdis.2011.04.002. [DOI] [PubMed] [Google Scholar]
- Cole DA, Maxwell SE. Testing mediational models with longitudinal data: Questions and tips in the use of structural equation modeling. Journal of Abnormal Psychology. 2003;112:558–577. doi: 10.1037/0021-843x.112.4.558. [DOI] [PubMed] [Google Scholar]
- Cramer AOJ, Waldorp LJ, van der Maas HLJ, Borsboom D. Comorbidity: A network perspective. Behavioral and Brain Sciences. 2010a;33:137–150. doi: 10.1017/s0140525x09991567. [DOI] [PubMed] [Google Scholar]
- Cramer AOJ, Waldorp LJ, van der Maas HLJ, Borsboom D. Complex realities require complex theories: Refining and extending the network approach to mental disorders. Behavioral and Brain Sciences. 2010b;33:178–193. doi: 10.1017/s0140525x10000920. [DOI] [Google Scholar]
- de Vos S, Wardenaar KJ, Bos EH, Snippe E, Hartmann JA, Simons CJP, … Wichers M. Can we jump from cross-sectional to dynamic interpretations of networks? Implications for the network perspective in psychiatry. Psychotherapy and Psychosomatics. 2017;86:175–177. doi: 10.1159/000453583. [DOI] [PMC free article] [PubMed] [Google Scholar]
- DiNardo PA, Brown TA, Barlow DH. Anxiety Disorders Interview Schedule for DSM-IV: Lifetime Version (ADIS-IV-L) San Antonio, TX: The Psychological Corporation; 1994. [Google Scholar]
- Epskamp S, Borsboom D, Fried EI. Estimating psychological networks and their accuracy: A tutorial paper. Behavior Research Methods. 2017 doi: 10.3758/s13428-017-0862-1. [DOI] [PMC free article] [PubMed] [Google Scholar]
- Epskamp S, Cramer AO, Waldorp LJ, Schmittmann VD, Borsboom D. qgraph: Network visualizations of relationships in psychometric data. Journal of Statistical Software. 2012;48:1–18. [Google Scholar]
- Epskamp S, Fried EI. A tutorial on regularized partial correlation networks. Psychological Methods. doi: 10.1037/met0000167. in press. [DOI] [PubMed] [Google Scholar]
- Epskamp S, Rhemtulla M, Borsboom D. Generalized network psychometrics: Combining network and latent variable models. Psychometrika. 2017 doi: 10.1007/s11336-017-9557-x. [DOI] [PubMed] [Google Scholar]
- First M, Williams J, Karg R, Spitzer R. Structured Clinical Interview for DSM-5—research version. American Psychiatric Association; 2015. [Google Scholar]
- First MB, Spitzer RL, Gibbon M, Williams JBW. Structured Clinical Interview for DSM-IV-TR Axis I Disorders, Research Version, Patient Edition (SCID-I/P) 2002 [Google Scholar]
- Fresco DM, Coles ME, Heimberg RG, Leibowitz MR, Hami S, Stein MB, Goetz D. The Liebowitz Social Anxiety Scale: A comparison of the psychometric properties of self-report and clinician-administered formats. Psychological Medicine. 2001;31:1025–1035. doi: 10.1017/s0033291701004056. [DOI] [PubMed] [Google Scholar]
- Fried EI, Borkulo CD, Cramer AOJ, Boschloo L, Schoevers RA, Borsboom D. Mental disorders as networks of problems: A review of recent insights. Social Psychiatry and Psychiatric Epidemiology. 2016;52:1–10. doi: 10.1007/s00127-016-1319-z. [DOI] [PMC free article] [PubMed] [Google Scholar]
- Fried EI, Cramer AOJ. Moving Forward: Challenges and directions for psychopathological network theory and methodology. Perspectives on Psychological Science. 2017 doi: 10.1177/1745691617705892. 1745691617705892. [DOI] [PubMed] [Google Scholar]
- Fried EI, Epskamp S, Nesse RM, Tuerlinckx F, Borsboom D. What are ‘good’ depression symptoms? Comparing the centrality of DSM and non-DSM symptoms of depression in a network analysis. Journal of Affective Disorders. 2016;189:314–320. doi: 10.1016/j.jad.2015.09.005. [DOI] [PubMed] [Google Scholar]
- Goldin PR, Morrison A, Jazaieri H, Brozovich F, Heimberg R, Gross JJ. Group CBT versus MBSR for social anxiety disorder: A randomized controlled trial. Journal of Consulting and Clinical Psychology. 2016;84:427–437. doi: 10.1037/ccp0000092. [DOI] [PMC free article] [PubMed] [Google Scholar]
- Goldin PR, Ziv M, Jazaieri H, Werner K, Kraemer H, Heimberg RG, Gross JJ. Cognitive reappraisal self-efficacy mediates the effects of individual cognitive-behavioral therapy for social anxiety disorder. Journal of Consulting and Clinical Psychology. 2012;80:1034–1040. doi: 10.1037/a0028555. [DOI] [PMC free article] [PubMed] [Google Scholar]
- Gollob HF, Reichardt CS. Taking account of time lags in causal models. Child Development. 1987;58:80–92. [PubMed] [Google Scholar]
- Hambrick JP, Turk CL, Heimberg RG, Schneier FR, Liebowitz MR. Psychometric properties of disability measures among patients with social anxiety disorder. Journal of Anxiety Disorders. 2004;18:825–839. doi: 10.1016/j.janxdis.2003.10.004. [DOI] [PubMed] [Google Scholar]
- Harpole JK, Levinson CA, Woods CM, Rodebaugh TL, Weeks JW, Brown PJ, … Liebowitz M. Assessing the straightforwardly-worded Brief Fear of Negative Evaluation Scale for differential item functioning across gender and ethnicity. Journal of Psychopathology and Behavioral Assessment. 2015;37:306–317. doi: 10.1007/s10862-014-9455-9. [DOI] [PMC free article] [PubMed] [Google Scholar]
- Haslbeck JMB, Fried EI. How predictable are symptoms in psychopathological networks? A reanalysis of 18 published datasets. Psychological Medicine. 2017 doi: 10.1017/S0033291717001258. [DOI] [PubMed] [Google Scholar]
- Heeren A, Jones PJ, McNally RJ. Mapping network connectivity among symptoms of social anxiety and comorbid depression in people with social anxiety disorder. Journal of Affective Disorders. 2018;228:75–82. doi: 10.1016/j.jad.2017.12.003. [DOI] [PubMed] [Google Scholar]
- Heeren A, McNally RJ. Social anxiety disorder as a densely interconnected network of fear and avoidance of social situations. Cognitive Therapy and Research. 2018;42:103–113. doi: 10.1007/s10608-017-9876-3. [DOI] [Google Scholar]
- Heimberg RG, Horner KJ, Juster HR, Safren SA, Brown EJ, Schneier FR, Liebowitz MR. Psychometric properties of the Liebowitz Social Anxiety Scale. Psychological Medicine. 1999;29:199–212. doi: 10.1017/s0033291798007879. [DOI] [PubMed] [Google Scholar]
- Heimberg RG, Mueller GP, Holt CS, Hope DA, Liebowitz MR. Assessment of anxiety in social interaction and being observed by others: The Social Interaction Anxiety Scale and the Social Phobia Scale. Behavior Therapy. 1992;23:53–73. [Google Scholar]
- Jazaieri H, Goldin PR, Werner K, Ziv M, Gross JJ. A Randomized Trial of MBSR Versus Aerobic Exercise for Social Anxiety Disorder. Journal of Clinical Psychology. 2012;68:715–731. doi: 10.1002/jclp.21863. [DOI] [PMC free article] [PubMed] [Google Scholar]
- Leary MR. A brief version of the Fear of Negative Evaluation Scale. Personality and Social Psychology Bulletin. 1983;9:371–375. [Google Scholar]
- Ledley DR, Heimberg RG, Hope DA, Hayes SA, Zaider TI, Dyke MV, … Fresco DM. Efficacy of a manualized and workbook-driven individual treatment for social anxiety disorder. Behavior Therapy. 2009;40:414–424. doi: 10.1016/j.beth.2008.12.001. [DOI] [PubMed] [Google Scholar]
- Leon AC, Olfson M, Portera L, Farber L, Sheehan DV. Assessing psychiatric impairment in primary care with the Sheehan Disability Scale. The International Journal of Psychiatry in Medicine. 1997;27:93–105. doi: 10.2190/T8EM-C8YH-373N-1UWD. [DOI] [PubMed] [Google Scholar]
- Leon AC, Shear MK, Portera L, Klerman GL. Assessing impairment in patients with panic disorder: the Sheehan Disability Scale. Social Psychiatry and Psychiatric Epidemiology. 1992;27:78–82. doi: 10.1007/BF00788510. [DOI] [PubMed] [Google Scholar]
- Liebowitz MR. Social phobia. Modern Problems of Pharmacopsychiatry. 1987;22:141–173. doi: 10.1159/000414022. [DOI] [PubMed] [Google Scholar]
- Mattick RP, Clarke JC. Development and validation of measures of social phobia scrutiny fear and social interaction anxiety. Behaviour Research and Therapy. 1998;36:455–470. doi: 10.1016/s0005-7967(97)10031-6. [DOI] [PubMed] [Google Scholar]
- Maxwell SE, Cole DA. Bias in cross-sectional analyses of longitudinal mediation. Psychological Methods. 2007;12:23–44. doi: 10.1037/1082-989x.12.1.23. [DOI] [PubMed] [Google Scholar]
- Maxwell SE, Cole DA, Mitchell MA. Bias in cross-sectional analyses of longitudinal mediation: Partial and complete mediation under an autoregressive model. Multivariate Behavioral Research. 2011;46:816–841. doi: 10.1080/00273171.2011.606716. [DOI] [PubMed] [Google Scholar]
- McNally RJ, Robinaugh DJ, Wu GWY, Wang L, Deserno MK, Borsboom D. Mental disorders as causal systems: A network approach to posttraumatic stress disorder. Clinical Psychological Science. 2015;3 doi: 10.1177/2167702614553230. [DOI] [Google Scholar]
- Morgan SL, Winship C. Counterfactuals and causal inference: methods and principles for social research. 2. New York, NY: Cambridge University Press; 2015. [Google Scholar]
- Muthén LK, Muthén BO. Mplus user’s guide. 7. Los Angeles, CA: Muthén & Muthén; 1998–2015. [Google Scholar]
- Neter J, Wasserman W, Kutner MG. Applied linear regression analysis. Homewood, IL: Irwin; 1989. [Google Scholar]
- Oakman J, Van Ameringen M, Mancini C, Farvolden P. A confirmatory factor analysis of a self-report version of the Liebowitz Social Anxiety Scale. Journal of Clinical Psychology. 2003;59:149–161. doi: 10.1002/jclp.10124. [DOI] [PubMed] [Google Scholar]
- Olfson M, Fireman B, Weissman MM, Leon AC, Sheehan DV, Kathol RG, … Farber L. Mental disorders and disability among patients in a primary care group practice. American Journal of Psychiatry. 1997;154:1734–1740. doi: 10.1176/ajp.154.12.1734. [DOI] [PubMed] [Google Scholar]
- Pearl J. Causality: models, reasoning, and inference. Cambridge, U.K.; New York: Cambridge University Press; 2000. [Google Scholar]
- Robinaugh DJ, LeBlanc NJ, Vuletich HA, McNally RJ. Network analysis of persistent complex bereavement disorder in conjugally bereaved adults. Journal of Abnormal Psychology. 2014;123:510–522. doi: 10.1037/abn0000002. [DOI] [PMC free article] [PubMed] [Google Scholar]
- Robinaugh DJ, Millner AJ, McNally RJ. Identifying highly influential nodes in the complicated grief network. Journal of Abnormal Psychology. 2016;125 doi: 10.1037/abn0000181. [DOI] [PMC free article] [PubMed] [Google Scholar]
- Rodebaugh TL, Heimberg RG, Brown PJ, Fernandez KC, Blanco C, Schneier FR, Liebowitz MR. More reasons to be straightforward: Findings and norms for two scales relevant to social anxiety. Journal of Anxiety Disorders. 2011;25:623–630. doi: 10.1016/j.janxdis.2011.02.002. [DOI] [PMC free article] [PubMed] [Google Scholar]
- Rodebaugh TL, Lim MH, Fernandez KC, Langer JK, Weisman JS, Tonge N, … Shumaker EA. Self and friend’s differing views of social anxiety disorder’s effects on friendships. Journal of Abnormal Psychology. 2014;123:715–724. doi: 10.1037/abn0000015. [DOI] [PMC free article] [PubMed] [Google Scholar]
- Rodebaugh TL, Woods CM, Heimberg RG. The reverse of social anxiety is not always the opposite: The reverse-scored items of the Social Interaction Anxiety Scale do not belong. Behavior Therapy. 2007;38:192–206. doi: 10.1016/j.beth.2006.08.001. [DOI] [PubMed] [Google Scholar]
- Rodebaugh TL, Woods CM, Heimberg RG, Liebowitz MR, Schneier FR. The factor structure and screening utility of the Social Interaction Anxiety Scale. Psychological Assessment. 2006;18:231–237. doi: 10.1037/1040-3590.18.2.231. [DOI] [PubMed] [Google Scholar]
- Rodebaugh TL, Woods CM, Thissen DM, Heimberg RG, Chambless DL, Rapee RM. More information from fewer questions: The factor structure and item properties of the original and Brief Fear of Negative Evaluation scale. Psychological Assessment. 2004;16:169–181. doi: 10.1037/1040-3590.16.2.169. [DOI] [PubMed] [Google Scholar]
- Ruzzano L, Borsboom D, Geurts HM. Repetitive behaviors in autism and obsessive-compulsive disorder: New perspectives from a network analysis. Journal of Autism and Developmental Disorders. 2015;45 doi: 10.1007/s10803-014-2204-9. [DOI] [PubMed] [Google Scholar]
- Sheehan DV. The anxiety disease. New York: Scribner; 1983. [Google Scholar]
- Sheehan DV, Lecrubier Y, Sheehan KH, Amorim P, Janavs J, Weiller E, … Dunbar GC. The Mini-International Neuropsychiatric Interview (M.I.N.I): The development and validation of a structured diagnostic psychiatric interview for DSM-IV and ICD-10. Journal of Clinical Psychiatry. 1998;59(Suppl 20):22–33. [PubMed] [Google Scholar]
- Stekhoven DJ, Buhlmann P. MissForest--non-parametric missing value imputation for mixed-type data. Bioinformatics. 2012;28:112–118. doi: 10.1093/bioinformatics/btr597. [DOI] [PubMed] [Google Scholar]
- Terluin B, de Boer MR, de Vet HCW. Differences in Connection Strength between Mental Symptoms Might Be Explained by Differences in Variance: Reanalysis of Network Data Did Not Confirm Staging. PLoS ONE. 2016;11:e0155205. doi: 10.1371/journal.pone.0155205. [DOI] [PMC free article] [PubMed] [Google Scholar]
- van de Leemput IA, Wichers M, Cramer AOJ, Borsboom D, Tuerlinckx F, Kuppens P, … Scheffer M. Critical slowing down as early warning for the onset and termination of depression. PNAS Proceedings of the National Academy of Sciences of the United States of America. 2014;111:87–92. doi: 10.1073/pnas.1312114110. [DOI] [PMC free article] [PubMed] [Google Scholar]
- Weeks JW, Heimberg RG, Fresco DM, Hart TA, Turk CL, Schneier FR, Liebowitz MR. Empirical validation and psychometric evaluation of the Brief Fear of Negative Evaluation Scale in patients with social anxiety disorder. Psychological Assessment. 2005;17:179–190. doi: 10.1037/1040-3590.17.2.179. [DOI] [PubMed] [Google Scholar]
- Wichers M. The dynamic nature of depression: a new micro-level perspective of mental disorder that meets current challenges. Psychological Medicine. 2014;616:1–12. doi: 10.1017/S0033291713001979. [DOI] [PubMed] [Google Scholar]
- Wichers M, Groot PC, Psychosystems EG EWS Group. Critical Slowing Down as a Personalized Early Warning Signal for Depression. Psychotherapy and Psychosomatics. 2016;85:114–116. doi: 10.1159/000441458. [DOI] [PubMed] [Google Scholar]
Associated Data
This section collects any data citations, data availability statements, or supplementary materials included in this article.