Abstract
Background
The aim of this study was to compare the expression levels of mRNA of the B cell-specific Moloney murine leukemia virus integration site 1 (BMI-1) and the WW domain-containing oxidoreductase (WWOX) genes and their protein products in tissues from patients with liver cancer with normal liver tissues from patients without liver cancer.
Material/Methods
The liver cancer group (N=56) included patients with available tissue samples of histologically confirmed liver cancer. The control group (N=24) included histologically confirmed normal liver tissue samples. Immunofluorescence staining and Western blot were used to detect and compare protein expression of Bmi-1 and WWOX in liver tissues in the liver cancer group and the control group. Reverse transcription-polymerase chain reaction (RT-PCR) was used to detect and compare mRNA expression of BMI-1 and WWOX in liver tissues in the liver cancer group and the control group. Expression levels of the protein and mRNA levels and the clinicopathological features including patient prognosis in liver cancer were evaluated statistically using analysis of variance (ANOVA).
Results
There were significant differences in the expression levels of protein and mRNA of BMI-1 and WWOX between the liver cancer group and the control group. BMI-1 mRNA and protein expression were significantly increased, and WWOX mRNA and protein expression were significantly reduced in liver cancer tissue, compared with normal liver tissue (p<0.05).
Conclusions
In liver cancer tissue compared with normal liver, the expression of BMI-1 and WWOX mRNA and their protein products were upregulated and down-regulated, respectively.
MeSH Keywords: B-Cell Activating Factor, Clinical Alarms, Diagnosis, Liver Neoplasms
Background
The liver is an organ with several important metabolic functions that include glycogen storage, removal of toxins and oxygen radicals, and protein synthesis and secretion [1]. Worldwide, the incidence of liver cancer (hepatocellular carcinoma) is increasing annually, and its recurrence rate is high even after treatment, and so there remains an urgent need to find effective methods to treat this form of malignancy [2,3]. The pathogenesis of liver cancer remains unclear and there is still a lack of prognostic biomarkers for liver cancer. The development of molecular techniques has led to the increasing application of molecular techniques to the study of human cancers, including liver cancer.
The genes related to liver cancer include oncogenes, tumor suppressor genes and deoxyribonucleic acid (DNA) mismatch repair genes [4]. The B cell-specific Moloney murine leukemia virus insertion site 1 (BMI-1) gene and the WW domain-containing oxidoreductase (WWOX) gene have been recently identified, which are closely related to the occurrence and development of several types of human malignant tumors, but their roles in liver cancer have not been previously reported [5,6].
Therefore, the aim of this study was to compare the expression levels of mRNA of the BMI-1 and WWOX genes and their protein products in tissues from patients with liver cancer with normal liver tissues from patients without liver cancer.
Material and Methods
Patients in the liver cancer group and the control group
Liver tissue specimens were collected from patients undergoing liver surgery in our hospital, who complete medical records and clinical data. The liver cancer group (N=56) (32 men and 24 women) included patients with available tissue samples of histologically confirmed liver cancer. The control group (N=24) (14 men and 10 women) included histologically confirmed normal liver tissue samples. The mean age of the patients in the liver cancer group was 57±13 years; the mean age of the control group was 52±14 years. There were no statistically significant differences in gender and age between two groups (p>0.05), and demographic data were comparable.
Reagents used
The following reagents were obtained and used in the study: bicinchoninic acid (BCA) protein quantification kits (Beyotime, Shanghai, China), BeyoECL Plus kits (Beyotime, Shanghai, China), TRIzol Total ribonucleic acid (RNA) extraction kits (Tiangen, Beijing, China), reverse transcription-polymerase chain reaction (RT-PCR) kits (Tiangen, Beijing, China), and anti-β-actin, anti-Bmi-1 and anti-WWOX monoclonal antibodies, secondary antibodies and fluorescent secondary antibodies (CST, Boston, USA).
Light microscopy using routine hematoxylin and eosin (H&E) staining
Liver tissues from the control group and the liver cancer group were fixed in 10% formaldehyde, treated with 70% ethanol, and embedded in paraffin wax to form paraffin blocks. Tissue sections were cut at 5 μm onto glass slides from the paraffin blocks using a microtome. The tissue sections were routinely stained histochemically with hematoxylin and eosin (H&E). The stained tissue sections were reviewed by a pathologist, to identify normal liver and liver cancer. Tissue sections were viewed at a magnification of x 200 under light microscopy for evaluation and photography.
Immunofluorescence staining
Prepared paraffin tissue sections from the control group and the liver cancer group, were de-waxed in xylene twice for 15 min, dehydrated in graded concentrations of ethanol (5 min each) and rinsed three times with 0.01 M phosphate buffer saline (PBS) (pH 7.4) (5 min each). The tissue sections on the glass slides were placed in a humid box. Non-specific antibody binding was blocked by incubation with 10% bovine serum albumin (BSA) for 30 min at 37°C. Primary antibodies to Bmi-1 (diluted at 1: 70) and to WWOX (diluted at 1: 100) were added to the tissue sections and incubated in the humid box for at 4°C overnight. After rinsing with PBS (pH 7.4) three times (5 min each), the fluorescence-labeled secondary antibodies (diluted at 1: 100) were added and incubated in the dark in the humid box at 37°C for 2 hours. The tissue sections were mounted in buffered glycerol, viewed under a fluorescence microscope and photographed.
Reverse transcription-polymerase chain reaction (RT-PCR)
Samples of liver tissues from the control group and the liver cancer group were transferred into Eppendorf (Ep) tubes containing RNAiso Plus extracting solution for 5 min for complete cell lysis. Samples were then centrifuged at 12,000x g at 4°C for 5 min, and the supernatant was collected, 0.2 mL chloroform was added and mixed, left for 5 min, followed by centrifugation at 12,000×g at 4°C for 15 min. The supernatant was aspirated, the same volume of isopropanol was added, mixed, and left to stand at room temperature for 10 min, and then centrifuged at 12,000×g and 4°C for 10 min. The supernatant was carefully discarded, and the precipitate was collected, 1 mL of 75% ethanol was added, mixed and centrifuged at 12,000×g at 4°C for 5 min. This process was repeated once. After washing the RNA precipitate, the liquid was discarded, and RNase-free water was added. The partial total RNA solution was diluted to 1 μg/μL with RNase-free water. The reverse transcription reaction solution was prepared according to the instructions of PrimeScript® RT reagent kit with genomic DNA (gDNA) eraser kits. Then, the corresponding RNA sample was added, and complementary DNA (cDNA) was obtained via reverse transcription and stored at −20°C. Messenger RNA (mRNA) levels were measured according to the instructions of the SYBR® Premix Ex Taq™ II (Tli RNaseH Plus) kits.
BMI-1 primers were 5′-3′ ATGCATCGAACAACGAGAATCAAGATCACT and 3′-5′ TCAACCAGAAGAAGTTGCTGATGACCC.
WWOX primers were 5′-3′ GAGTTCCTGAGCGAGTGGAC and 3′-5′ CCCCAGGAATTCCCTGCTT.
Western blots
Samples of liver tissues from the control group and the liver cancer group were washed twice with an ice-cold saline solution. According to the instructions of whole protein extraction kits, lysis solution was added to the tissues and the mixture was homogenized for 1 min and centrifuged. Then, the supernatant was collected, and the protein concentration was determined using the BCA protein concentration kit. The total protein extract was mixed with loading buffer at a volume ratio of 1: 1, heated in boiling water for 5 min and allowed to cool.
A sodium dodecyl sulfate-polyacrylamide gel electrophoresis (SDS-PAGE) separation gel was prepared according to the molecular weight of the target protein, followed by heating for about 1 h. Then, 5% SDS-PAGE spacer gel was prepared and heated for about 30 mins. Electrophoresis buffer was added, and the denatured protein samples were loaded onto sample loading wells according to the protein concentration, so that the total protein content per well was the same. Electrophoresis was performed at a constant voltage of 220 V and stopped after the bromophenol blue reached the bottom of the gel. Then, the gel was cut based on the molecular weight of the target protein, the gel strips were placed in transfer buffer, and one layer of polyvinylidene fluoride (PVDF) membrane and six layers of filter paper were cut, according to the size of the gel.
The PVDF membrane was immersed in methanol for 10 s, and then put into the transfer buffer together with the filter paper, and placed into the transfer unit in the sequence of positive electrode (three layers of filter paper), negative electrode (the PVDF membrane gel and three layers of filter paper) with attention given to the alignment. The membrane transfer was undertaken for 2 h at a constant voltage of 110 V. The PVDF membranes containing the proteins were blocked with 5% dried skimmed milk powder on a shaker at room temperature for 2 h. The blocked membrane was washed with Tween-tris buffered saline (TTBS) for 5 min, incubated with the primary antibodies at 4°C overnight. The membrane was washed three times in TTBS (10 min/time), incubated with the corresponding secondary antibody on a shaker at room temperature for 3 h, and rinsed three times with TTBS (10 min/time).
A gel imager was preheated for 30 min, and reagent A and reagent B in the electrochemical luminescence (ECL) kits were mixed at the same volume, added dropwise onto the PVDF membrane in the dark and color development was undertaken for 1 min. The filter paper was used to blot excess liquid around the membrane, and then the membrane was placed into the gel imager. The dynamic integration mode was applied to image the results, and image analysis software was used.
Statistical analysis
Experimental data were expressed as the mean ± standard error of the mean (mean ±SEM). Statistical analysis was performed using SPSS version 17.0 software. Analysis of variance (ANOVA) or the t-test was used for data analysis, and a p<0.05 was assumed to indicate a statistically significant difference between the two groups.
Results
Histopathology of the liver tissue samples in the liver cancer group and the control group
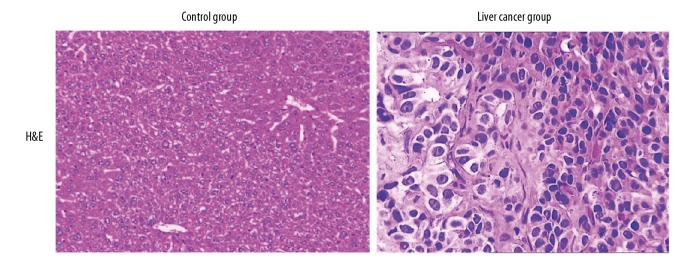
Liver tissue sections from the control group and the liver cancer group were routinely stained with hematoxylin and eosin (H&E) and were examined by light microscopy. For the liver cancer tissues, the histological characteristics were determined. As shown in Figure 1, hepatocytes in the control group were arranged regularly and had a uniform size and shape. In comparison with the control group, liver tissue in the cases from the liver cancer group showed abnormal cell organization, with cells showing cell atypia, varying size, and an increase in the size of cell nuclei, with cell mitoses, and inflammatory cell infiltrates in the liver. The histology was different between the two groups.
Figure 1.
Photomicrographs of the liver tissue sections stained with hematoxylin and eosin (H&E) in the control group and the liver cancer group. Compared with liver tissues in the control group, histology of the liver in the liver cancer group shows disorganized liver architecture, cell atypia, damaged cell nuclei, and extensive infiltration of inflammatory cells in the liver. Hematoxylin and eosin (H&E). Magnification ×200.
Immunofluorescence staining
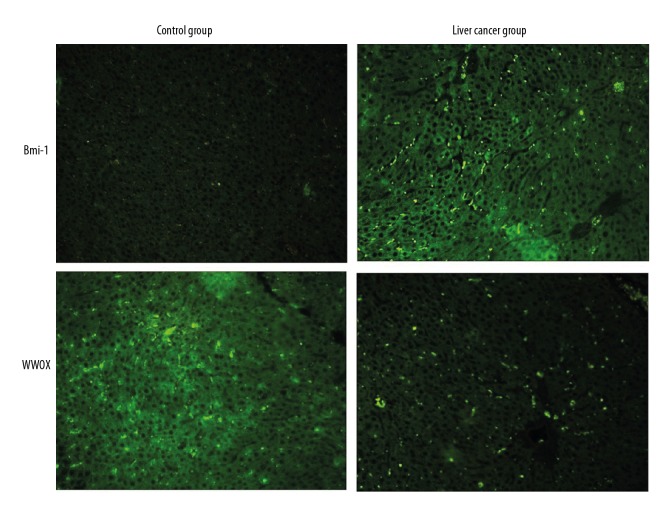
The immunofluorescence staining results (Figure 2) of liver tissue sections in the control group and the liver cancer group showed that Bmi-1 protein expression was low or absent in the control group and increased in the liver cancer group. WWOX protein expression was high in the control group, but was low or absent in the liver cancer group, indicating that Bmi-1 and WWOX proteins may be involved in the development of liver cancer.
Figure 2.
Immunofluorescence staining results of liver tissue sections in the control group and the liver cancer group. Bmi-1 protein expression was low or absent in the control group and increased in the liver cancer group. WWOX protein expression was high in the control group but was low or absent in the liver cancer group. Magnification ×200.
Reverse transcription-polymerase chain reaction (RT-PCR) for BMI-1 and WWOX mRNAs in the liver cancer group and the control group
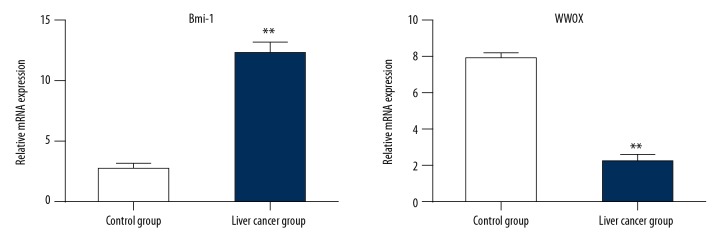
Reverse transcription-polymerase chain reaction (RT-PCR) for BMI-1 and WWOX mRNAs showed that mRNA expression of BMI-1 was very low in the control group and was increased in the liver cancer group; mRNA expression of WWOX was very high in the control group and was decreased in the liver cancer group (Figure 3).
Figure 3.
Reverse transcription-polymerase chain reaction (RT-PCR) for BMI-1 and WWOX mRNAs in the liver cancer group and the control group. The mRNA expression levels of BMI-1 are low or absent in the control group and increased in the liver cancer group. The mRNA expression levels of WWOX are high in the control group and decreased in the liver cancer group. ** p<0.05.
Western blot for Bmi-1 and WWOX protein expression in the liver cancer and control tissues
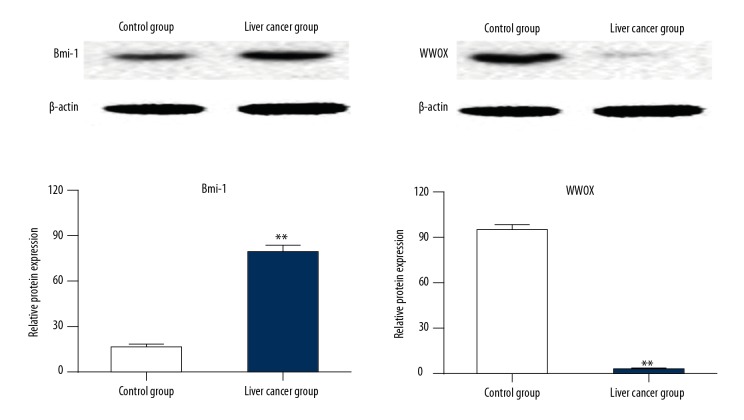
Liver tissue samples were taken from the control group and the liver cancer group underwent protein extraction and Western blotting. Protein expression levels of Bmi-1 were low in the control group and were increased in the liver cancer group, while protein levels of WWOX were high in the control group and decreased in the liver cancer group (Figure 4).
Figure 4.
Western blot for Bmi-1 and WWOX protein expression in the liver cancer and control tissues. Protein expression levels of Bmi-1 were low in the control group and were increased in the liver cancer group. Protein levels of WWOX were increased in the control group and decreased in the liver cancer group. ** p<0.05.
Discussion
The liver is a major organ that is located in the upper abdomen, and because of its important physiological functions, liver cancer is associated with high morbidity and mortality, and more effective methods of treatment are urgently needed [7]. The development of liver cancer results from the simultaneous or sequential effects of multiple oncogenes and tumor suppressor genes. Worldwide, the annual incidence of liver cancer has been increasing and tens of thousands of patients are newly diagnosed, with increasing numbers of cases occurring in young people [8–10]. Liver cancer is found in all age groups, regardless of age and sex, but is more common in middle-aged and elderly men [11,12]. There remains a need for more effective treatment methods for liver cancer, even though a large number of studies have been performed on the diagnosis and treatment of liver cancer [13].
The B cell-specific Moloney murine leukemia virus integration site 1 (BMI-1) gene encodes the Bmi-1 protein, which is one of the core members of the PCG family and plays important roles in the development of embryonic mammalian bones, nerves, and hematopoiesis [14]. BMI-1 and Bmi-1 have been shown to be highly expressed in tumor cells, and cancer stem cells, and the expression levels have previously been shown to be correlated with tumor occurrence, development, tumor invasion, and prognosis [15–17]. The WW domain-containing oxidoreductase (WWOX) gene encodes the WWOX protein and is a newly discovered tumor suppressor gene. Previous studies have indicated that BMI-1 and WWOX are able to participate and play important roles in the occurrence and development of malignant tumors [18–20]. However, the roles of BMI-1 and WWOX in liver cancer have not been previously studied, and their roles and molecular mechanisms in liver cancer require further validation.
In the present study, 56 liver cancer tumor tissue samples were obtained from patients and included in the liver cancer study group, and were compared with 24 normal liver tissue samples were included in the control group. Routine light microscopy using hematoxylin and eosin (H&E) staining was used to confirm the histopathologic differences between the liver cancer group and the control group. In the control group, the normal architecture of the liver and normal liver cell morphology were confirmed, and in the tissues included in the liver cancer group, liver cancer was confirmed by the presence of abnormal liver architecture, destruction of liver tissue, including inflammation, and hepatocyte atypia.
Immunofluorescence staining and Western blot showed that expression of Bmi-1 protein was low or absent in the liver tissue from the control group and increased in the liver tissue of the liver cancer group, and WWOX protein was highly expressed in the liver tissue of the control group, but the expression was decreased in the liver tissue of the liver cancer group. Reverse transcription-polymerase chain reaction (RT-PCR) showed low expression levels of BMI-1 mRNA in the normal liver tissues of the control group, and high expression levels in the liver tissue of the liver cancer group. RT-PCR showed high expression levels of WWOX mRNA in the normal liver tissues of the control group, and low expression levels in the liver tissue of the liver cancer group. These findings showed that in liver cancer tissue, compared with normal liver tissue, the expression of BMI-1 and WWOX mRNA and their protein products were upregulated and down-regulated, respectively.
Conclusions
The findings of this study showed that the expression levels of BMI-1 and WWOX mRNA and their protein products in liver cancer tissue compared with normal liver tissue showed that BMI-1 mRNA and Bmi-1 were upregulated in liver cancer and that WWOX mRNA and WWOX were down-regulated in liver cancer. These preliminary findings support the need for further molecular studies on BMI-1 and WWOX in liver cancer.
Footnotes
Conflict interest
None.
Source of support: Departmental sources
References
- 1.Wang X, Chen Y, Han QB, et al. Proteomic identification of molecular targets of gambogic acid: Role of stathmin in hepatocellular carcinoma. Proteomics. 2016;9:242–53. doi: 10.1002/pmic.200800155. [DOI] [PubMed] [Google Scholar]
- 2.Fu WM, Wang WM, Wang H, et al. 1,3,5-trihydroxy-13,13-dimethyl-2H-pyran [7,6-b] xanthone directly target heat shock protein 27 in hepatocellular carcinoma. Cell Biol Int. 2015;38:272–76. doi: 10.1002/cbin.10193. [DOI] [PubMed] [Google Scholar]
- 3.Shimizu S, Takehara T, Hikita H, et al. The let-7 family of microRNAs inhibits Bcl-xL expression and potentiates sorafenib-induced apoptosis in human hepatocellular carcinoma. J Hepatol. 2017;52:698–704. doi: 10.1016/j.jhep.2009.12.024. [DOI] [PubMed] [Google Scholar]
- 4.Su H, Yang JR, Xu T, et al. MicroRNA-101, down-regulated in hepatocellular carcinoma, promotes apoptosis and suppresses tumorigenicity. Cancer Res. 2016;69:1135–42. doi: 10.1158/0008-5472.CAN-08-2886. [DOI] [PubMed] [Google Scholar]
- 5.Gramantieri L, Ferracin M, Fornari F, et al. Cyclin G1 is a target of miR-122a, a microRNA frequently down-regulated in human hepatocellular carcinoma. Cancer Res. 2017;67:6092–99. doi: 10.1158/0008-5472.CAN-06-4607. [DOI] [PubMed] [Google Scholar]
- 6.Xiong Y, Fang JH, Yun JP, et al. Effects of microRNA-29 on apoptosis, tumorigenicity, and prognosis of hepatocellular carcinoma. Hepatology. 2016;51:836–45. doi: 10.1002/hep.23380. [DOI] [PubMed] [Google Scholar]
- 7.Li C, Tu K, Zheng X, et al. MicroRNA-218 expression and its role in hepatocellular carcinoma. Nan Fang Yi Ke Da Xue Xue Bao. 2013;33:1127–31. [PubMed] [Google Scholar]
- 8.He X, Dong Y, Wu CW, et al. MicroRNA-218 inhibits cell cycle progression and promotes apoptosis in colon cancer by downregulating BMI1 polycombing finger oncogene. Mol Med. 2013;18:1491–98. doi: 10.2119/molmed.2012.00304. [DOI] [PMC free article] [PubMed] [Google Scholar]
- 9.Zhang JF, He ML, Fu WM, et al. Primate-specific miRNA-637 inhibits tumorigenesis in hepatocellular carcinoma by disrupting Stat3 signaling. Hepatology. 2015;54:2137–48. doi: 10.1002/hep.24595. [DOI] [PubMed] [Google Scholar]
- 10.Zhang JF, Fu WM, He ML, et al. MiRNA-20a promotes osteogenic differentiation of human mesenchymal stem cells by co-regulating BMP signaling. RNA Biol. 2011;8(5):829–38. doi: 10.4161/rna.8.5.16043. [DOI] [PubMed] [Google Scholar]
- 11.Effendi K, Mori T, Komuta M, et al. Bmi-1 gene is upregulated in early-stage hepatocellular carcinoma and correlates with ATP-binding cassette transporter B1 expression. Cancer Sci. 2016;101:666–72. doi: 10.1111/j.1349-7006.2009.01431.x. [DOI] [PMC free article] [PubMed] [Google Scholar]
- 12.Sasaki M, Ikeda H, Itatsu K, et al. The overexpression of polycomb group proteins Bmi1 and EZH2 is associated with the progression and aggressive biological behavior of hepatocellular carcinoma. Lab Invest. 2018;88:873–82. doi: 10.1038/labinvest.2008.52. [DOI] [PubMed] [Google Scholar]
- 13.Wang H, Pan K, Zhang HK, et al. Increased polycomb-group oncogene Bmi-1 expression correlates with poor prognosis in hepatocellular carcinoma. J Cancer Res Clin Oncol. 2018;134:535–41. doi: 10.1007/s00432-007-0316-8. [DOI] [PubMed] [Google Scholar]
- 14.Lessard J, Sauvageau G. Bmi-1 determines the proliferative capacity of normal and leukemic stem cells. Nature. 2013;423:255–60. doi: 10.1038/nature01572. [DOI] [PubMed] [Google Scholar]
- 15.Jacobs JJ, Kieboom K, Marino S, et al. The oncogene and Polycomb-group gene bmi-1 regulates cell proliferation and senescence through the ink4a locus. Nature. 2015;397:164–48. doi: 10.1038/16476. [DOI] [PubMed] [Google Scholar]
- 16.Aqeilan RI, Hagan JP, Aqeilan HA, et al. Inactivation of the Wwox gene accelerates forestomach tumor progression in vivo. Cancer Res. 2017;67:5606–10. doi: 10.1158/0008-5472.CAN-07-1081. [DOI] [PMC free article] [PubMed] [Google Scholar]
- 17.Aderca I, Moser CD, Veerasamy M, et al. The JNK inhibitor SP600129 enhances apoptosis of HCC cells induced by the tumor suppressor WWOX. J Hepatol. 2018;49:373–83. doi: 10.1016/j.jhep.2008.05.015. [DOI] [PMC free article] [PubMed] [Google Scholar]
- 18.Park SW, Ludes-Meyers J, Zimonjic DB, et al. Frequent downregulation and loss of WWOX gene expression in human hepatocellular carcinoma. Br J Cancer. 2014;91:753–59. doi: 10.1038/sj.bjc.6602023. [DOI] [PMC free article] [PubMed] [Google Scholar]
- 19.Li YP, Wu CC, Chen WT, et al. The expression and significance of WWOX and beta-catenin in hepatocellular carcinoma. APMIS. 2013;121:120–26. doi: 10.1111/j.1600-0463.2012.02947.x. [DOI] [PubMed] [Google Scholar]
- 20.Schuchardt BJ, Bhat V, Mikles DC, et al. Molecular origin of the binding of WWOX tumor suppressor to ErbB4 receptor tyrosine kinase. Biochemistry. 2013;52:9223–36. doi: 10.1021/bi400987k. [DOI] [PMC free article] [PubMed] [Google Scholar]


