

Abstract
Hepatocellular carcinoma (HCC) is one of the main consequences of liver chronic disease. Hepatocellular carcinoma-related changes may be seen in patients with chronic hepatitis B. The aim of the current study was to quantitate liver tissue elements by stereological technique in patients with hepatitis B-related cancer and compare the results with control and only hepatitis B group. Needle liver biopsies from 40 patients with only chronic hepatitis B infection, from 41 patients with only early hepatocellular carcinoma, from 40 patients with early hepatitis B-related cancer and 30 healthy subjects (control group) were analyzed by stereological method using systematic uniform random sampling method. Haematoxylin and eosin stained sections were used. The numerical density of hepatocytes, hepatocyte volume, numerical density of Kupffer cells, volume density of the connective tissue in the portal space, and volume density of the connective tissue were assessed. Quantitative analysis of liver samples indicated that there were statistically significant differences in the numerical density of hepatocytes, hepatocyte volume, numerical density of Kupffer cells, volume density of the connective tissue in the portal space, and volume density of the connective tissue between control and hepatitis B-related cancer and hepatitis B groups. Quantitative, stereological technique is simple and reliable for evaluating HCC in chronic hepatitis B. It is useful for assessing the liver tissue parameters. Stereology is recommended for the diagnosis of people prone to cancer in patients with chronic hepatitis B.
Key words: Hepatocellular carcinoma, hepatitis B, stereology
Introduction
Hepatocellular carcinoma (HCC) is a potentially lethal primary liver malignancy worldwide. It is the fifth common cancer and the third leading cause of cancer-related death.1 In most of patients with HCC, there is evidence of hepatitis B virus (HBV) infection. In HBV patients, the risk of functional impairment and degeneration of the liver structure is high.2,3 Current study by Alavian et al.4 has shown that in many Middle Eastern countries such as Iran, the main cause of HCC was the HBV infection. This is despite the fact that, in African and some Asian countries such as Pakistan, the leading cause of HCC was HCV.
Late diagnosis is the main cause of death in HCC patients. Therefore early detection is crucial to preserve the patients.5 Liver biopsy, surgical procedures and conventional histopathology are routine methods for HCC diagnosis by evaluating the presence, type and extension of preneoplastic and neoplastic lesions via assessing the morphological changes such as wide cell plates, loss of the reticular framework, small cell change, mitotic activity, stromal and vascular invasion.6
It should be noted that the risk of HCC is high in HBV infected patients and it is necessary to monitor the disease development from HBV to malignant conditions.7 Tracking the HCC-related histological changes by stereology may be a reliable way to know pathogenesis of HCC and should be considered more than ever.8 In addition to the histopathology, new and upto- date techniques such as stereology have been used to distinguish hepatocellular lesions in some animal models.9 In addition, there are some classical experiment about the induction of the drugs and evaluation of the metabolizing system of liver cells in animals. These studies usually have reported the appearance and qualitative changes in hepatocytes and hepatocyte’s organelles by stereological methods on samples of animal tissues.10-12 Despite its potential, using stereology to study quantitatively main features of HCC lesions has not been applied routinely in humans. In a study, Zaitoun et al.13 performed a quantitative assessment of fibrosis and steatosis on needle liver biopsies from patients with chronic hepatitis C. They assessed the area fractions of fibrosis, steatosis, parenchyma, and other structures by stereological method. They emphasized the stereology as a simple and reliable technique for evaluating hepatic fibrosis and steatosis in chronic hepatitis C. They also found the origin, location, and the stage of fibrosis quantitatively by stereology.
Recently, Postnikova et al.14 studied the ultrastructural and stereological changes of the liver in chronic mixed HCV+HBV infection in humans. They showed changes in the hepatocyte ultrastructure of different degree by electron microscopy. Also, they reported specific ring-shaped nuclei in the periportal hepatocytes and the hepatocellular regeneratory complex in the perinuclear zone. Modified hepatocytes and destruction of the cytoplasmic organelles were the most severe signs of the infectious process. On the other hand, stereological analysis of liver biopsy specimens revealed the slight variations in the volume density of smooth cytoplasmic reticulum elements in chronic mixed HCV+HBV infection.
As far as we know, these parameters have never been evaluated in HBV-related HCC in Iranian patients. There are several methods for assessing HBV-related HCC lesions in clinical practice. Chemical techniques are good methods but requires a large sample of liver tissue (more than 1 cm in length, 1 cm in width and 1 cm in thickness). Histological tests are very common, but the results are qualitative and do not provide accurate statistical quantitative information. Therefore, the accurate assessment of the quantity of liver’s elements is important for the pathological, clinical, and prognostic evaluation of patients with HBV-related HCC, particularly for the evaluation of new treatment strategies in patients. In the present study, we aimed to quantify and compare hepatic changes by stereological and morphometric techniques in four groups, patients with chronic HBV alone, patients with early HCC without HBV, patients with HBV-related early HCC and healthy subjects. Our main goal was to investigate if quantitative parameters of hepatocytes are associated with HBV-related primary hepatocellular lesions and increased its diagnostic power for the detection of HCC.
Materials and Methods
Patients
This study was performed on fresh needle liver biopsy specimens of 121 Iranian patients including only chronic HBV infection (HBV, n=40), patients with only early hepatocellular carcinoma (single tumor < 5 cm without vascular invasion) (HCC, n=41) and patients with early HBV-related HCC (HBV+HCC, n=40), in accordance with WHO criteria.
The samples were collected from two hospitals: Namazi Hospital and Shaheed Labbafinezhad Hospital, Iran. Sampling was done at a specified time, from September 2015 to May 2016. Also, people who were liver donors, had no symptoms of infectious diseases (HBV, HCV) and had normal hepatic enzymes (ALT), were selected as healthy control group (C, n=30). Histological diagnosis of HCC was done according to the international criteria.15 All HBV patients were positive for HBsAg with Enzyme-linked immunosorbent assay (ELISA) and HBV-DNA with reverse transcription- polymerase chain reaction (RTPCR).
Clinical data of patients were extracted from the hospital records. The Ethics Committee of the Zahedan University of Medical Sciences (ZAUMS) reviewed the study and approved it through project-specific code, IR.ZAUMS.REC.1394.211, No.7262. Procedural steps were taken in the Infectious Diseases and Tropical Medicine Research Center, Zahedan, Iran and Histology Department (ZAUMS). The informed consent was obtained from all participants.
Clinicopathological data were as follow. The study population consisted of 30 healthy subject, 6 females and 24 males with a mean age of 52.33 ± 6.216 (age range of 37-61, median=51.5 years). A total of 121 cases were included in this study; 40 patients of the cases had HBV infection (28 males and 12 females, 53.85 ± 9.582 mean age years, age range of 31-71, median=58 years), 41 patients with HCC (32 males and 9 females, 55.44 ± 10.305 mean age years, age range of 30-72, median=56 years), and 40 patients with HBV+HCC (29 males and 11 females, 57.13 ± 9.819 mean age years, age range of 37-72, median=59 years).
Tissue samples and stereology
We used fine needle aspiration biopsy (FNAB) of the liver with 20-23 G needles. Finally, we had cylindrical tissue samples with more than 1 cm in length, and 1 mm in thickness. Quantitative parameters, their names, abbreviation and dimensions, magnification used for quantification, and biological interpretation are listed in Table 1. The liver samples were fixed in formalin (10%) and embedded in paraffin and processed for histological examination and stereology.16,17 The liver tissues were submerged in Lillie fixative for 1 week at room temperature and then were processed and embedded vertically in paraffin wax. Then, each liver sample was exhaustively sectioned into 4 μm-thick sections by a fully automated rotary microtome (Leica RM2255, Germany). Each of these sections was stained with hematoxylin and eosin and mounted. From each liver sample, 10-15 sections were chosen by systematic uniform random sampling (SURS) method as previously described.18-20 Cavalieri’s principle was used to estimate the volume of liver samples using the formula:
Table 1.
Quantitative parameters and biological interpretation.

where V is the estimated volume of the liver samples, is the sum of the number of points landing within the liver profiles, a (p) is the area associated with each point, t is the distance between sections, and M is the magnification. 18-20
Six to eight fields were selected via SURS on each section, by movement of the microscope’s stage in X and Y directions using the Vernier scale of a projection microscope. Then, a probe of points was projected randomly on these fields (Figure 1). The points that hit to the desired components (hepatocytes, Kupffer cells, connective tissue in the portal space and connective tissue in other places) were counted. An estimate of the volume density (Vv) of the components in the reference space was obtained using the formula:
Figure 1.
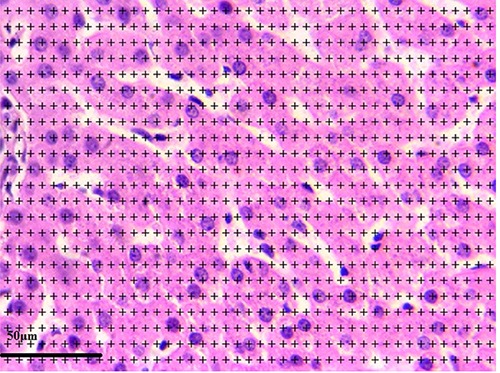
A light microscopic image from a selected liver section after superimposing a point-counting grid on it. The image shows a section of liver from the control healthy group.
| Vv)=Ppart ⁄ Ptotal |
where Ppart is the number of test points falling in all structure profiles of desired part of the tissue and Ptotal is the number of points that hit to all liver tissue.18,21 For estimating the number of Kupffer cells, 5-7 sections in every 40 μm were sampled for immunostaining against CD163, as per the protocol previously described.22 Briefly, deparaffinized sections were hydrated in a graded series of ethanol solutions. Endogenous peroxidase was blocked with aqueous 0.3% H2O2 for 30 min. Antigen retrieval was performed by autoclave and treatment with 10 mmol/L sodium citrate buffer at 120°C for 20 min. Mouse monoclonal antibodies to CD163 (CD163, GHI/61, Santa Cruz Biotechnology, Inc., Santa Cruz, CA, USA) was used for immunostaining. The samples were exposed to peroxidase, protein blocker, primary antibody, secondary antibody, and polymer, and then they were stained with chromogen and hematoxylin. The slides were evaluated microscopically for the number of Kupffer cells afterwards.
In regard to the numerical density of hepatocytes and Kupffer cells, desired elements (hepatocytes and Kupffer cells) were counted using a Cavalieri–physical disector combination method.23-25 For this purpose we used 5-7 paired sections separated by 20 μm, and estimated the numerical density of hepatocytes and Kupffer cells in an unbiased manner with the following formula (Figures 2 and 3):
Figure 2.
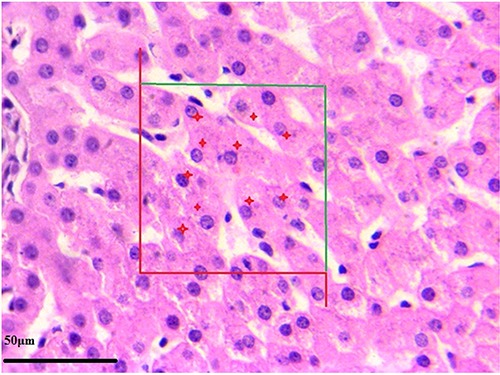
Stereological estimation of the number of hepatocytes by the Cavalieri-physical disector combination method. The image shows a section of liver from the control healthy group. In the counting frame, all the profiles trapped completely inside the frame and the profiles hit by the inclusion edge (green lines) must be counted (shown with red star). However, any profile hitting the exclusion edges and their extensions (shown in red) must be excluded from counting.
In this formula, Nv is the number of desired particles (hepatocytes and Kupffer cells) per unit volume of whole subject (liver) and ΣQ’ is the total number of particles counted in all selected disector frames. ΣVdis represents the sum of volumes of all dissector frames that is obtained from multiplying the number of frames by the area of each dissector frame by the height of dissector (distance between two sections: 20 μm). Quantitative cytomorphological parameters including volume of hepatocytes was estimated in all the groups using physical disector.
Serial 4 μm thick tissue sections were deparaffinized in xylene and rehydrated through a decreasing series of ethanol. Hepatocytes were localized immunohistochemically using the peroxidase-antiperoxidase method. To visualize the hepatocyte cell-membrane, following in-house protocol monoclonal NCL-β-catenin (Novocastra™, Newcastle, UK) added diluent (Dako, Glostrup, Denmark) 1:50 was used as the primary antibody (incubation time: 32 min.). The sections were counterstained with hematoxylin (incubation time: 8 min). Control sections were incubated with PBS without primary antibody. The mean volume of a single hepatocyte cell (Vhep) is equivalent to the total volume occupied by hepatocyte cells (Vtotal hep) divided by their number (No). The total volume of the hepatocyte cells was estimated as the sum of the total volume of immunohistochemically labeled hepatocytes:
| Vhep = Vtotal hep. ⁄No |
All stereological analyses were done on slides that were mask-coded.
Data analysis was performed using SPSS-20 software and comparison between the groups was done using nonparametric statistical test of Mann-Whitney U test and P<0.05 was taken as the significant level.
Results
Demographic data of each case groups were compared with the control group. All groups were matched in terms of age and gender; therefore, there was no significant difference between the four groups (P>0.05).
Quantitative findings
Quantitative analysis of liver samples indicated that there were statistically significant differences in the numerical density of hepatocytes, hepatocyte volume, numerical density of Kupffer cells, volume density of the connective tissue in the portal space and volume density of the connective tissue in other places of tissue as fibrosis tissue between control and HBV+HCC and HBV groups (Figure 4). The results of this comparison are shown in Figures 5-9.
Figure 4.
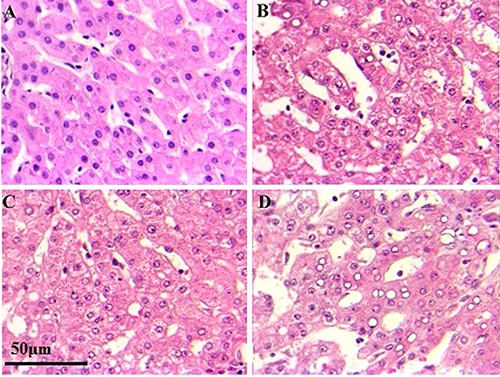
Light-microscopic images of Mayer’s Hematoxylin-stained optical sections of liver from the control healthy subjects (A), only chronic HBV infection (B), only early hepatocellular carcinoma (C), and early HBV-related HCC (D) groups depicting details of the liver microstructure. B) Chronic hepatitis B pattern with significant lobular inflammation, ballooned hepatocytes; this biopsy shows severe inflammation with necrosis in numerous area and loss of architecture. C) Feature of low grade nodule showing a slight increase in cellularity, compared with the control tissue without architectural atypia (A). D) Growth patterns of hepatocellular carcinoma with HBV infection, trabecular pattern with pseudoglandular growth pattern and giant cell formation are obvious. H&E: 400x.
The numerical density of hepatocytes per 1 mm3 was 203×103 (SE=0.629) for the C group, 200×103 (SE=0.852) for the HBV group, 199×103 (SE=0.824) for the HCC group, and 196×103 (SE=0.816) for the HBV+HCC group. The HBV+HCC group data were lower than the other three groups (P<0.001; Figure 5). The mean volume of hepatocytes was 5266±30.13 μm3 for the C group, 5379±27.60 μm3 for the HBV group, 5362±28.95 μm3 for the HCC group, and 5484±20.76 μm3 for the HBV+HCC group. Data from the HBV+HCC group were greater than the other groups (P<0.001; Figure 6). The numerical density of Kupffer cells per 1 mm3 was 14.00×10³ (SE=0.249) for the C group, 15.18×10³ (SE=0.265) for the HBV group, 14.49×10³ (SE=0.195) for the HCC group, and 16.80×10³ (SE=0.236) for the HBV+HCC group. The HBV+HCC group data were greater than the other three groups (P<0.001; Figure 7). The volume density of the connective tissue in the portal space amounted to 9.24±0.188 in the C group, 10.13±0.204 in the HBV group, 9.71±0.185 in the HCC group, and 10.90±0.199 in the HBV+HCC group. Apparent increases were revealed in HBV+HCC group compared to the other three groups (P<0.001; Figure 8). Additionally, volume density of the connective tissue relative to the liver parenchyma in the section was 23.29±0.525 in the C group, 25.09±0.461 in the HBV group, 24.06±0.470 in the HCC group, and 26.80±0.310 in the HBV+HCC group. Apparent increases were shown in HBV+HCC group compared to the other three groups (P<0.001; Figure 9).
Figure 5.
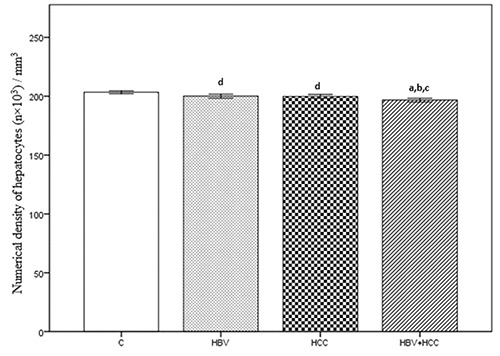
Numerical density of hepatocytes (n×103) / mm3, in control (C), only chronic HBV (HBV), only early hepatocellular carcinoma (HCC) and early HBV-related HCC (HBV+HCC). Coefficient of error for point counting is less than 0.05. aP<0.001 compared to control group; bP<0.05 compared to HBV group; cP<0.05 compared to HCC group; dP<0.05 compared to control group.
Figure 6.
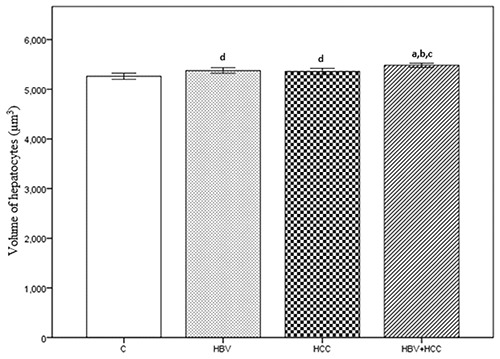
Volume of hepatocytes (μm3), in control (C), only chronic HBV (HBV), only early hepatocellular carcinoma (HCC) and early HBV-related HCC (HBV+HCC). Coefficient of error for point counting is less than 0.05. aP<0.001 compared to control group; bP<0.05 compared to HBV group; cP<0.05 compared to HCC group; dP<0.05 compared to control group.
Figure 7.
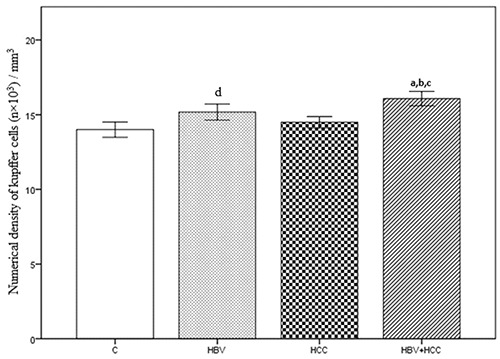
Numerical density of Kupffer cells (n×103) / mm3, in control (C), only chronic HBV (HBV), only early hepatocellular carcinoma (HCC) and early HBV-related HCC (HBV+HCC). Coefficient of error for point counting is less than 0.05. aP<0.001 compared to control group; bP<0.05 compared to HBV group; cP<0.05 compared to HCC group; dP<0.05 compared to control group.
Figure 8.
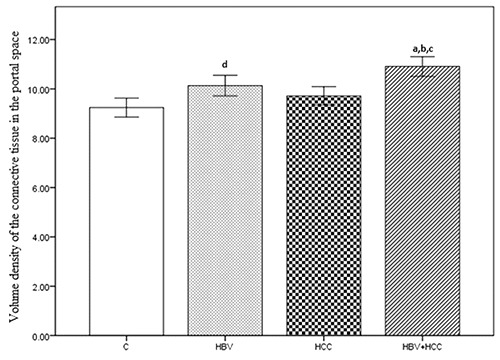
Volume density of the connective tissue in the portal space, in control (C), only chronic HBV (HBV), only early hepatocellular carcinoma (HCC) and early HBV-related HCC (HBV+HCC). Coefficient of error for point counting is less than 0.05. aP<0.001 compared to control group; bP<0.05 compared to HBV group; cP<0.05 compared to HCC group; dP<0.05 compared to control group.
Figure 9.
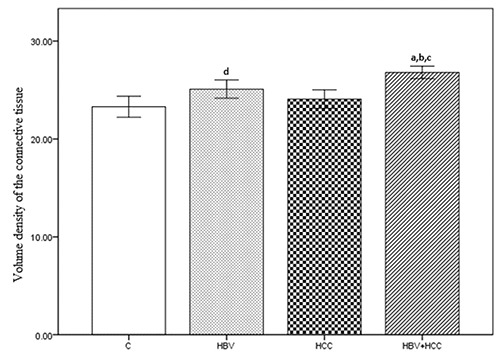
Volume density of the connective tissue, in control (C), only chronic HBV (HBV), only early hepatocellular carcinoma (HCC) and early HBV-related HCC (HBV+HCC). Coefficient of error for point counting is less than 0.05. aP<0.001 compared to control group; bP<0.05 compared to HBV group; cP<0.05 compared to HCC group; dP<0.05 compared to control group.
Discussion
Environmental and laboratory manipulations can change the morpho-physiological condition of liver tissue as one of the most sensitive organs. In HBV-related HCC, the hepatocellular nodular lesions have been considered relevant histopathological biomarkers. In the present study we performed a quantitative evaluation of stereological parameters of liver, in patients with chronic HBV alone, patients with early HCC without HBV, patients with HBVrelated early HCC and healthy subjects.
The stereology was effective in recognizing the changes in the hepatocytes and connective tissue in liver which led to the diagnosis of cancer-prone patients.
We have measured the connective tissue of the liver and the results showed that this structural component of the liver has an active participation in HBV infection and HBV-related HCC. It is possible that an increase in liver connective tissue could be one of a plethora of some evidence contributing to the organ destruction observed in the present study. In morphological measurement, image analysis is the gold standard used specially for quantification of fibrosis. It has a very low coefficient of variation.26 In some studies, morphometric techniques have been used to assess fibrosis in patients with chronic HCV.26 In a study by Zaitoun et al.13 used stereology instead of morphometry and determined fibrosis in chronic HCV. They reported a special increase in the area fraction that associated with severity of disease. Some other systems such as modified Ishak scoring model have been introduced to assess fibrosis as a semiquantitative method.27 It seems that these methods are subjective and it is difficult to compare the results of the different scoring systems because of the high variation in grading and staging of fibrosis. Current study used stereological technique for analyzing the fibrosis and showed an increase in the mean value of connective tissue in parenchyma and connective tissue in the portal space in the patients with HBVrelated HCC compared to the HBV infected patients (P<0.05). Some previous studies13,26,28 have shown a similar change in patients using the stereological technique.
In addition, current study compared the degree of periportal fibrosis between chronic HBV and HBV-related HCC patients. We found a significant increase of periportal fibrosis in patients with HBV-related HCC compared to the subjects with only HBV. Some studies have shown that periportal fibrosis -as the liver lesion is the first marker for cirrhosis. Concurrent evaluation of fibrosis in both periportal tissue and total parenchyma of liver can determine the origin of fibrosis in chronic liver diseases. The studies show that the origin of fibrosis in alcoholic liver disease and chronic hepatitis are pericentral/pericellular and periportal, respectively. Also, pericentral fibrosis can be a precursor of cirrhosis.13 A careful study of fibrosis progression can improve the patient’s life. Given that necro-inflammatory lesions and collagen content can predict the progression of liver disease in patients with chronic HBV,29 an accurate assessment of these values is vital.
The main advantage of stereological techniques is that the results can be interpreted in the same way in different studies and evaluated by appropriate procedures. In this regard, other studies have also shown that stereology is a reliable technique to study the mechanisms of the origin and spread of liver fibrosis, both in small and large animals. Machado et al.30 and Fakhoury-Sayegh et al.31 have studied fibroses of different etiologies in mice and rats, respectively. Also, given that small animal models create problems in the study due to the small organ size,32 it was better to study some aspects of liver physiology (such as bridging fibrosis, modelling of trauma and regeneration) in bigger animal models such as sheep and the porcine.33-36
The major benefit of using larger animal models is the possibility to translate the results to human medicine.37,38 Recently, Mik et al.39 assessed connective tissue of interlobular and intralobular hepatic parenchyma in normal pig livers using stereological point grids. They reported significant variations in the connective tissue fraction at all sampling levels. Such studies show that stereology may facilitate the power analysis of histological quantification of liver especially for detecting increase or decrease in the connective fraction.
The mechanisms of liver diseases are complicated in a way that understanding their pathophysiology needs quantitative data. Design-based histological techniques can show morphological characteristics of hepatocytes and other structures of liver tissue. 40,41 Some quantitative parameters such as whole liver volume, the volume densities of organ, the mean volume and total numbers of hepatocytes, the numerical densities of cells per volume unit have been assessed in animal models.42,43 In other studies,43-45 the authors used stereological methods to assess the numerical density of mononuclear hepatocytes or binuclear hepatocytes in mice and rats. In a study by Marcos et al.42 they used both stereology and cytometric analysis to assess hepatocytes, Kupffer cells and hepatic stellate cells quantitatively, in the rat liver. There are some other quantitative methods that are based on image analysis, cell proliferation, protein concentration and DNA content.46-49 In these methods, single cell suspensions or liver homogenates had been used as samples. An unbiased measurement of hepatocytes and Kupffer cells is necessary to understand the pathology of liver diseases. In this regard, Khan et al.50 assessed the number-weighted volume of hepatocytes, the numerical density of hepatocytes, and the fraction of binuclear hepatocytes in the porcine liver. They showed comparable size, nuclearity and density of hepatocytes in hepatic lobes.
In the present study, the entire hepatocyte was defined as the counting unit, regardless of its nuclei number. By reviewing various articles, we found that there were some different stereological approaches to count hepatocytes. Karbalay-Doust et al.,43 Neves et al.51 and Altunkaynak et al.52 used the nuclei as the counting unit and reported the numerical density of hepatocyte nuclei, numerical density of uni- and binucleate hepatocytes, or discriminating between uni- and binucleate hepatocytes, but did not assess the numerical density of hepatocytes. In such reports, authors mentioned an equality between the number of hepatocyte nuclei and numerical density of hepatocytes themselves. We do not agree with this approach. In another study, authors used the immunohistochemistry techniques for counting of uni- and binucleate hepatocytes by polyclonal antibodies.10 Although there is an association between immunohistochemistry and stereology, some antibodies are not suitable for the prominent labelling of hepatocytes.10,53 Therefore, an unequivocal identification of hepatocytes by immunohistochemistry is not useful solely. So, in this study it seems that we produced an accurate and precise estimation of numerical density of hepatocytes with a lower and acceptable coefficient of error.
Hepatocyte volume was estimated in four groups. HBV hepatocytes are smaller than HBV-related HCC. Regarding the inflammation of the tissue in the present study, this led to an increase in the hepatocyte volume via the cell hypertrophy. We hypothesize that increase in the hepatocyte volume of HBV-related HCC could be caused by the inflammatory reactions which induced damage to the hepatocyte structure. But, on the other hand, qualitative findings by transmission electron microscopy showed that the number of organelles were reduced and played an additional role in liver damage.14 According to studies, liver and hepatocyte hypertrophy were caused by increasing in the flow of inflammatory factors to the liver after prolonged chronic infection such as HBV. It also is interesting to observe the relationships between the liver and its compartment units. When the liver size is increased in HBV-related HCC, the organelles decrease in the total number. The explanation of this phenomenon may rest on the fact that inflammatory reactions can cause excessive cell proliferation and, consequently, cell death. Moreover, lipid infiltration, diffuse intracellular cholestasis, acidophilic degeneration and alterative component can cause hepatocyte hypertrophy and degeneration. Also, destruction of the cytoplasmic organelles can be corresponded to the infectious process activity.14 A trend to an increase in the hepatocyte volume was traced in HBV-related HCC group in cases with high activity of the infectious process in comparison with the parameter in only HCC patients without infectious activity. It may be due to high volume/volume proportion of the protein synthesizing compartment and mitochondrial organelles vs hepatocyte cytoplasm. In addition, high activity of hepatitis infection was associated with a higher structural density of lipid incorporations.
In HBV+HCC group, other remarkable finding, there were many Kupffer cell (KC) in sinusoidal structures. The Kupffer cells are mostly located in the sinusoidal lumen and anchored on endothelial cells.54 This strategic position is determinant for removing particulate and soluble material from portal blood. Kupffer cells plays a role in the initiation of immunological responses. They have a functional relationship with hepatocytes and hepatic stellate cells by producing several cytokines in liver regeneration and fibrogenesis.55 In liver injuries the Kupffer cells population increases due to the recruitment of monocyte-derived cells and proliferation of local cells.55 The Kupffer cells have been shown to participate, with different quantitative expansion, in acute liver injury,56 cirrhosis57 and hepatocarcinogenesis. 58 It was shown that the imbalance of the Kupffer cells number may aggravate liver inflammatory changes.59
Current study has shown the application of the stereology in diagnosis of HCC susceptible patients with HBV. This method can be used to study the changes in liver tissue when using a new treatment. Also, stereological parameters can follow up patients with chronic hepatitis B.
Consequently, stereology is a simple and reliable quantitative technique for the measurement of liver elements such as the number of hepatocytes and Kupffer cells and volume density of the connective tissue in different aria of the liver in patients with chronic hepatitis B. Also, it can assess the fibrosis in biopsy specimen. We recommend this method as one of the most important tools for follow up of patients because it has a high reproducibility in intra field assessment and low intra observer variability. We hope that the results elicited by the present study can be translated into improving the diagnosis conditions for populations worldwide, especially for those individuals living in poor and developing countries.
Figure 3.

Stereological estimation of the number of Kupffer cells by the Cavalieri-physical disector combination method. The image shows a section of liver from the control healthy group. In the counting frame, all the profiles trapped completely inside the frame and the profiles hit by the inclusion edge (green lines) must be counted (shown with red star). However, any profile hitting the exclusion edges and their extensions (shown in red) must be excluded from counting.
Acknowledgements
This study was supported by a dissertation grant (Ph.D. thesis of BM #7262, IR.ZAUMS.REC.1394.211) from the deputy for Research, Zahedan University of Medical Sciences. The authors would like to thank all the subjects who willingly participated in the study. We would like to express our special appreciation and thanks to Professor Jens Randel Nyengaard. He has been a tremendous mentor for our team. We would like to thank him for encouraging our research. His advice on both research as well as on our career has been invaluable.
References
- 1.Ferenci P, Fried M, Labrecque D, Bruix J, Sherman M, Omata M, et al. World Gastroenterology Organisation Guideline. Hepatocellular carcinoma (HCC): a global perspective. J Gastroint Liver D 2010;19:311-7. [PubMed] [Google Scholar]
- 2.El-Serag HB, Rudolph KL. Hepatocellular carcinoma: epidemiology and molecular carcinogenesis. Gastroenterology 2007;132:2557-76. [DOI] [PubMed] [Google Scholar]
- 3.Moudi B, Heidari Z, Mahmoudzadeh -Sagheb H. Impact of host gene polymorphisms on susceptibility to chronic hepatitis B virus infection. Infect Genet Evol 2016;44:94-105. [DOI] [PubMed] [Google Scholar]
- 4.Alavian SM, Haghbin H. Relative importance of hepatitis B and C viruses in hepatocellular carcinoma in EMRO countries and the Middle East: A systematic review. Hepat Mon 2016;16:e35106. [DOI] [PMC free article] [PubMed] [Google Scholar]
- 5.Tawada A, Kanda T, Yokosuka O. Current and future directions for treating hepatitis B virus infection. World J Hepatol 2015;7:1541-52. [DOI] [PMC free article] [PubMed] [Google Scholar]
- 6.Ferrell LD, Crawford JM, Dhillon AP, Scheuer PJ, Nakanuma Y. Proposal for standardized criteria for the diagnosis of benign, borderline, and malignant hepatocellular lesions arising in chronic advanced liver disease. Am J Surg Pathol 1993;17:1113-23. [DOI] [PubMed] [Google Scholar]
- 7.Lun-Gen L. Antiviral therapy of liver cirrhosis related to hepatitis B virus infection. J Clin Transl Hepatol 2014;2:197-201. [DOI] [PMC free article] [PubMed] [Google Scholar]
- 8.Torkzad MR, Noren A, Kullberg J. Stereology: a novel technique for rapid assessment of liver volume. Insights Imaging 2012;3387-93. [DOI] [PMC free article] [PubMed] [Google Scholar]
- 9.Xu Y, Pitot HC. A software package to improve image quality and isolation of objects of interest for quantitative stereology studies of rat hepatocarcinogenesis. Comput Methods Programs Biomed 2006;81:236-45. [DOI] [PubMed] [Google Scholar]
- 10.Marcos R, Monteiro RA, Rocha E. Design-based stereological estimation of hepatocyte number, by combining the smooth optical fractionator and immunocytochemistry with anti-carcinoembryonic antigen polyclonal antibodies. Liver Int 2006;26:116-24. [DOI] [PubMed] [Google Scholar]
- 11.Santos M, Monteiro RA, Rocha E. A stereological study of the volumeweighted volume and of the relative volume of the nucleus of normal and preneoplastic hepatocytes in a trout model of hepatocarcinogenesis. Exp Toxicol Pathol 2013;65:623-30. [DOI] [PubMed] [Google Scholar]
- 12.Saxena R. Practical hepatic pathology: A diagnostic approach. Elsevier; 2017. [Google Scholar]
- 13.Zaitoun AM, Al Mardini H, Awad S, Ukabam S, Makadisi S, Record CO. Quantitative assessment of fibrosis and steatosis in liver biopsies from patients with chronic hepatitis C. J Clin Pathol 2001;54(6):461-5. [DOI] [PMC free article] [PubMed] [Google Scholar]
- 14.Postnikova OA, Aidagulova SV, Nepomnyashchikh DL, Nokhrina Zh V, Vinogradova EV, Karavaeva YY. Ultrastructural and stereological study of the liver in chronic mixed HCV+HBV infection. Bull Exp Biol Med 2012;152:764-7. [DOI] [PubMed] [Google Scholar]
- 15.Gibson JB, Sobin LH. Histological typing of tumors of the liver, biliary tract and pancreas. International histological classification of tumors, number 20. WHO 1978:12-30. [Google Scholar]
- 16.Heidari Z, Mahmoudzadesh-Sagheb H, Zakeri Z, Nourzaei N. Stereological changes of human placenta in systemic lupus erythematosus compared with healthy controls. Zahedan J Res Med Sci 2013;15:50-4. [Google Scholar]
- 17.Heidari Z, Sakhavar N, Mahmoudzadesh-Sagheb H, Ezazi-Bojnourdi T. Stereological analysis of human placenta in cases of placenta previa in comparison with normally implanted controls. J Reprod Infertil 2015;16:90-5. [PMC free article] [PubMed] [Google Scholar]
- 18.Heidari Z, Mahmoudzadeh-Sagheb H, Hashemi M, Rigi Ladez MA. stereological analysis of interdental gingiva in chronic periodontitis patients with tumor necrosis factor alpha (-308G/A) gene polymorphisms. Gene Cell Tissue 2014;1:e18315. [Google Scholar]
- 19.Mahmoudzadeh-Sagheb H, Heidari Z, Bokaeian M, Moudi B. Antidiabetic effects of Eucalyptus globulus on pancreatic islets: a stereological study. Folia Morphol 2010;69:112–8. [PubMed] [Google Scholar]
- 20.Heidari Z, Mahmoudzadeh-Sagheb H, Moudi B. A quantitative study of sodium tungstate protective effect on pancreatic beta cells in streptozotocininduced diabetic rats. Micron 2008;39: 1300-5. [DOI] [PubMed] [Google Scholar]
- 21.Howard V, Reed MG. Unbiased stereology: Three-dimensional measurement in microscopy. New York, BIOS Scientific Publishers; 2005. [Google Scholar]
- 22.Moudi B, Heidari Z, Mahmoudzadeh- Sagheb H, Alavian SM, Lankarani KB, Farrokh P, et al. Concomitant use of heat-shock protein 70, glutamine synthetase and glypican-3 is useful in diagnosis of HBV-related hepatocellular carcinoma with higher specificity and sensitivity. Eur J Histochem 2018;62: 2859. [DOI] [PMC free article] [PubMed] [Google Scholar]
- 23.Kaplan S, Odaci E, Canan S, Onger ME, Aslan H, Unal B. The disector counting technique. NeuroQuantology. 2012;10:44-53. [Google Scholar]
- 24.Heidari Z, Mahmoudzadeh-Sagheb H, Sheibak N. Quantitative changes of extravillous trophoblast cells in heavy smoker mothers compared with healthy controls. Reprod Fertil Dev 2017;30: 409-14. [DOI] [PubMed] [Google Scholar]
- 25.Heidari Z, Mahmoudzadeh-Sagheb H, Sheibak N, Nourzaei N. Quantitative changes of extravillous trophoblast cells in placentas of systemic lupus erythematosus patients. J Obstet Gynaecol. 2017;37:746-51. [DOI] [PubMed] [Google Scholar]
- 26.Chevallier M, Guerret S, Chossegros P, Gerard F, Grimaud JA. A histological semiquantitative scoring system for evaluation of hepatic fibrosis in needle liver biopsy specimens: comparison with morphometric studies. Hepatology 1994;20:349-55. [PubMed] [Google Scholar]
- 27.Zaitoun AM, Mardini H, Record CO. Quantitative assessment of fibrosis in liver biopsies from patients with alcoholic and non alcoholic liver disease. J Cell Pathol 1999;4:11-9. [Google Scholar]
- 28.Bedoss P, Poynard T. The Metavir cooperative study group: an algoritham for grading the activity in chronic hepatitis C. Hepatology 1996;24:289-93. [DOI] [PubMed] [Google Scholar]
- 29.Ishak K, Baptista A, Bianchi L, Callea F, De Groote J, Gudat F, et al. Histological grading and staging of chronic hepatitis. J Hepatol 1995;22:696-9. [DOI] [PubMed] [Google Scholar]
- 30.Machado MV, Michelotti GA, Xie G, Almeida Pereira T, Boursier J, Bohnic B, et al. Mouse models of diet-induced nonalcoholic steatohepatitis reproduce the heterogeneity of the human disease. PLoS One 2015;10:e0127991. [DOI] [PMC free article] [PubMed] [Google Scholar]
- 31.Fakhoury-Sayegh N, Trak-Smayra V, Khazzaka A, Esseily F, Obeid O, Lahoud-Zouein M, et al. Characteristics of nonalcoholic fatty liver disease induced in wistar rats following four different diets. Nutr Res Pract 2015;9:350-7. [DOI] [PMC free article] [PubMed] [Google Scholar]
- 32.Lossi L, D'Angelo L, De Girolamo P, Merighi A. Anatomical features for an adequate choice of experimental animal model in biomedicine: II. Small laboratory rodents, rabbit, and pig. Ann Anat 2016;204:11-28. [DOI] [PubMed] [Google Scholar]
- 33.Ghodsizad A, Fahy BN, Waclawczyk S, Liedtke S, Berjon JMG. Portal application of human unrestricted somatic stem cells to support hepatic regeneration after portal embolization and tumor surgery. ASAIO Journal 2012;58:255-61. [DOI] [PubMed] [Google Scholar]
- 34.Bruha J, Vycital O, Tonar Z, Mirka H, Haidingerova L, Benes J, et al. Monoclonal antibody against transforming growth factor Beta 1 does not influence liver regeneration after resection in large animal experiments. In vivo 2015;29:327-40. [PubMed] [Google Scholar]
- 35.Nygard IE, Mortensen KE, Hedegaard J, Conley LN, Bendixen C, Sveinbjornsson B, et al. Tissue Remodelling following Resection of Porcine Liver. BioMed Res Int 2015;2015:248920. [DOI] [PMC free article] [PubMed] [Google Scholar]
- 36.Wang L, He FL, Liu FQ, Yue ZD, Zhao HW. Establishment of a hepatic cirrhosis and portal hypertension model by hepatic arterial perfusion with 80% alcohol. World J Gastroenterol 2015;21:9544-53. [DOI] [PMC free article] [PubMed] [Google Scholar]
- 37.Watson AL, Carlson DF, Largaespada DA, Hackett PB, Fahrenkrug SC. Engineered swine models of cancer. Front Genet 2016;7:78. [DOI] [PMC free article] [PubMed] [Google Scholar]
- 38.Budai A, Fulop A, Hahn O, Onody P, Kovacs T, Nemeth T, et al. Animal models for associating liver partition and portal vein ligation for staged hepatectomy (ALPPS): Achievements and future perspectives. Eur Surg Res 2017;58:140-57. [DOI] [PubMed] [Google Scholar]
- 39.Mik P, Tonar Z, Maleckov A, Eberlov L, Liska V, Palek R. Distribution of connective tissue in the male and female porcine liver: Histological mapping and recommendations for sampling. J Comp Path 2018;162:1-13. [DOI] [PubMed] [Google Scholar]
- 40.Howard CV, Reed MG. Unbiased stereology. Three-dimensional measurement in microscopy. New York: Springer; 2005. [Google Scholar]
- 41.Marcos R, Monteiro RA, Rocha E. The use of design-based stereology to evaluate volumes and numbers in the liver: a review with practical guidelines. J Anat 2012;220:303-17. [DOI] [PMC free article] [PubMed] [Google Scholar]
- 42.Marcos R, Lopes C, Malhao F, Correia- Gomes C, Fonseca S, Lima M, et al. Stereological assessment of sexual dimorphism in the rat liver reveals differences in hepatocytes and Kupffer cells but not hepatic stellate cells. J Anat 2016;228:996-1005. [DOI] [PMC free article] [PubMed] [Google Scholar]
- 43.Karbalay-Doust S, Noorafshan A. Stereological study of the effects of nandrolone decanoate on the mouse liver. Micron 2009;40:471-5. [DOI] [PubMed] [Google Scholar]
- 44.Altunkaynak BZ, Ozbek E. Overweight and structural alterations of the liver in female rats fed a high-fat diet: a stereological and histological study. Turk J Gastroenterol 2009;20:93-103. [PubMed] [Google Scholar]
- 45.Odaci E, Bilen H, Hacimuftuoglu A, Keles ON, Can I, Bilici M. Long-term treatments with low- and high dose olanzapine change hepatocyte numbers in rats. A stereological and histopathological study. Arch Med Res 2009;40:139-45. [DOI] [PubMed] [Google Scholar]
- 46.Asaoka Y, Togashi Y, Mutsuga M, Imura N, Miyoshi T, Miyamoto Y. Histopathological image analysis of chemical-induced hepatocellular hypertrophy in mice. Exp Toxicol Pathol 2016;68:233-9. [DOI] [PubMed] [Google Scholar]
- 47.Best J, Manka P, Syn WK, Dolle L, van Grunsven LA, Canbay A. Role of liver progenitors in liver regeneration. Hepatobiliary Surg Nutr 2015;4:48-58. [DOI] [PMC free article] [PubMed] [Google Scholar]
- 48.Garrido R, Zabka TS, Tao J, Fielden M, Fretland A, Albassam M. Quantitative histological assessment of xenobioticinduced liver enzyme induction and pituitary-thyroid axis stimulation in rats using whole-slide automated image analysis. J Histochem Cytochem 2013;61:362-71. [DOI] [PMC free article] [PubMed] [Google Scholar]
- 49.Miyaoka Y, Ebato K, Kato H, Arakawa S, Shimizu S, Miyajima A. Hypertrophy and unconventional cell division of hepatocytes underlie liver regeneration. Current Biol 2012;22:1166-75. [DOI] [PubMed] [Google Scholar]
- 50.Junatas KL, Tonar Z, Kubikova T, Liska V, Palek R, Mik P, et al. Stereological analysis of size and density of hepatocytes in the porcine liver. J Anat 2017;230:575-88. [DOI] [PMC free article] [PubMed] [Google Scholar]
- 51.Neves RH, Alencar AC, Aguila MB, Mandarim-de-Lacerda CA, Machado- Silva JR, Gomes DC. Hepatic stereology of Schistosomiasis mansoni infected- mice fed a high-fat diet. Mem Inst Oswaldo Cruz 2006;101(S1):253-60. [DOI] [PubMed] [Google Scholar]
- 52.Altunkaynak BZ, Ozbek E. Overweight and structural alterations of the liver in female rats fed a high-fat diet: a stereological and histological study. Turk J Gastroenterol 2009;20:93-103. [PubMed] [Google Scholar]
- 53.Fasano M, Theise ND, Nalesnik M, Goswami S, Garcia de Davila MT, Finegold MJ, et al. Immunohi-stochemical evaluation of hepatoblastomas with use of the hepatocyte-specific marker, hepatocyte paraffin 1, and the polyclonal anti-carcinoembryonic antigen. Mod Pathol 1998;11:934-8. [PubMed] [Google Scholar]
- 54.Bouwens L, De Bleser P, Vanderkerken K, Geerts B, Wisse E. Liver cell heterogeneity: functions of non-parenchymal cells. Enzyme 1992;46:155-68. [DOI] [PubMed] [Google Scholar]
- 55.MacSween RNM, Desmet VJ, Roskams T, Scothorne RJ. Developmental anatomy and normal structure. MacSween RNM, Burt AD, Portmann KG, et al., Editors. Churchill Livingstone: New York; 2002. [Google Scholar]
- 56.Johnson SJ, Hines JE, Burt AD. Phenotypic modulation of perisinusoidal cells following acute liver injury: a quantitative analysis. Int J Exp Pathol 1992:765–72. [PMC free article] [PubMed] [Google Scholar]
- 57.Ide M, Yamate J, Machida Y. Macrophage populations, myofibroblastic cells, and extracellular matrix accumulation in chronically-developing rat liver cirrhosis induced by repeated injection of thioacetamide. J Toxicol Pathol 2002;15:19–29. [Google Scholar]
- 58.Johnson SJ, Burr AW, Toole K, Dack CL, Mathew J, Burt AD. Macrophage and hepatic stellate cell responses during experimental hepatocarcinogenesis. J Gastroenterol Hepatol 1998;13:145-51. [DOI] [PubMed] [Google Scholar]
- 59.Kumagai K, Kiyosawa N, Ito K, Yamoto T, Teranishi M, Nakayama H, et al. Influence of Kupffer cell inactivation on cycloheximide-induced hepatic injury. Toxicology 2007;241:106-18. [DOI] [PubMed] [Google Scholar]